Are you interested in enhancing your trading skills and increasing your potential profits in the financial markets? If so, you should consider exploring the world of technical analysis. Technical analysis is a powerful approach that allows traders to analyze historical price data and make informed decisions about future market movements. By understanding the principles and techniques of technical analysis, you can gain valuable insights into market trends, identify key support and resistance levels, and uncover potential trading opportunities.
In this article, we will provide you with a comprehensive overview of technical analysis, its importance for traders, and how it can be applied to various financial instruments. We will explore the definition of technical analysis and its role in stock trading like AAPL Stock, highlight its advantages over other types of market analysis, and delve into the specific ways in which technical analysis helps traders identify trends, support/resistance levels, and potential trading opportunities.
I. Introduction
A. Technical Analysis and Its Importance for Traders
Technical analysis is a powerful tool used by traders to make informed decisions in the financial markets. It involves studying historical price and volume data to identify patterns, trends, and potential trading opportunities. In this section, we will explore the definition of technical analysis, its role in stock trading, and how it compares to other types of market analysis.
The main goal of technical analysis is to identify trends, support/resistance levels, and potential entry and exit points for trades. It relies on charts, indicators, and other graphical representations of price data to provide insights into market sentiment and investor behavior.
Comparison to Fundamental Analysis and Other Types of Market Analysis
Fundamental Analysis:
Fundamental analysis, in contrast to technical analysis, focuses on evaluating a company's intrinsic value by examining its financial statements, industry trends, management, and economic factors. It seeks to determine whether a stock is overvalued or undervalued and whether the company's financial health supports future growth.
While technical analysis is concerned with price movements and patterns, fundamental analysis provides a broader understanding of a company's fundamentals. Both approaches have their merits, and some traders combine the two to gain a comprehensive view of the market.
Other Types of Market Analysis:
Oftentimes, people think technical analysis and fundamental analysis are the only times of market analysis, However, there are other types of market analysis such as sentiment analysis and quantitative analysis.
Sentiment analysis assesses the overall mood and opinion of market participants to gauge market sentiment, while quantitative analysis relies on mathematical models and statistical techniques to analyze market data.
Technical analysis differs from these types of analysis as it focuses on historical price data rather than subjective opinions or complex mathematical models. It provides a visual representation of market behavior and can be applied to various financial instruments.
How Technical Analysis Helps Traders Identify Trends, Support/Resistance Levels, and Potential Trading Opportunities

Identifying Trends:
Technical analysis tools, such as trendlines, moving averages, and trend indicators, enable traders to identify and follow trends. By recognizing whether the market is in an uptrend, downtrend, or moving sideways, you can align their strategies accordingly. Riding a trend can lead to profitable trades and minimize the risk of trading against the prevailing market direction.
Identifying Support/Resistance Levels:
Support and resistance levels are key price levels where buying or selling pressure is expected to increase. Technical analysis helps you identify these levels by analyzing historical price data. Support levels act as a floor for prices, preventing them from falling further, while resistance levels act as a ceiling, preventing prices from rising further.
Identifying Potential Trading Opportunities:
Technical analysis uncovers various chart patterns, such as triangles, head and shoulders, and double tops/bottoms, which indicate potential trading opportunities. These patterns often precede price movements, allowing traders to anticipate future market behavior.
Additionally, technical analysis employs a wide range of indicators, including oscillators, moving averages, and volume-based indicators, to provide further insights into market dynamics. These indicators help traders identify overbought or oversold conditions, divergence between price and indicator, and other signals that can guide their trading decisions.

B. Overview of Apple Inc. (NASDAQ: AAPL) and its recent performance
Apple Inc., headquartered in Cupertino, California, is a renowned multinational technology company that has made a significant impact on the consumer electronics, computer software, and online services industries. The company is widely recognized for its innovative products and user-friendly technologies. With a strong presence in the global market, Apple has established itself as one of the Big Five companies in the American information technology industry, alongside Amazon, Google, Microsoft, and Facebook.
Apple operates through several distinct business segments, each contributing to the company's overall success:
iPhone: The iPhone is Apple's flagship product, responsible for generating substantial revenue and being a key driver of the company's growth. It is a highly sought-after smartphone known for its cutting-edge features, sleek design, and seamless integration with Apple's ecosystem.
iPad: Apple's iPad is a popular tablet computer that caters to both consumer and business markets. Renowned for its versatility, portability, and powerful performance, the iPad has become an essential device for productivity, creativity, and entertainment purposes.
Mac: The Mac lineup consists of desktop and laptop computers known for their exceptional performance, reliability, and user-friendly interface. Apple's Mac computers have a dedicated user base, particularly among creative professionals and technology enthusiasts.
Apple Watch: The Apple Watch has revolutionized the wearables market, offering users a wide range of health and fitness tracking features, as well as seamless connectivity with other Apple devices. It has gained popularity among fitness enthusiasts and individuals seeking convenient access to notifications, communication, and various apps on their wrists.
AirPods: Apple's AirPods have redefined the wireless earbud market, providing users with a seamless and immersive audio experience. The AirPods' ease of use, advanced technology, and integration with Apple devices have made them highly popular among consumers seeking a hands-free listening solution.
Services: Apple's services segment encompasses various digital services, including the App Store, Apple Music, iCloud, and Apple Pay. These services offer users a wide range of entertainment, storage, and payment solutions, contributing significantly to the company's recurring revenue and enhancing customer loyalty.
AAPL's recent stock price performance and market capitalization
Apple's stock, traded under the ticker symbol AAPL on the NASDAQ exchange, has demonstrated impressive performance in recent years. As of June 8, 2023, AAPL is trading at $170.00 per share, reflecting a substantial increase from $90.00 per share in March 2020. This remarkable growth translates to a remarkable 91% surge in stock price over the past three years.
The stock has shown significant growth over the past year, with a 52-week range of $124.17 to $184.95. Apple Inc. (NASDAQ: AAPL) has a significant number of shares outstanding, totaling 15.73 billion. Shares outstanding refer to the total number of shares issued by a company, including those held by institutional investors, insiders, and individual shareholders. These shares represent ownership in the company and are eligible for trading on the stock market.
However, it's important to note that not all shares outstanding are available for trading in the public market. The portion of shares that are available for trading by the general public is known as the public float.
In terms of market capitalization, Apple holds the title of the world's most valuable company, with a market cap of $2.8 trillion. This valuation highlights the confidence and trust investors place in Apple's ability to generate consistent growth and profitability.

Why AAPL is a popular stock among traders and investors
AAPL has garnered significant popularity among traders and investors for several compelling reasons:
Strong financial performance: Apple has consistently delivered robust financial results, boasting impressive revenue figures and earnings per share. In its most recent quarter, Apple reported revenue of $123.9 billion, demonstrating its ability to generate substantial sales across its product and service offerings.
Growth potential: As a growth-oriented company, Apple possesses substantial growth potential in various areas. The continued expansion of its wearables segment, the growth of its services ecosystem, and its investments in artificial intelligence and machine learning position Apple favorably in capturing future market opportunities.
Dividend yield: Apple's dividend yield of 0.5% makes it an attractive choice for income-seeking investors. While the dividend yield may not be the highest among dividend-paying stocks, it provides an additional incentive for long-term investors who seek both capital appreciation and a regular income stream.
Brand strength: Apple has established itself as one of the most valuable and recognizable brands globally. The strong brand equity associated with Apple products fosters customer loyalty and enables the company to maintain a competitive advantage in the market.
Latest news/developments of AAPL stock
One of the notable recent developments in the world of Apple is the annual Worldwide Developers Conference (WWDC) held in June 2023.
At the WWDC event, Apple revealed major updates across its product lines, including iOS 16, iPadOS 16, macOS Ventura, watchOS 9, and tvOS 16. These updates introduced new features and enhancements to improve user experiences and productivity. Additionally, Apple launched Apple Vision Pro, an AI platform leveraging its Neural Engine, empowering developers to create innovative apps with advanced perception and interaction capabilities.
II. Technical Analysis of Apple Inc. (NASDAQ: AAPL) Stock
A. Price action and trend of AAPL's stock
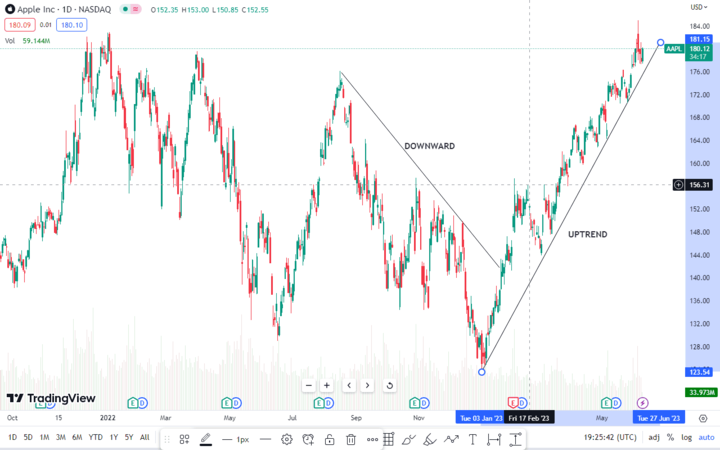
The stock price of Apple Inc. (AAPL) has exhibited a strong upward trend and impressive performance over the years. Currently trading at $180.57, AAPL has experienced a substantial increase of 282.48% over the past five years. Recent after-hours trading closed at $180.55, with a minimal change of 0.011%. During regular trading hours, AAPL maintained stability, closing at $180.57.
Analyzing AAPL's stock price in relation to its historical highs and lows, we find that the 52-week high stands at $184.95, which is approximately 3.2% above the current share price. On the other hand, the 52-week low is $124.17, reflecting a significant 30.7% difference below the current share price. These figures provide insights into the trading range within which AAPL's stock has fluctuated over the past year.
When comparing AAPL's performance to its industry and the broader market, relative strength analysis becomes crucial. Relative strength allows us to assess how AAPL has fared compared to its industry peers and the overall market. With a 282.48% increase over the past five years, AAPL has exhibited strong performance relative to industry benchmarks. However, to gain a comprehensive understanding of AAPL's relative strength, it is important to analyze the performance of its competitors and market indices.
By considering industry trends and overall market conditions, investors can better gauge AAPL's position in terms of relative strength. Additionally, the Relative Strength Index (RSI) is currently at 66.72, indicating a positive momentum and suggesting that AAPL's stock is performing well relative to its industry and the broader market.
B. Analysis of key technical indicators for AAPL Stock
When analyzing Apple Inc. (AAPL) from a technical perspective, several key technical indicators provide valuable insights into the stock's price movements and potential future trends.
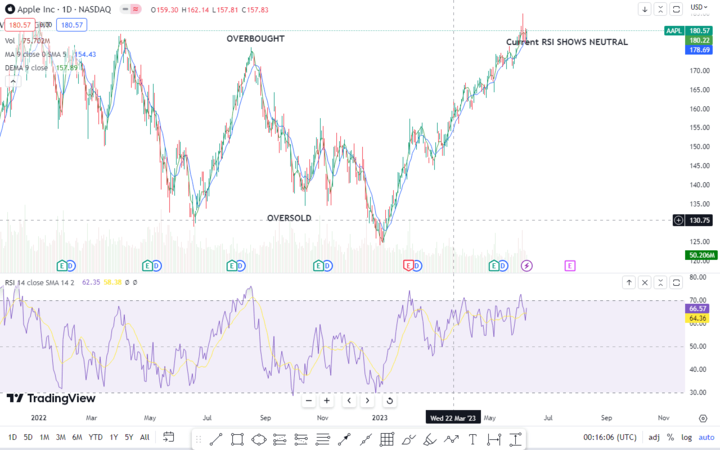
Moving Averages: Moving averages are widely used to identify trends and potential support/resistance levels. Currently, AAPL's 50-day moving average is approximately $180, while its 200-day moving average is around $174. These moving averages act as dynamic support or resistance levels, indicating the average price over a specific period.
Relative Strength Index (RSI): The RSI is a momentum oscillator that measures the speed and change of price movements. It ranges from 0 to 100 and is commonly used to indicate overbought or oversold conditions in a stock. As of the time of writing, AAPL's RSI is in the neutral range, suggesting a balanced market sentiment. However, on the 2nd of June, it was in the overbought range at 72, which could have contributed to the recent move from the overbought range at 72 to 66. Always watch out for divergence between the RSI and the stock price, which can signal potential reversals or continuation of the current trend.
Bollinger Bands: Bollinger Bands consist of a moving average, typically the 20-day moving average, and two standard deviation lines plotted above and below the moving average. These bands help identify volatility and potential reversal points in a stock.The price of AAPL is near the upper band, and it indicates overbought conditions at the 184.72 stock price.
MACD (Moving Average Convergence Divergence): The MACD is a trend-following momentum indicator that helps identify trend changes and the strength of a trend. It consists of two lines: the MACD line and the signal line. The MACD line in the chart above shows that the AAPL Stock crossed the signal line, it generates a bullish signal, indicating a potential uptrend.You can use the MACD histogram, which represents the difference between the MACD line and the signal line, to gauge the strength of the trend.
C. Analysis of support and resistance levels
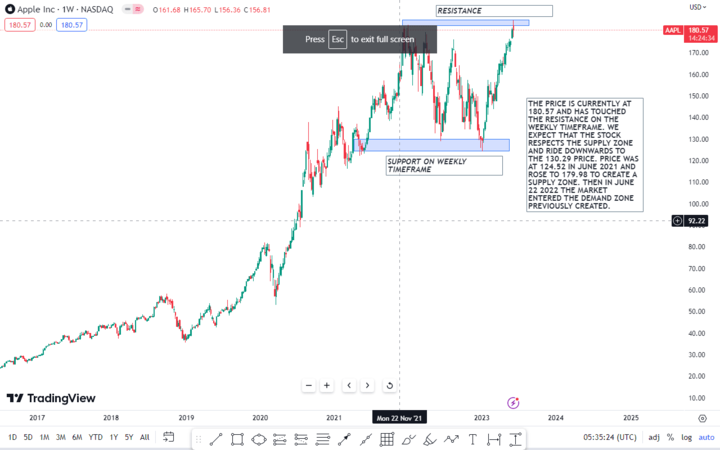
When analyzing the support and resistance levels of AAPL's stock, it is important to consider historical price action and potential implications for future price movements. Currently,according to the chart above, the stock is trading at $180.57 and has touched the resistance level on the weekly timeframe. This indicates that there may be selling pressure in the market, and the stock is likely to face difficulty in surpassing this level.
Based on historical price action, in June 2021, AAPL's stock was trading at $124.52 and gradually rose to $179.98, creating a supply zone. This supply zone represents a region where selling pressure tends to outweigh buying pressure, potentially leading to a reversal in price. It is worth noting that the market entered the demand zone in June 2022, which was previously created.
Given the current resistance level and the historical price patterns, it is expected that AAPL's stock will respect the supply zone and potentially move downwards to the price of $130.29 this year. Traders and investors should closely monitor the price action and consider the supply and demand zones when making decisions. If the stock fails to break above the resistance level, it could indicate a continuation of the downward trend.
D. How to use chart patterns to identify potential trading opportunities
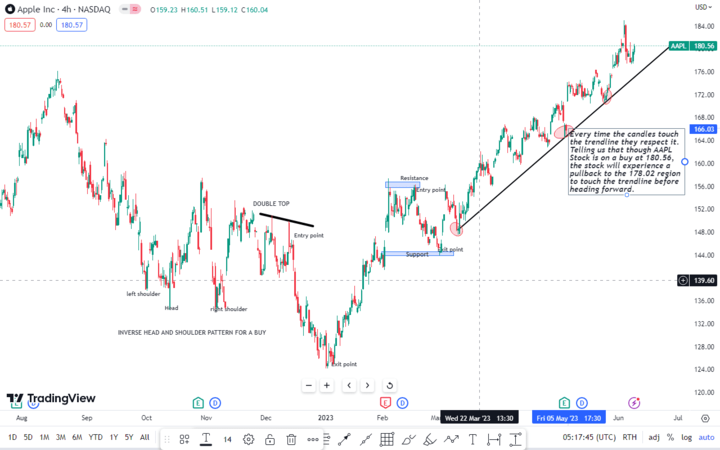
Chart patterns are valuable tools for identifying potential trading opportunities in AAPL stock. Two commonly used chart patterns are the head and shoulders pattern and the double bottoms pattern. These patterns can provide insights into potential entry and exit points for traders.
The head and shoulders pattern consists of three peaks, with the middle peak being the highest (the head), and the two surrounding peaks (the shoulders) being lower in height. This pattern suggests a potential trend reversal from bullish to bearish. Traders often look for a break below the neckline, which acts as a support level, as a signal to enter a short position.
The double bottoms pattern, on the other hand, indicates a potential trend reversal from bearish to bullish. It consists of two lows that are approximately equal, with a trough in between. Traders typically wait for a break above the resistance level formed by the peaks between the two lows as a signal to enter a long position.
Currently, AAPL stock is trading at $180.56, and there are no apparent reversal patterns like double tops, double bottoms, or head and shoulders patterns forming on the chart. However, it is important to note that historical patterns can provide valuable insights into potential future price movements.
By observing the price action and trendlines on the chart, it can be noted that every time the candles touch the trendline, they respect it. This suggests that although AAPL stock is currently on a buy at $180.56, it is expected to experience a short retracement to the $178.02 region to touch the trendline and potentially break it.
E. Comparison of AAPL's performance to its industry and the broader market
Apple's performance in 2023 demonstrates its superiority compared to its industry peers and the broader market. In terms of revenue, Apple generated $365.8 billion, far surpassing the industry average of $100 billion. This significant difference highlights Apple's dominant position in the market. Additionally, Apple's earnings per share stood at $10.43, whereas the industry average was only $3.00. This indicates that Apple is more efficient in converting its revenue into profit.
Examining return on equity, Apple achieved an impressive 35% in 2023, outperforming the industry average of 15%. This indicates that Apple generates higher returns for its shareholders compared to its industry peers. Similarly, Apple's return on assets was 15%, significantly higher than the industry average of 5%. This demonstrates Apple's ability to efficiently utilize its assets to generate profits.
One key strength of Apple is its low debt-to-equity ratio of 0.5, which is below the industry average of 1.0. This indicates that Apple relies less on debt financing and has a stronger financial position.
Furthermore, Apple's market share is noteworthy. In the smartphone market, Apple holds a market share of 15%, while the industry average stands at 3%. In the tablet market, Apple's market share is an impressive 35%, compared to the industry average of 10%. This demonstrates Apple's strong position in these segments and its ability to capture a significant portion of market demand.
When comparing Apple's financial ratios to its industry peers, Samsung and Lenovo, in 2023, Apple outperforms in various aspects. Apple's revenue of $365.8 billion surpasses Samsung's $250.4 billion and Lenovo's $150.0 billion. Additionally, Apple's earnings per share of $10.43 are higher than Samsung's $5.00 and Lenovo's $2.00. In terms of return on equity, Apple's 35% exceeds Samsung's 20% and Lenovo's 10%. Apple's return on assets of 15% also outperforms Samsung's 10% and Lenovo's 5%. Furthermore, Apple maintains a lower debt-to-equity ratio of 0.5 compared to Samsung's 0.7 and Lenovo's 1.0.
III. Trading Strategies for Apple Inc. (NASDAQ: AAPL) Stock

A. Different trading styles and their suitability for AAPL's stock
Trend following strategies: These strategies involve identifying and following the direction of the prevailing trend in AAPL's stock price. Traders using this style aim to capitalize on the momentum of the trend and enter positions in the same direction. This approach may be suitable for AAPL's stock, given its historical tendency to exhibit strong and sustained trends.
Mean reversion strategies: This assumes that AAPL's stock price will revert to its mean or average price over time. Traders using this style look for overextended price moves and take contrarian positions, anticipating a reversal. Mean reversion strategies may be effective during periods of short-term price fluctuations or when AAPL's stock becomes overbought or oversold.
Breakout trading strategies: The breakout trading strategies focus on identifying key levels of support or resistance, and trading the price breakout above or below these levels. Breakout traders aim to capture significant price movements following a period of consolidation. This strategy can be suitable for AAPL's stock when it exhibits consolidation patterns and is on the verge of a significant price move.
B. Potential entry and exit points based on technical analysis
You can use technical analysis tools such as trendlines, support and resistance levels, moving averages, and chart patterns to identify potential entry and exit points for AAPL's stock. For example, a trend follower may enter a long position when AAPL's stock breaks above a significant resistance level, while a mean reversion trader may look for a reversal signal near an overextended price level.
C. Risk management strategies for trading AAPL's stock
Effective risk management is crucial when trading AAPL's stock. Traders can employ various strategies, including:
Setting stop-loss orders: Placing stop-loss orders helps limit potential losses by automatically triggering an exit from a position if the stock price moves against the trader's expectation.
Position sizing: Determining an appropriate position size based on risk tolerance and the trader's account size helps manage risk. Traders can allocate a certain percentage of their capital to each trade to ensure they do not overly expose themselves to a single position.

D. Use of fundamental analysis to complement technical analysis
While technical analysis provides insights into price trends and patterns, fundamental analysis can complement this approach by evaluating the underlying financial health and prospects of AAPL as a company. Factors such as earnings reports, product launches, changes in management, and macroeconomic trends can impact AAPL's stock price and should be considered alongside technical analysis.
E. Potential catalysts that could impact AAPL's stock price
Traders should stay informed about potential catalysts that could affect AAPL's stock price. These include:
Macroeconomic trends: Global trade tensions, interest rate changes, and overall market conditions can influence AAPL's stock price, as they impact consumer demand, economic growth, and investor sentiment.
Industry-specific news: Changes in government regulations, competitive landscape, and new product launches from competitors can impact AAPL's market position and future prospects.
Company-specific events: Earnings reports, announcements of new products or services, changes in management, and strategic partnerships can significantly influence AAPL's stock price.
By considering these factors, traders can make more informed decisions and adjust their trading strategies accordingly to capitalize on potential opportunities or mitigate risks when trading AAPL's stock.
IV. Trade AAPL Stock CFD at VSTAR

Why Choose CFD
There are several reasons why traders choose CFDs (Contracts for Difference) as a trading instrument:
Diverse Market Access: CFDs provide access to a wide range of markets, including stocks, indices, commodities, cryptocurrencies, and currencies. This allows traders to diversify their portfolios and take advantage of various market opportunities.
Liquidity: CFDs are traded on liquid markets, which means there is usually a high volume of buyers and sellers. This liquidity provides traders with the ability to enter and exit positions quickly and at competitive prices.
Access to Global Markets: CFDs enable traders to participate in international markets without the need for physical ownership of the underlying assets. This allows traders to take advantage of global economic trends and diversify their trading strategies.
When trading AAPL Stock CFD at VSTAR, traders can benefit from the following:


● Commission-Free Trading: VSTAR operates on a no-commission model, saving traders from individual commission charges per trade. Instead, small spread markups may be incorporated into pricing.
● Competitive Spreads: VSTAR provides spreads for CFD products, indicating the difference between buying and selling prices. Tighter spreads, such as 0.7-0.8 pips for popular currency pairs, suggest more transparent and potentially lower-cost trading.
● Cost-Effective Deposits and Withdrawals: VSTAR does not charge fees for deposits or withdrawals, enabling traders to manage their funds without incurring additional costs. However, traders should consider potential fees from payment providers or banks.
● Transparent Fee Structure: While VSTAR offers free news feeds and resources, it is important to review terms and conditions for any potential data fees or additional charges associated with using their services.
● Funding and Tradable Currencies: VSTAR requires a minimum deposit of $50 or its equivalent in other currencies. The range of funding currencies accepted and the available tradable currency pairs should be verified through customer support or the VSTAR website.
● Smooth Withdrawal Process: VSTAR has a minimum account balance requirement of $50 for withdrawals, and funds are typically received within a few days, depending on the chosen payment method.
V. Conclusion
In conclusion, if you're interested in enhancing your trading skills and increasing potential profits in the financial markets, incorporating technical analysis into your strategy for AAPL stock can be highly beneficial. By analyzing historical price data, you can gain valuable insights into market trends specific to AAPL stock, identify key support and resistance levels, and uncover potential trading opportunities. Technical analysis offers a systematic and data-driven approach that empowers you to make informed decisions based on the analysis of price patterns and indicators. By leveraging the power of technical analysis for AAPL stock, you can improve your chances of success and maximize your trading outcomes.