


EURUSD
Fundamental Perspective
The EURUSD pair finished above 1.0767, marking the third consecutive weekly decline in March. The USD got significant support from hawkish comments from FED officials.
While the United States showcased resilience with a robust 3.4% annualized growth rate in Q4 GDP, the Eurozone confronted the specter of recession, as Eurostat's data revealed tepid growth rates for 2023.
The divergence in monetary policy stances became more pronounced, with the European Central Bank hinting at potential rate cuts in June, while the Fed signaled a willingness to maintain current interest rates. The policymakers seek to maintain the policy rate to support the inflation rate toward their 2% target level.
Amidst these developments, the US stock market surged, nearing record highs and underscoring investor confidence in the resilience of the American economy. Looking ahead, the focus shifts to forthcoming economic data releases, particularly in the US, where employment figures will play a pivotal role in shaping monetary policy decisions alongside other key economic data releases.
Meanwhile, Eurozone indicators will be closely monitored, including Harmonized Index of Consumer Prices (HICP) preliminary estimation, Retail sales, and Producer Price Index (PPI) data for insights into the region's economic trajectory.
Employment and inflation are key factors for central bank policymakers. The latest core PCE figures allow FED to keep the policy rate unchanged. FED policymakers may deliver only two rate cuts this year compared to the predicted three cuts. These decisions will impact the EURUSD pair in determining the future direction.
Technical Perspective
The EURUSD pair finished the week consecutively lower for the third week, delivering a spinning top candle with a red body, indicating significant sell pressure.
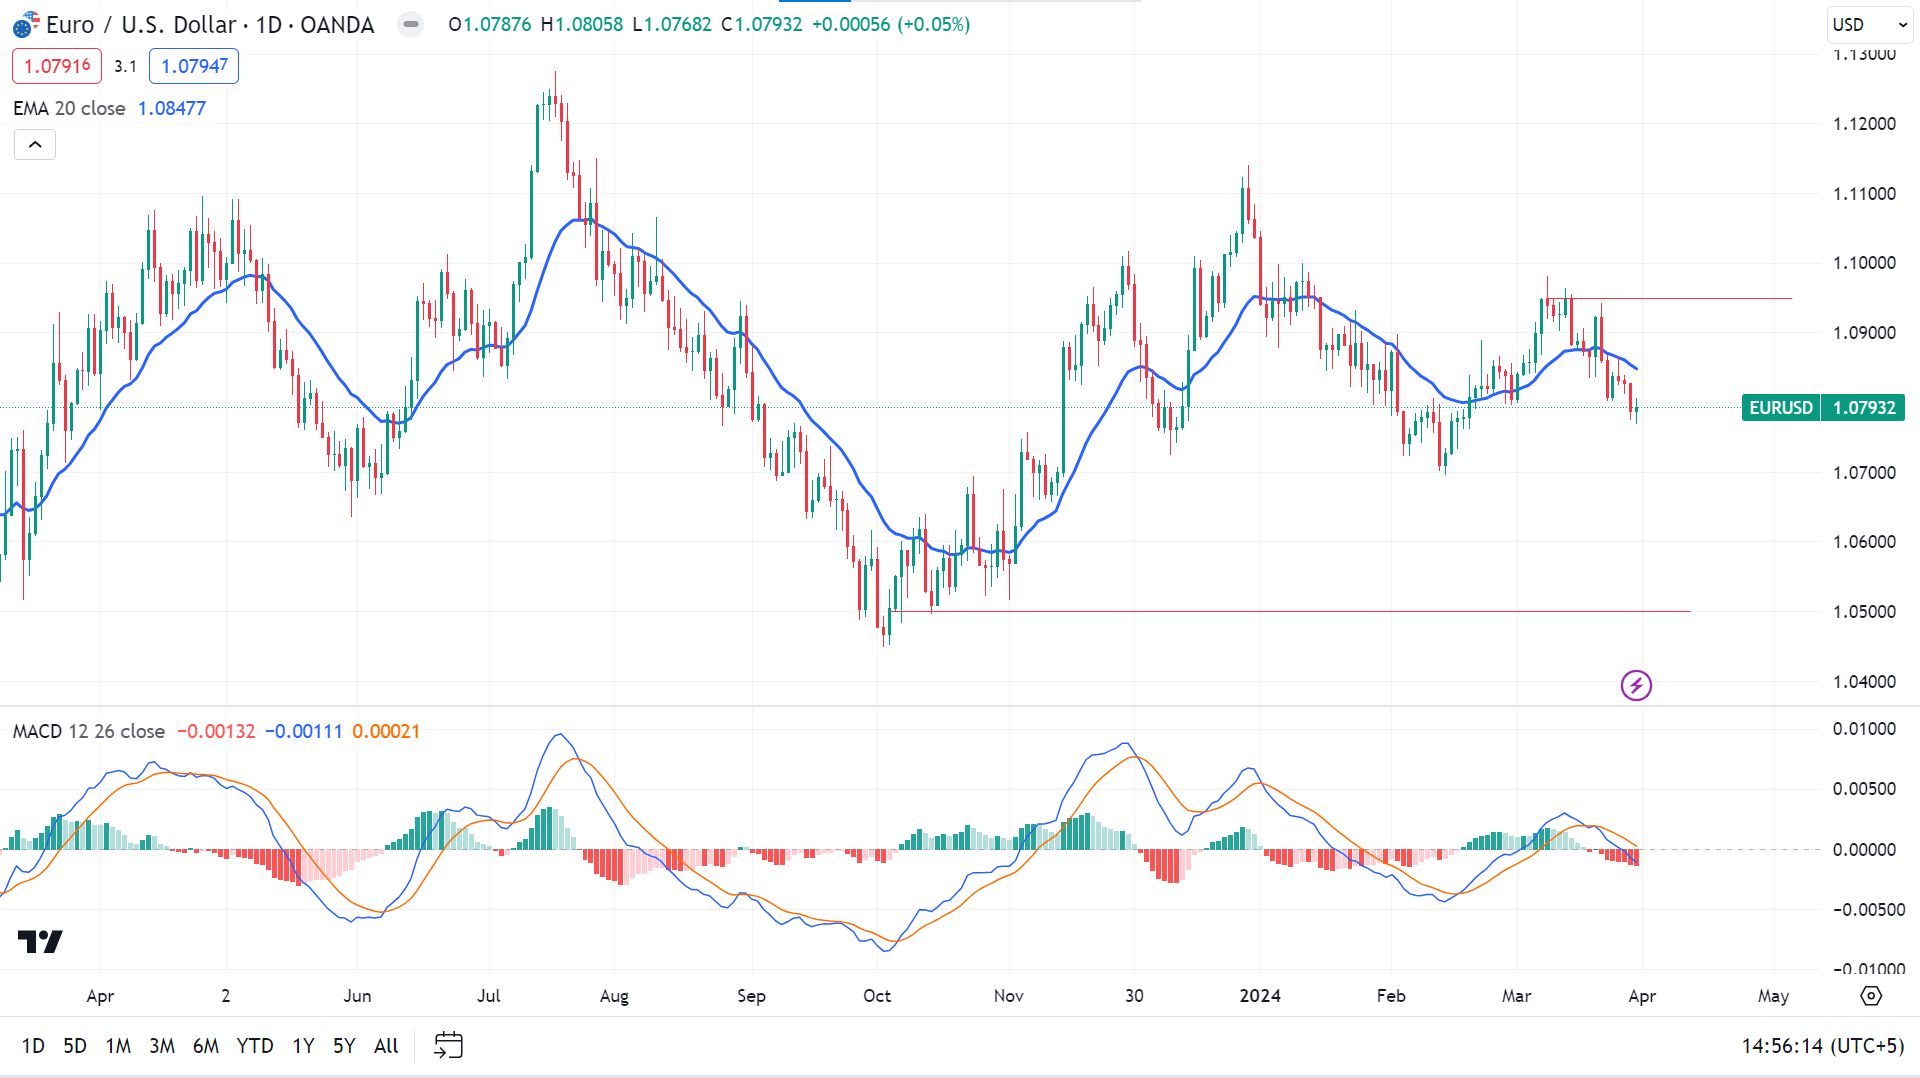
On the daily chart, the price declines below the EMA 20 line, declaring significant bearish pressure on the asset price, indicating the price can drop to the next support level near 1.0700 or toward the next support 1.0500.
On the other hand, with significant buy pressure above the 1.0900 level, the price can reach the recent resistance level near 1.0950 or a breakout above can trigger toward 1.1130.
GBPJPY
Fundamental Perspective
The Pound Sterling (GBP) maintained a defensive stance against the JPY throughout the third consecutive week. Despite hawkish sentiments expressed by Bank of England (BoE) officials, the Pound failed to gain traction.
Traders of the Pound Sterling drive through another week containing shortened trading hours due to the Easter Monday celebration by major economics and UK's cummer time clock switching.
Here, concerns arise over weakening cost-push and services inflation, posing challenges for the Bank of Japan (BoJ). Despite recent rate hikes prompted by improved wage negotiations, the BoJ remains cautious, maintaining its accommodative stance.
Amidst speculation surrounding the BoJ's landmark decision to raise rates from negative territory for the first time in eight years, the central bank's actions indicate a measured approach to policy normalization. The BoJ's commitment to this gradual process is underscored by its ongoing purchase of government bonds at previous levels, aiming to ensure stability and sustainability in inflation amidst evolving economic conditions.
Technical Perspective
The weekly candle of GBPJPY finished forming a doji candle, confirming the bulls are in control for the week.
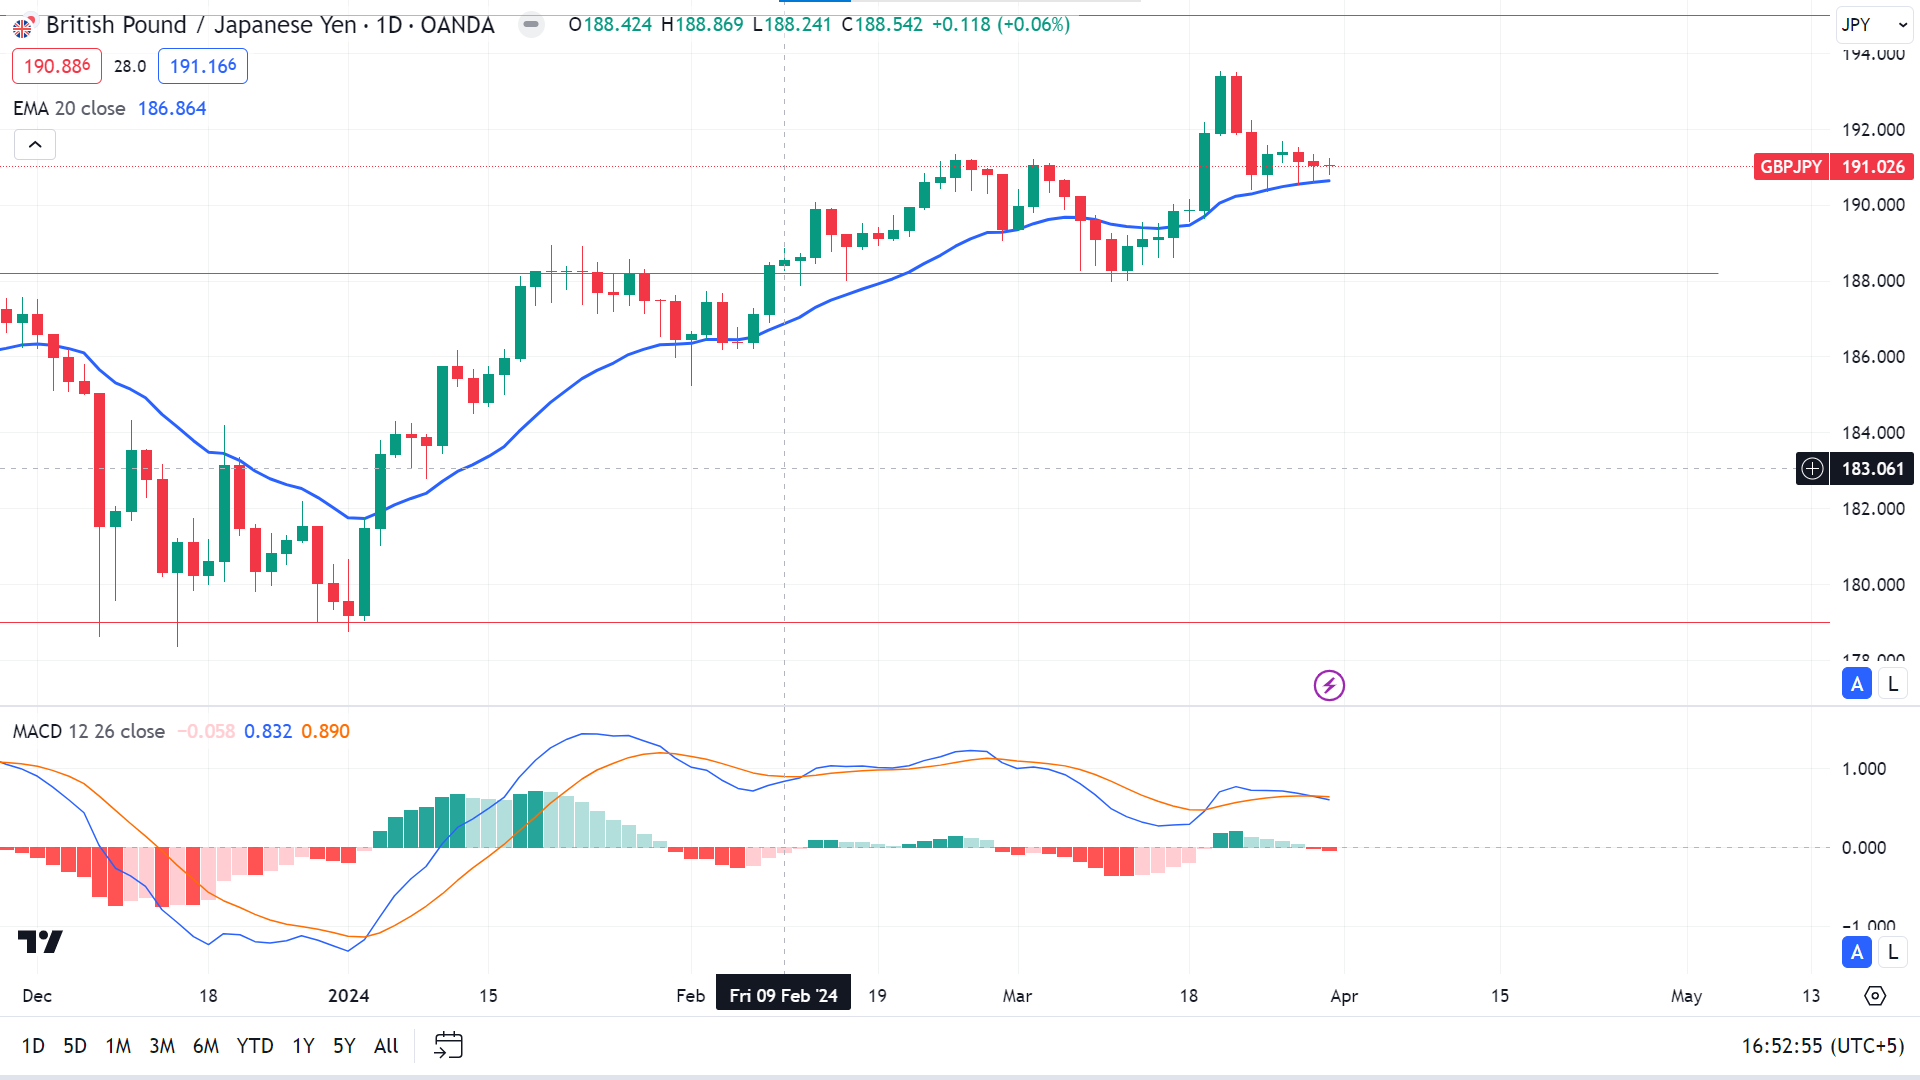
In the daily chart, the price remains above the EMA 20 line, declaring that the price may head toward the long-term resistance level of nearly 195.00 in the upcoming days.
On the other hand, a downside correction to the 188.20 support level is possible, but a breakout below can force the price to reach the long-term support level of nearly 179.00.
Nasdaq 100 (NAS100)
Fundamental Perspective
Despite the Federal Reserve's earnest endeavors and vigorous discourse on tightening monetary policy, the Chicago Fed's National Financial Conditions Index (NFCI) reveals a contrasting reality. The NFCI, registering at -0.56 as of March 22, indicates historically loose monetary conditions. This discrepancy suggests that the Fed's attempts to tighten policy significantly have not materialized as anticipated.
The Federal Reserve has notably reduced the balance sheet by nearly $1.5 trillion, which is impressive till remarking the massive $5 trillion increase during the pandemic crisis and the preceding $4 trillion surge in the aftermath of the Great Recession. This reduction is similar to removing a bucket of water from a vast pool, illustrating the limited impact of the Fed's actions.
Additionally, the Fed's projected timeline to restore the balance sheet to pre-pandemic levels—spanning 7.8 years—fails to address the trillions added post-2008 financial crisis. This discrepancy underscores a cautious approach by the Fed in addressing inflationary pressures, raising questions about the effectiveness of its strategies.
Technical Perspective
The weekly NAS 100 chart shows bulls are in control after a solid bullish candle.
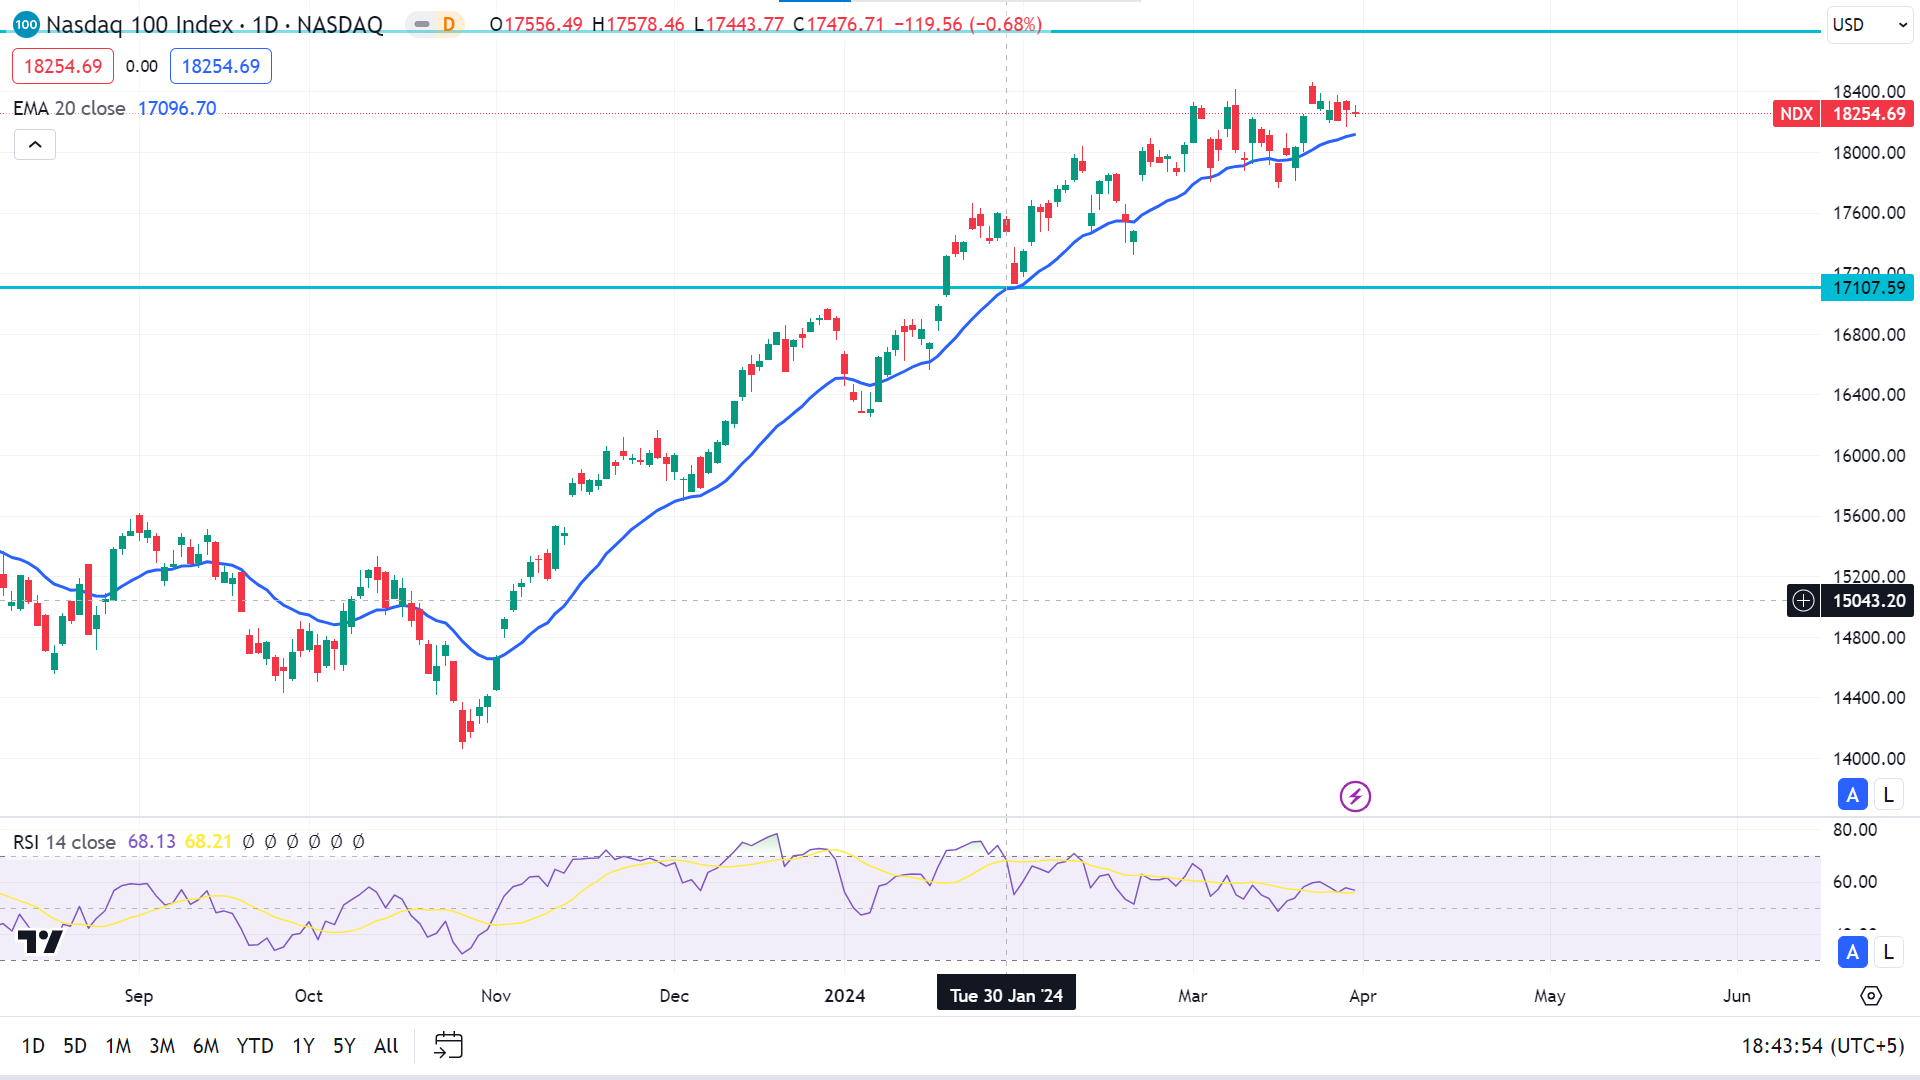
On the daily chart, the RSI index confirms the price remains in bullish territory and can reach the next 18800.00 or more upside near 19000.00 in the upcoming days.
On the other hand, a downside correction is possible towards 18100.00, where a break below this line could initiate more downside to 17800.00 as a correction.
S&P500 (SPX500)
Fundamental Perspective
The simultaneous ascent of the S&P 500 and the Cboe Volatility Index (Vix) has sparked intrigue and speculation in the current market landscape. However, Barbara Reinhard, Chief Investment Officer at Voya Investment Management, offers a nuanced perspective, suggesting that the recent climb in the Vix may not necessarily portend an imminent market downturn. Reinhard posits that Vix's upward trajectory is more likely a reflection of its mean-reverting nature, indicating a potential return to higher volatility levels over the medium term.
Despite Vix's modest 4.3% increase since the quarter's outset, it remains significantly below its long-term average, casting doubt on widespread investor apprehension. Reinhard emphasizes that while the Vix can experience unexpected spikes, its current levels do not necessarily signify an impending market correction.
Meanwhile, the S&P 500 continues its upward trajectory, poised to achieve a remarkable 10% gain for the quarter and setting new record highs. This concurrent rise in both indices amid a period of market tranquility adds an element of curiosity to the situation. While historical trends typically suggest a negative correlation between the Vix and the S&P 500, recent events challenge this conventional wisdom, underscoring the intricate dynamics in today's markets and the need for a nuanced interpretation of indicators.
Technical Perspective
The solid bullish weekly candle suggests the price may continue to uptrend.
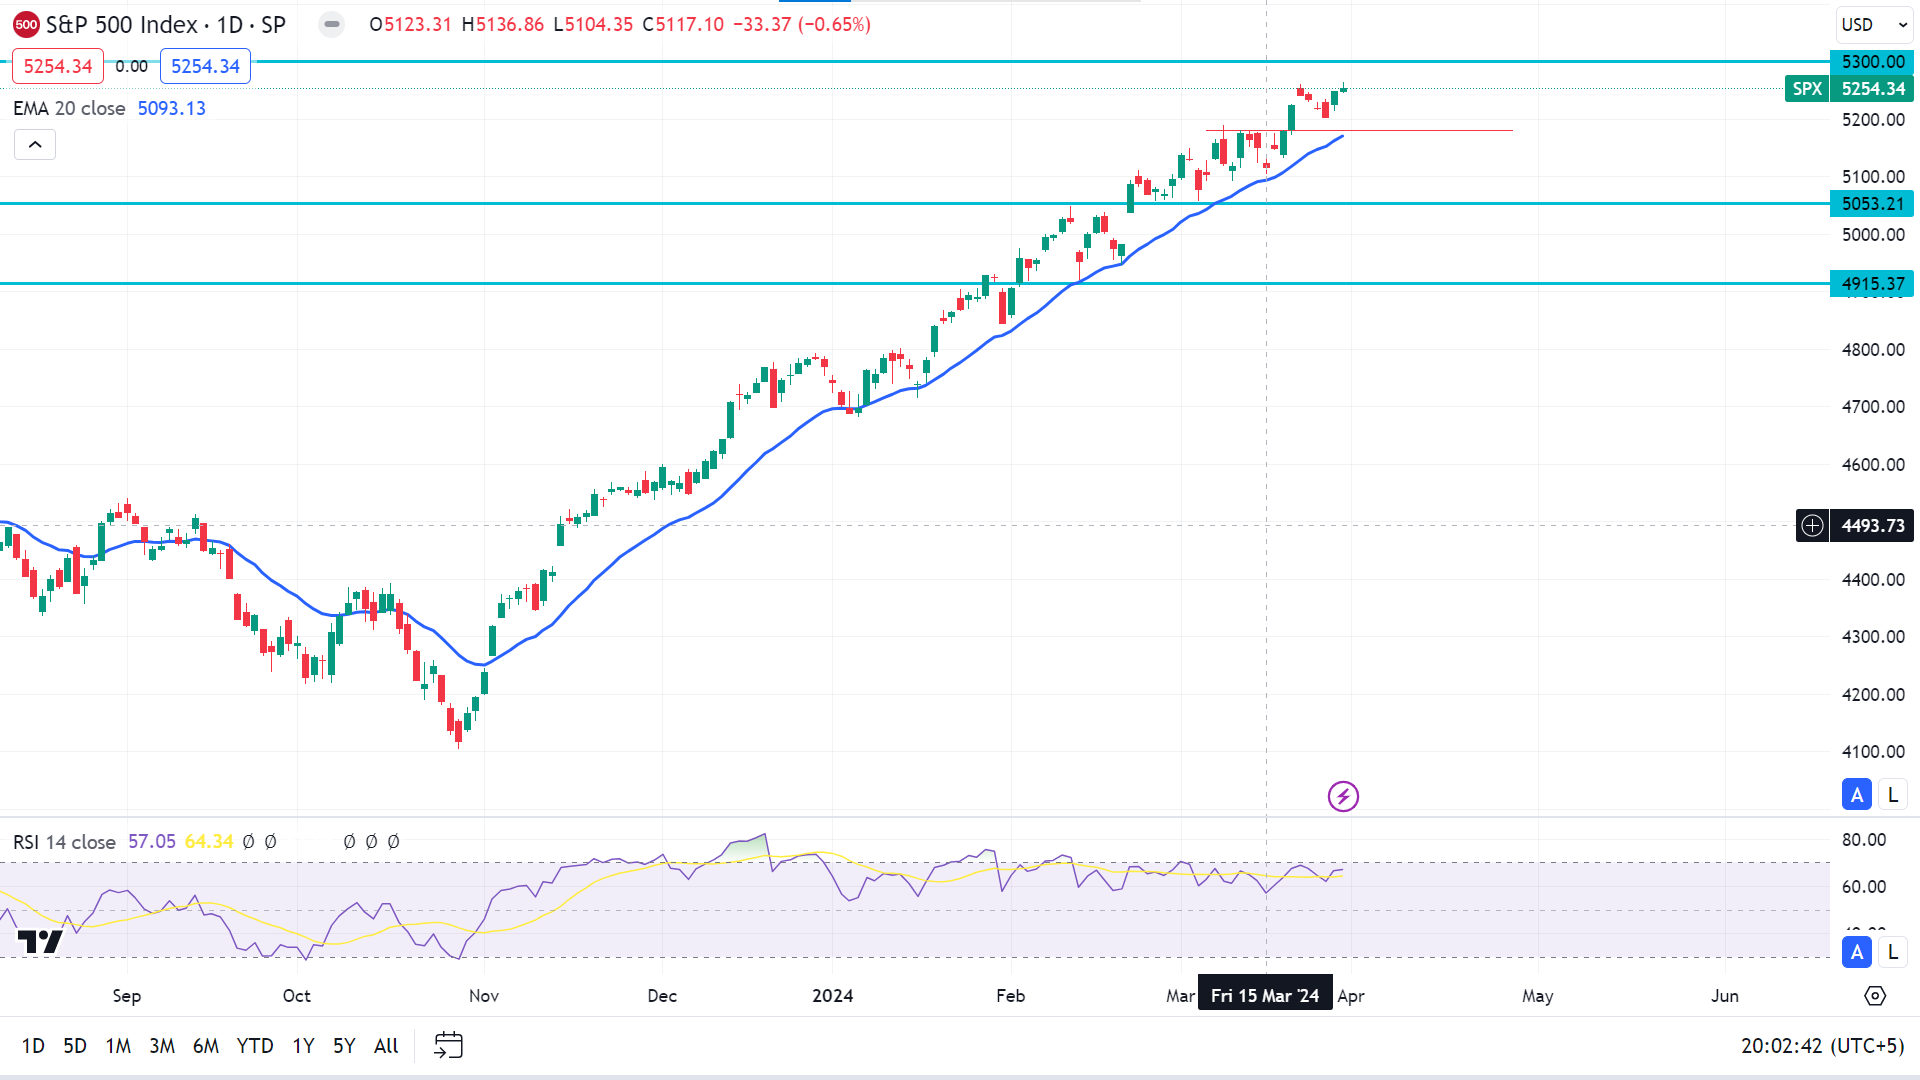
As per the RSI window, the daily chart shows the buyers' domination, and it may reach the next resistance level of nearly 5300.00 in the upcoming days.
On the other hand, the price can be retraced back to the current support level, which is near 5180.00, as the EMA 20 line suggests. However, a valid bearish possibility is not visible, which might initiate from an exhaustion at the top.
Bitcoin (BTCUSD)
Fundamental Perspective
Axel Adler Jr. CryptoQuant author, introduced a straightforward strategy for Bitcoin trade in a publication on X. The method is based on two on-chain matrices, net unrealized profit (NUP) and net unrealized loss (NUL), which track the total unrealized profit and loss held by investors.
The NUP and NUL metrics analyze the transaction history of each Bitcoin in circulation to determine its current cost basis. If the NULL identifies coins with a cost basis above the current asset value, unrealized losses are indicated. Conversely, the last transaction price for a coin was lower than the current spot price, which signifies a profit calculated by the NUP.
Historically, the NUL has reached above the 0.5 level on a downward price movement, opening buying opportunities, according to Axel's indicator. Conversely, the NUP has surpassed the 0.7 level during significant peaks, enabling selling opportunities. Recent data shows that NUP is increasing gradually but has not yet reached a significant 0.7 level, indicating that the market may not be overheated.
While neither matrics precisely determine the tops or bottoms, historical analysis confirms profitability by buying at the NUL-identified points and selling at the NUP-identified points. It can be identified as a promising simplified approach. However, its effectiveness in the current Bitcoin circle remains uncertain.
Technical Perspective
The weekly candle is a bull candle after a hammer indicates significant bullish pressure on the asset price.
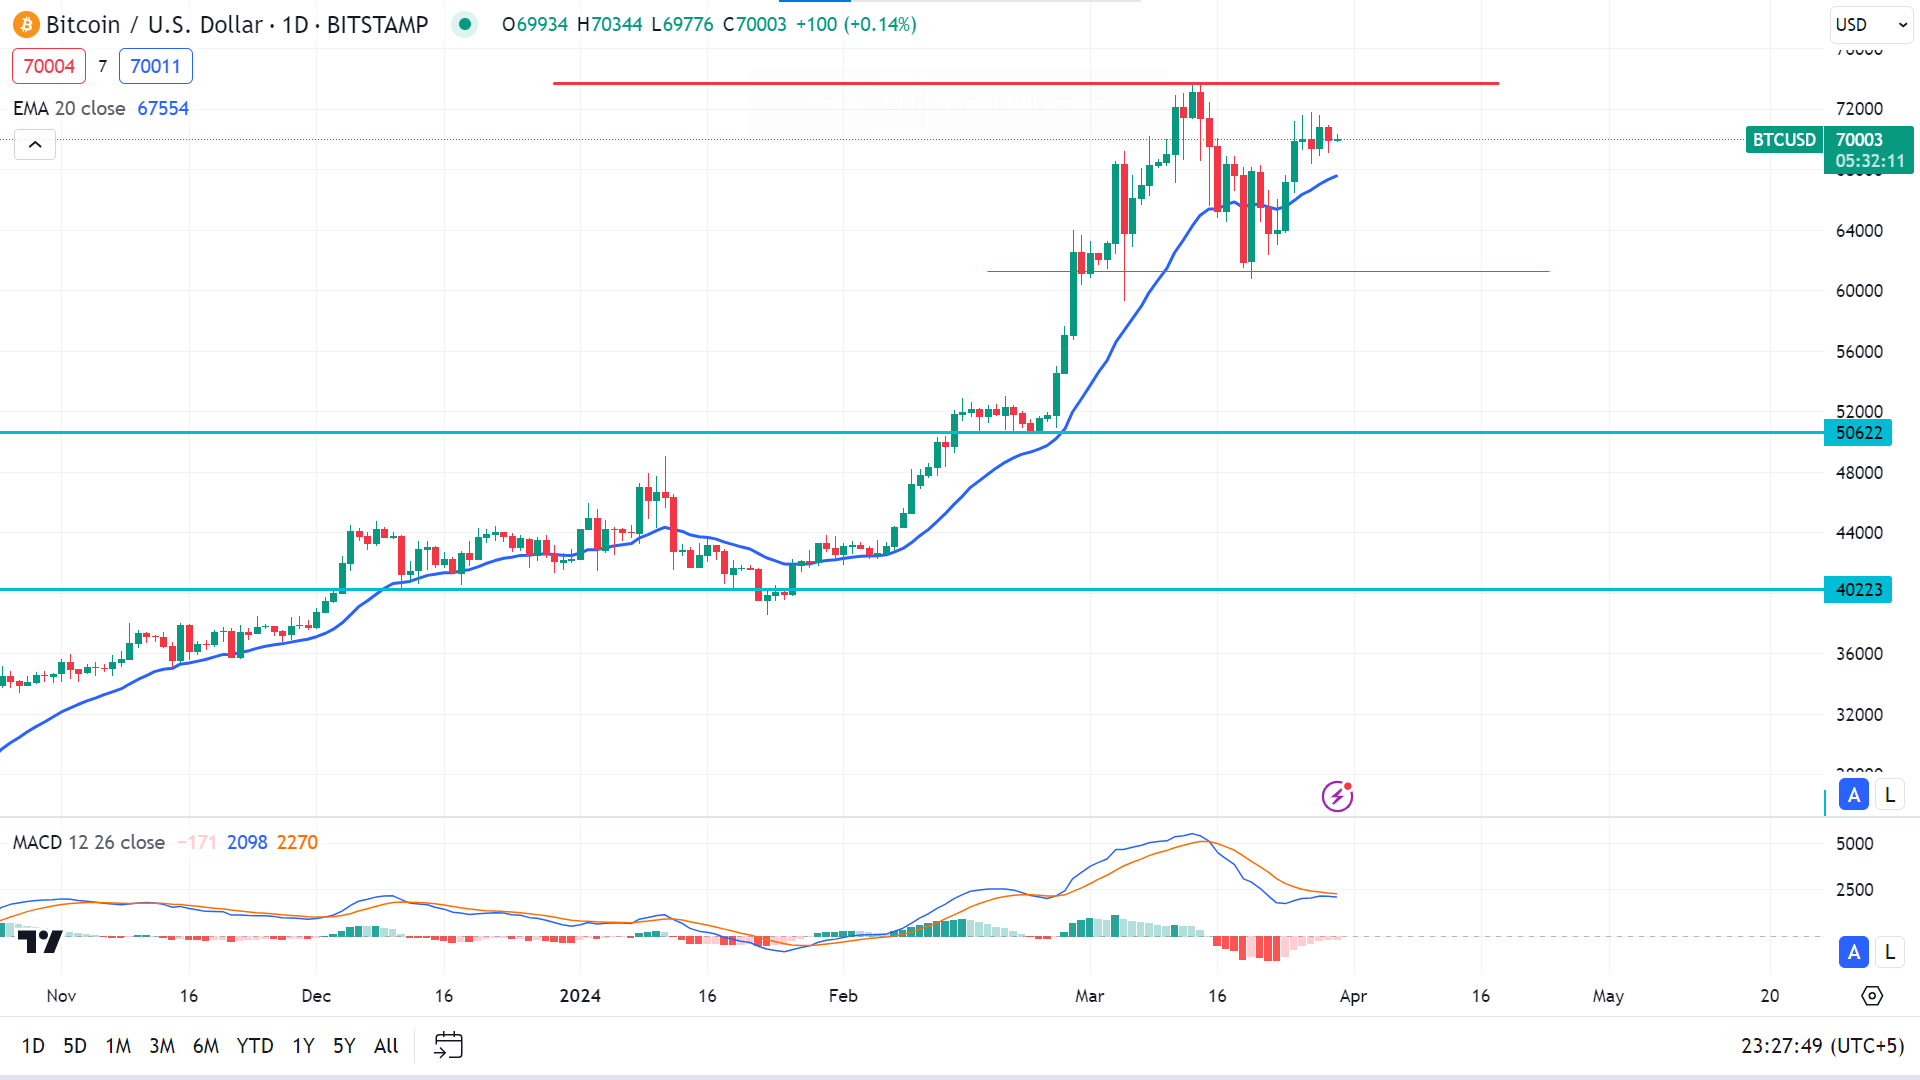
The daily chart shows the price remains just below the ATH, signaling the price can reach the recent peak near 73,700.00 or above with significant buy pressure, as suggested by the MACD indicator window.
On the other hand, the primary support level is near 67500.00 according to the EMA 20 line, and a break below can trigger the price to reach the next support near 61250.00, as it is the neckline for a possible H&S pattern.
Ethereum (ETHUSD)
Fundamental Perspective
Consensys, a leading blockchain software technology firm, has petitioned the U.S. Securities and Exchange Commission (SEC) to acknowledge Ethereum's inherent security strengths. This proposal comes from the SEC's scrutiny of Ethereum ETF approval applications.
In response to the SEC's queries about Ethereum's Proof of Stake (PoS), Consensys swiftly dispelled fraud and manipulation concerns, asserting the system's integrity. In a detailed correspondence, the company delineated how Ethereum's PoS model outperforms Bitcoin's Proof of Work (PoW) regarding security standards.
Consensys underscored Ethereum's PoS's robust features, such as rapid block finality and a decentralized validation process, which mitigate undue influence. Additionally, it highlighted Ethereum's cost-effective measures, like slashing penalties, and its eco-friendly attributes.
Furthermore, Consensys emphasized Ethereum's decentralized community and transparency, augmenting its security. The firm asserted that these inherent safeguards exceed those of Bitcoin-based ETPs already sanctioned by the SEC.
With a steadfast commitment to advancing web3 technology adoption, Consensys advocates for Ethereum ETF approval as a strategic step towards broader user engagement. Consensys aims to propel progress and disseminate critical insights within the community through this proactive engagement.
Technical Perspective
The weekly candle looks like a hammer with a longer upper wick and a small green body, suggesting the price still holds bullish pressure.
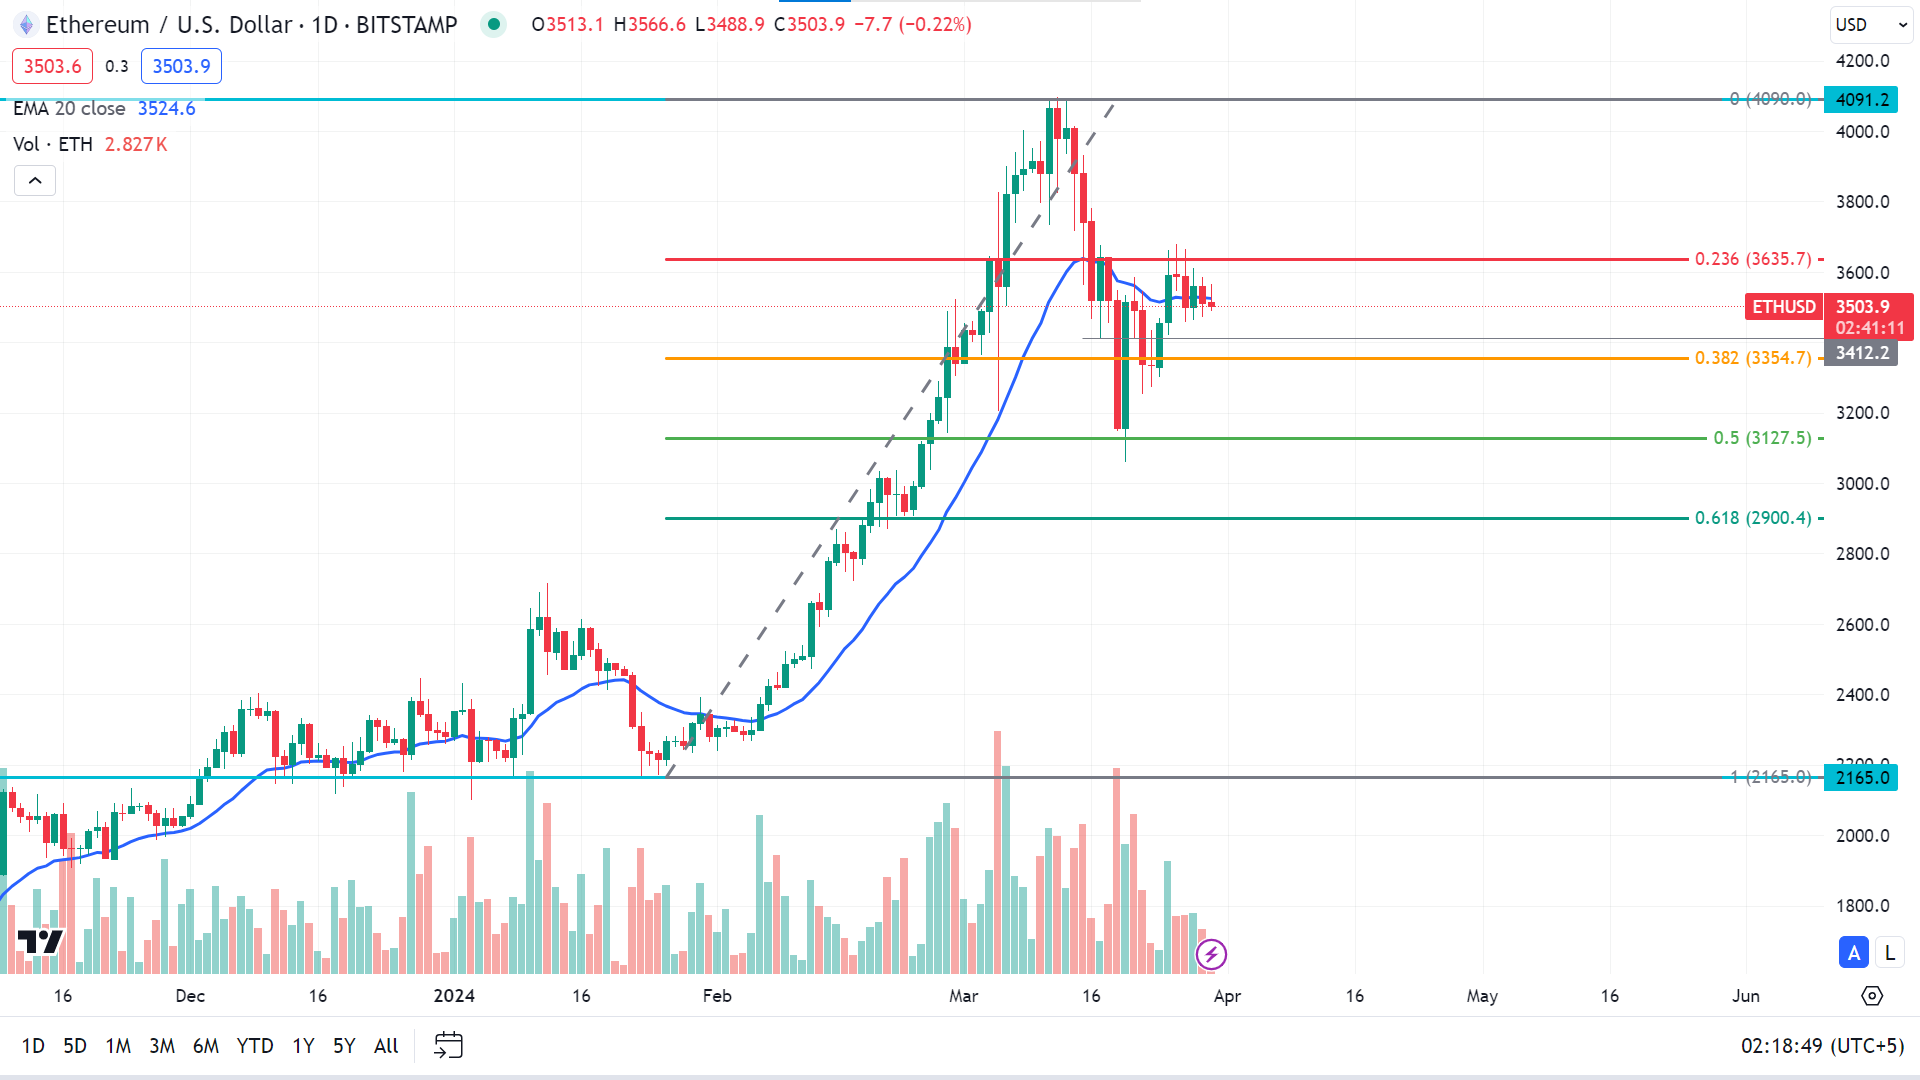
The daily chart shows the price remains in a consolidating phase between 0.23%-0.38% Fibo retracement level, in a range between 2165.00-4090.00. A breakout above the current resistance level of 3635.70 can enable the price to regain near the peak of 4090.00.
On the other hand, sellers will seek the primary support level near the 3354.70 level, opening the door to reaching the next support level of 3127.50, a 50% Fibo retracement level.
Nvidia Stock (NVDA)
Fundamental Perspective
On Thursday, Nvidia (NVDA) recovered from early losses and finished closing above the 900 mark. Despite any remarkable decline in the stock price of the leading artificial intelligence chip maker, it remained above the crucial 50-day moving average, as indicated by analysis tools on IBD MarketSurge.
The sustained elevation is underscored by the positive market sentiment from the recent Nvidia GTC conference tailored for AI developers. Nvidia stock price posted a consecutive winning streak for 11 weeks, a streak that commenced with a notable breakout in January, signaled by a buy point of 505.48, as the weekly chart on IBD MarketSurge reveals.
During the AI developer conference, Jensen Huang, the Chief Executive, introduced the Blackwell chip, the latest innovation from the AI leader. The noble AI chip will boost computing and is slated for future release through various Nvidia partners.
Timothy Arcuri, UBS analyst, reflected his optimism by revising the target price of Nvidia from 800 to 1,100 following the conference while upholding a bye rating.
Technical Perspective
The weekly candle finished with an inverted hammer, indicating the bulls losing power.
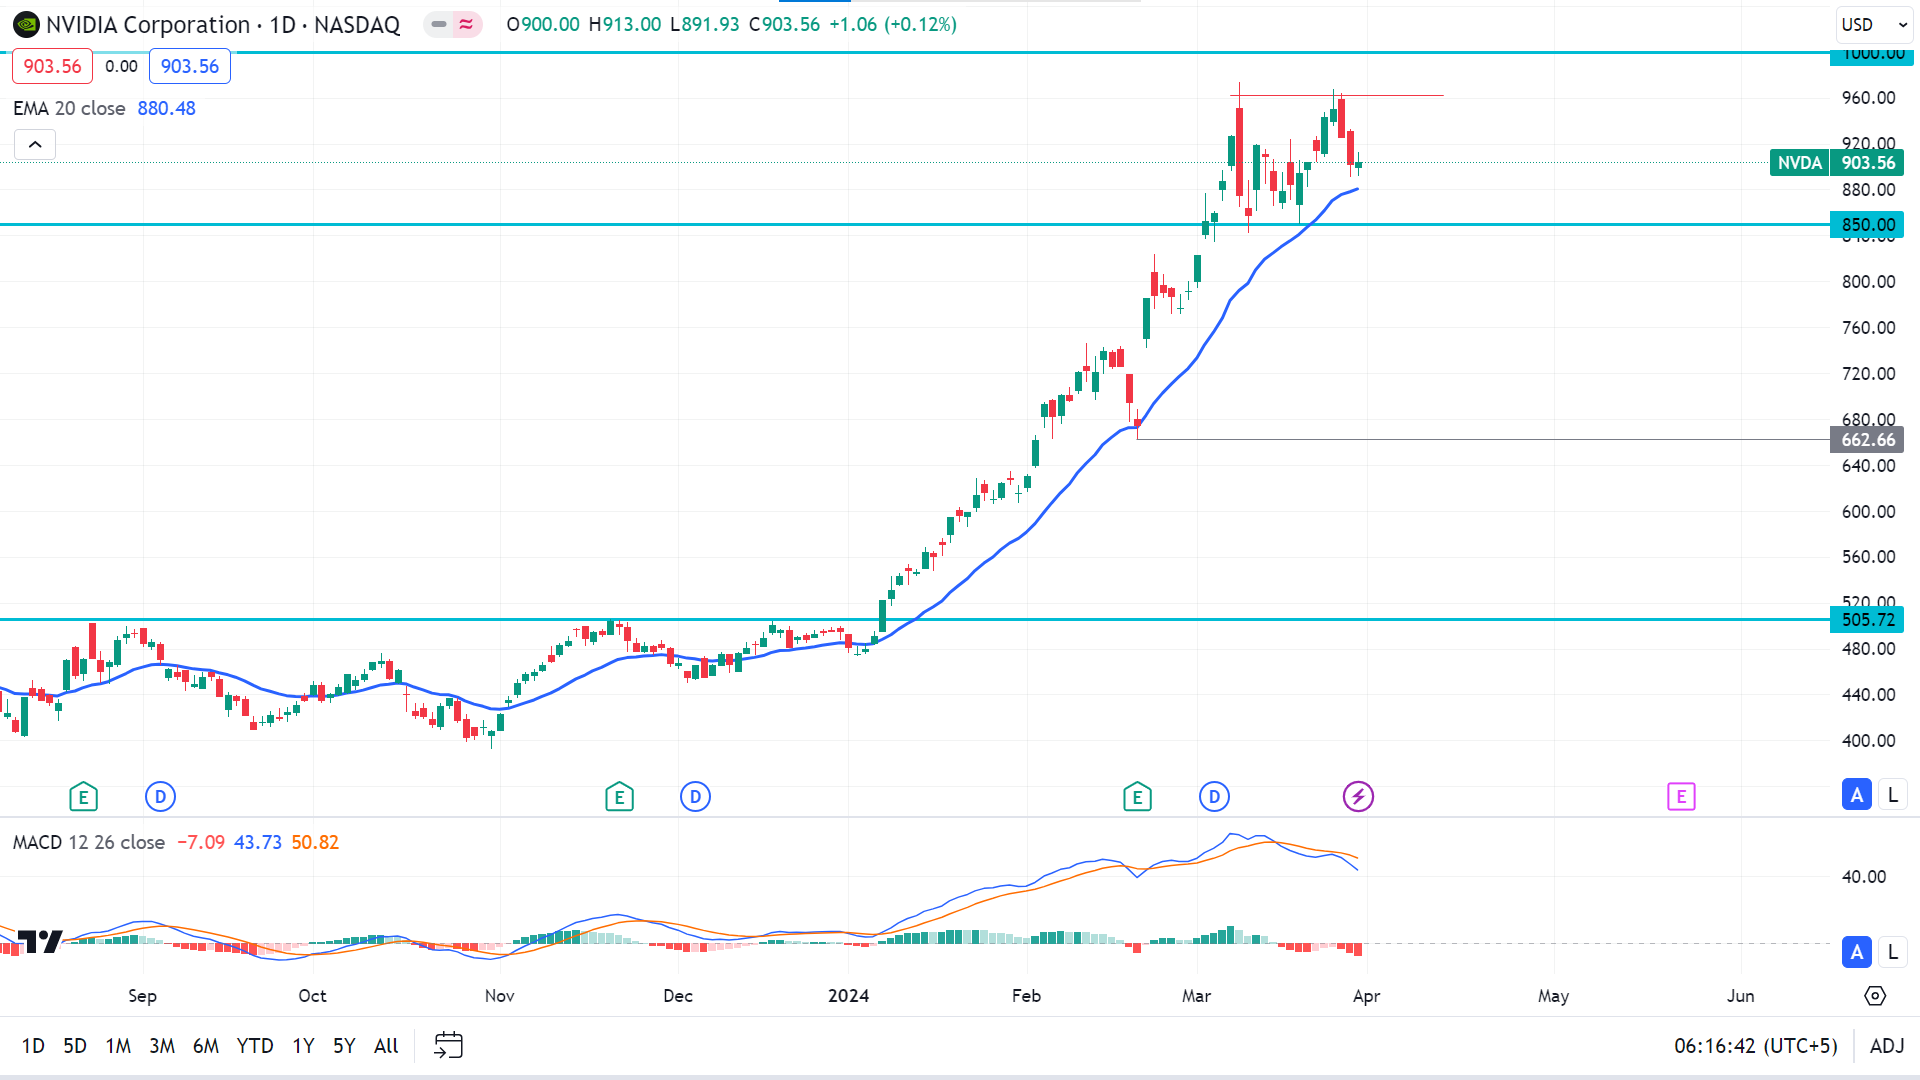
After two consecutive losing days, the daily chart finished forming a doji candle, indicating the price can continue to move upward to the next resistance level near 1000.00 after breaking the recent peak of 962.50, as it remains above the EMA 20 line posting intact buy pressure. On the other hand, it can create a valid double-top pattern and reach the primary support near 850.00, as the MACD window shows sellers are trying to take control of the price.
Tesla Stock (TSLA)
Fundamental Perspective
GLJ Research upheld its sell rating on (NASDAQ: TSLA) shares, adjusting the price target to $23.53, deducting delivery estimation for Q1 due to weaker demand in key markets such as Europe, China, and the United States.
The research firm underscored the remarkable valuation of Tesla, which surpassed the combined market capitalization of Toyota (NYSE: TM) and BYD (SZ: 002594), despite Tesla delivering only 16% of vehicles sold by these companies over the past year.
GLJ Research's analysts highlighted Tesla's year-over-year sales decline in Q1 2024, an unseen trend since Q2 2020, during the COVID-19 pandemic. This projected downturn solidifies the firm's bearish stance on Tesla's stock.
Tesla's current valuation stands at 57.4 times its estimated earnings per share for 2024, significantly surpassing automotive peers General Motors (NYSE: GM) and Ford (NYSE: F), trading at 4.9 and 7.1 times respective earning estimates for 2024.
Revised delivery estimates for Q1 2024 now range between 406,500 and 417,500 vehicles, lower than previous projections and below the consensus estimate of 462,200 vehicles. GLJ Research anticipates potential negative revisions from Wall Street analysts regarding Tesla's deliveries and earnings in response to the lowered forecast.
Technical Perspective
The weekly candle closed above the opening price, delivering a bullish candle with upper wicks, reflecting buyers' interest in the TSLA stock.
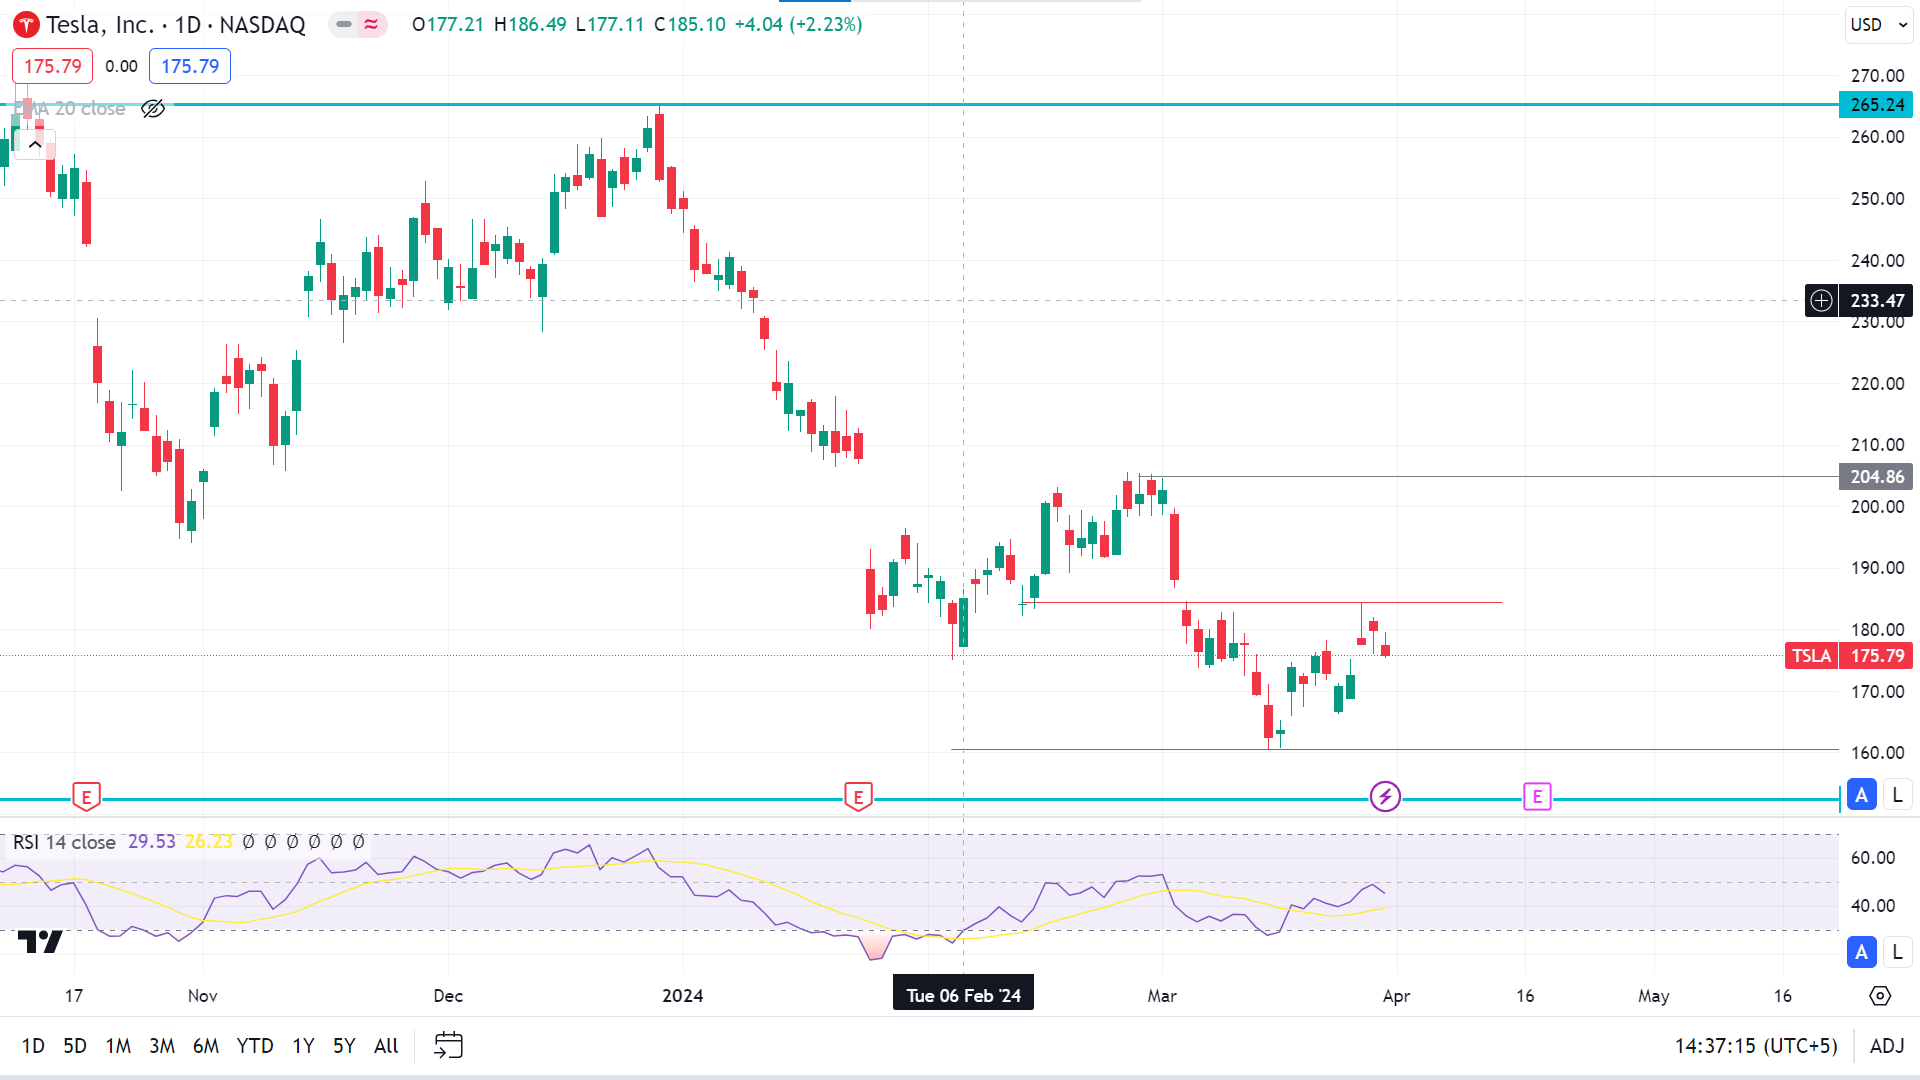
The daily chart shows the price faces significant sell pressure under the recent resistance level near 180.50, as the RSI window suggests. So, the price can reach the recent support near 160.50, or a breakout below can trigger the price to reach the next support near 152.38 if the selling pressure remains intact.
On the other hand, a breakout above the recent resistance of 180.50 can trigger the price to reach the next resistance of 204.86.
Gold (XAUUSD)
Fundamental Perspective
Gold defied the prevailing strength of the United States Dollar, surpassing the $2,200 mark this week. Yet, investors' attention switches to key economic data releases from the United States next week; technical indicators suggest a potential correction downside before resuming upward movement.
The US Dollar Index retreated early in the week, providing a window for XAU/USD to close positively on Monday after a robust recovery in the preceding week. Despite this, hawkish remarks from Federal Reserve (Fed) officials tempered bullish sentiment. Atlanta Fed President Raphael Bostic's expectation of a single rate cut this year, alongside Fed Governor Lisa Cook's caution against premature policy easing, restrained further gains.
On Tuesday, during European trading hours, Gold jumped to $2,200 but retreated later amid positive US economic data, particularly Durable Goods Orders that rebounded 1.4% in February following a sharp decline in January.
Gold regained momentum without significant catalysts, supported by technical buying interest above the $2,200 level. Christopher Waller, Fed Governor, delivered hawkish comments that supported the USD but could not impact the XAUUSD rally.
The Bureau of Economic Analysis (BEA) announced higher GDP growth in Q4 on Thursday, alongside stable inflation in February, underscoring the mixed economic backdrop that influenced the yellow metal's rally.
Overall, the XAUUSD is facing short-term volatility due to the recent market circumstances; remaining above the $2,200 mark declares strengths, while market participants closely monitor the upcoming US economic events to predict further direction.
Technical Perspective
The weekly chart finished with a solid green body, declaring significant bullish pressure.
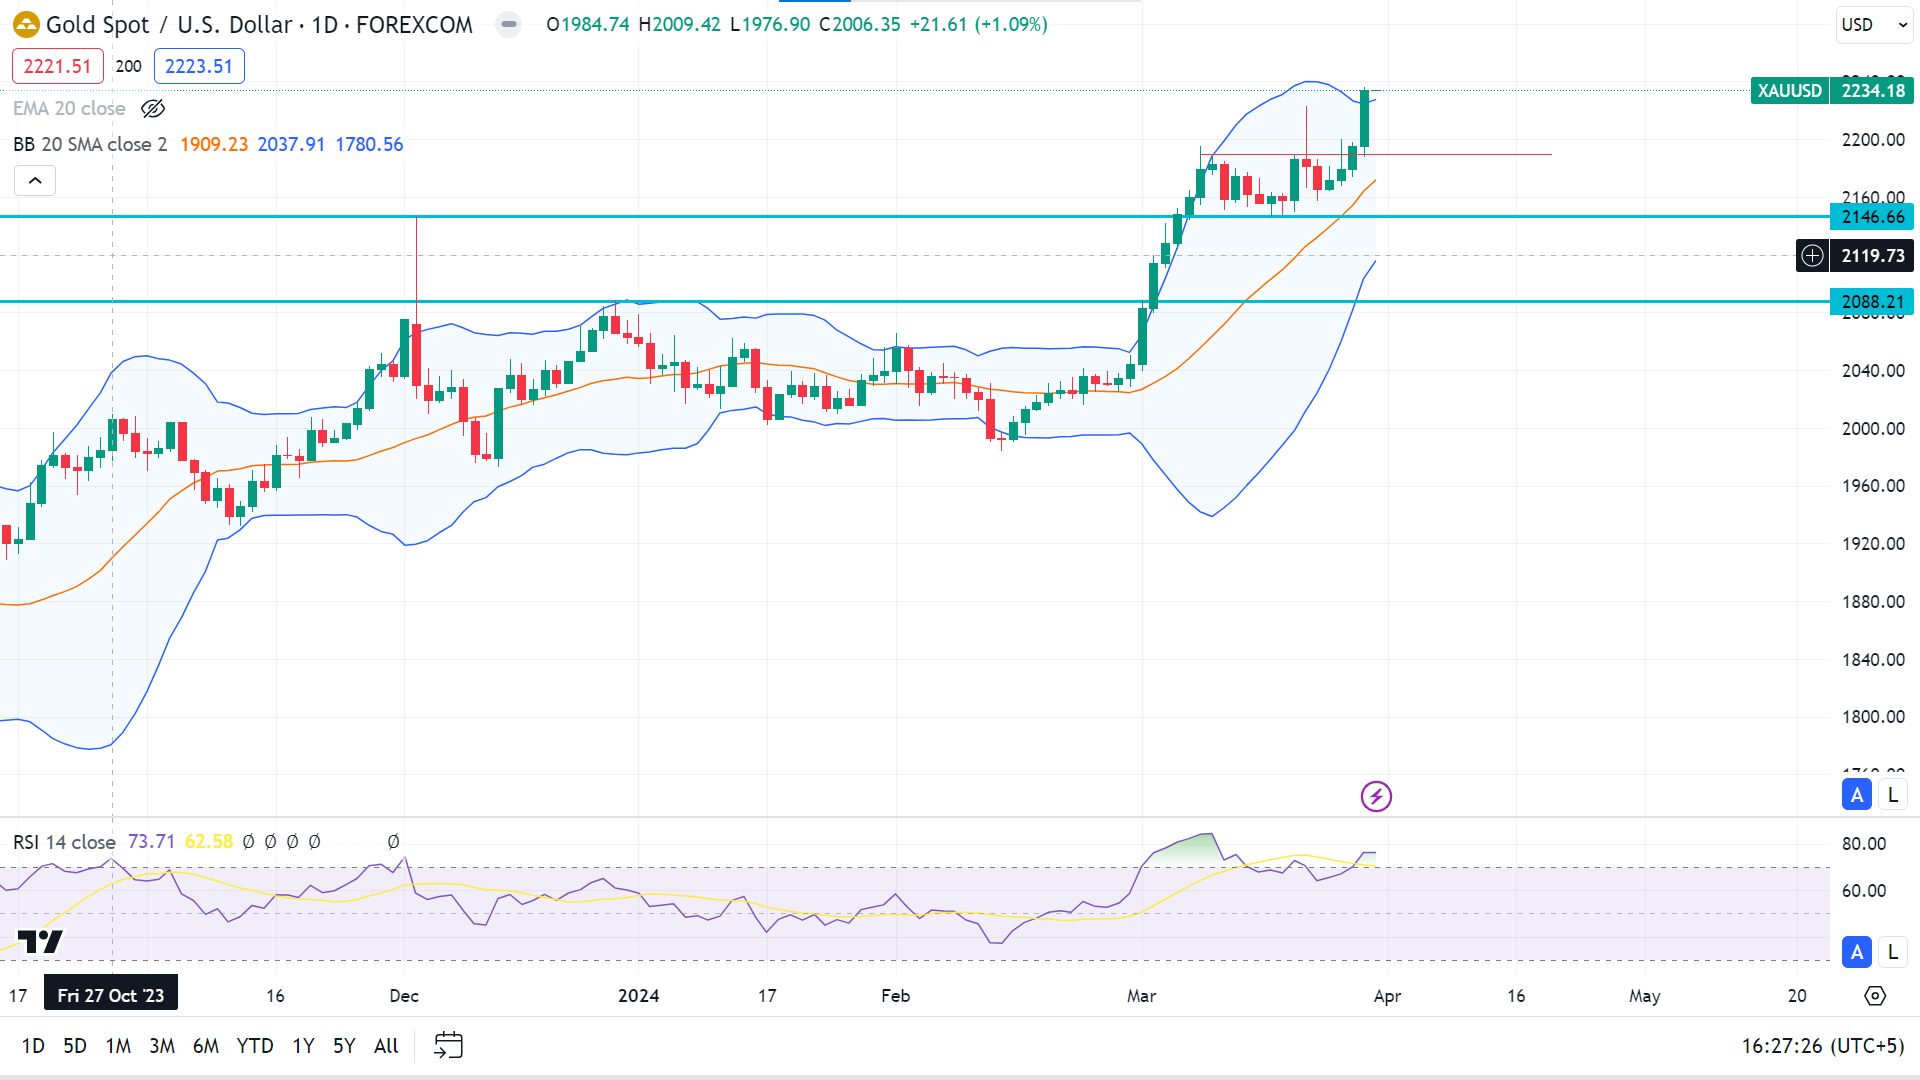
On the daily chart, the price touches the upper band of the Bollinger Bands indicator, indicating significant bullish pressure on the asset price. The price can continue to rise and create new peaks in the upcoming days.
On the other hand, the technical indicators suggest the price can retreat to the current support toward $2,190 as a correction before continuing upward.
WTI Crude Oil (USOUSD)
Fundamental Perspective
A crucial development surfaced with the unexpected surge in the United States crude and gasoline inventories, primarily attributed to the surge and the decline in gasoline demand. However, the smaller-than-projected surge in crude stocks suggests a tighter global oil supply. Enhanced US refinery utilization may offset bearish sentiments stemming from inventory data.
Moreover, a decrease in oil and gas rig counts hints at potential future output reductions, contributing to a constrained supply scenario. Additionally, the revised 3.4% GDP growth rate for the United States underscores a stronger economy, which can drive a surge in energy consumption and indirectly influence oil demand through rate decisions by the FED.
The role of OPEC+ in bolstering oil prices through production cuts remains pivotal, with market focus on forthcoming meetings for potential policy indications. Furthermore, the Russia-Ukraine conflict, particularly targeting Russian energy infrastructure, raises concerns regarding supply disruptions. Attacks on major Russian refineries have curtailed Russia's oil processing capabilities, further tightening the global oil supply.
The short-term outlook for Light Crude Oil Futures appears bullish when considering these factors. Factors such as declining U.S. inventories, robust U.S. economic growth, ongoing OPEC+ production restraint, and geopolitical tensions impacting Russian refining capacities all suggest a potential supply crunch. Coupled with anticipated demand upticks, this points towards escalating oil prices shortly.
Technical Perspective
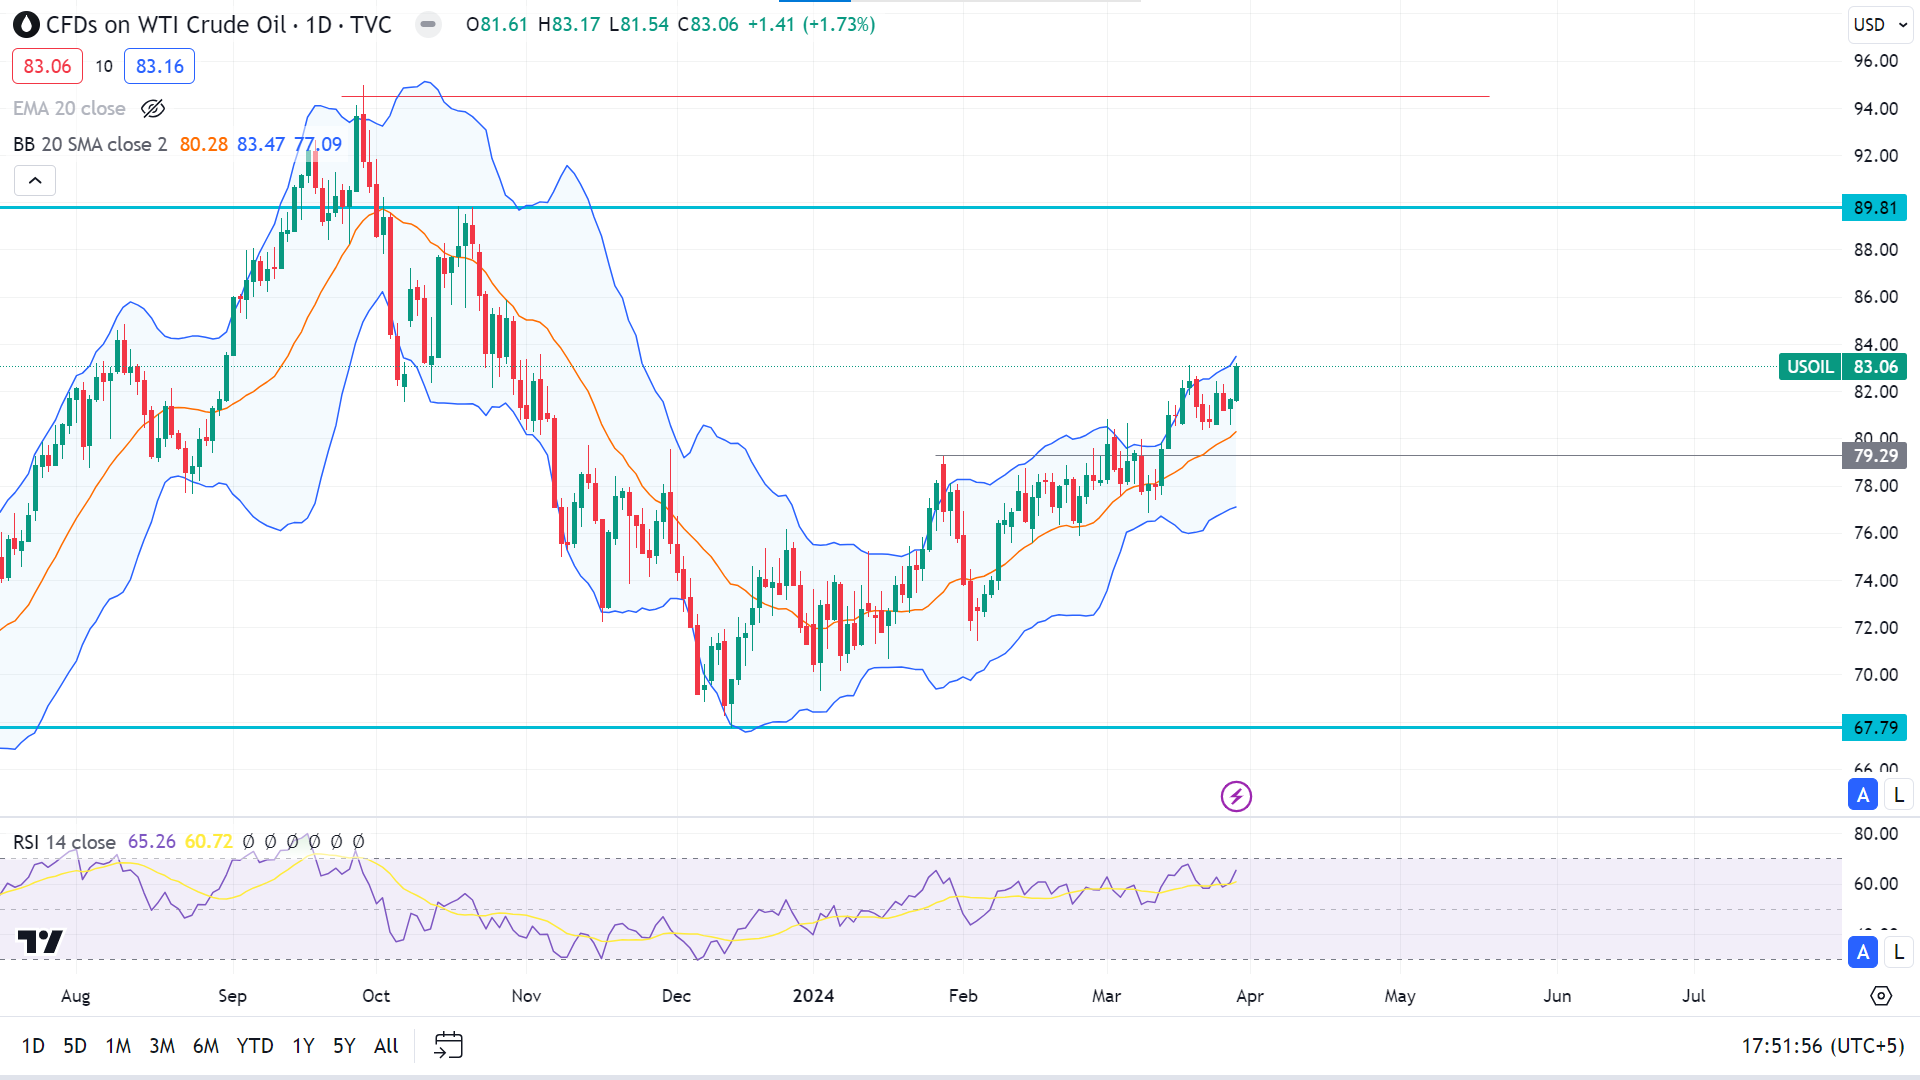
The solid bullish weekly candle declares positive pressure on the oil price.
The price may seek to reach the resistance near $89.81 shortly, according to the Bollinger Bands and RSI indicator data. On the other hand, a correction on the downside lies near $80.00, as the middle band of the BB indicator suggests.


