


EURUSD
Fundamental Perspective
Last week began with a strong US Dollar against the Euro, but it soon faltered, allowing EUR/USD to bounce back from the month-long low of 1.0724. This shift was driven by diminishing expectations of a rate cut by the Federal Reserve, following comments from Fed Chairman Jerome Powell indicating a patient approach due to economic resilience and stable inflation.
The Euro gained strength from positive PMI data in Germany and the Eurozone, signaling a notable improvement in the services sector. However, the US Dollar regained momentum later in the week, buoyed by robust employment data.
These data underscored solid economic growth while supporting the case for steady interest rates. FED policymakers have consequently noted that the weakening labor market would be a rate-cut precondition alongside inflation easing.
While some US economic indicators showed mixed results, such as the ISM Manufacturing PMI and Services PMI, data from the Eurozone suggested easing inflation, potentially setting the stage for interest-rate cuts in Europe.
Looking ahead, the market focus shifts to upcoming events, including the US March Consumer Price Index (CPI) and Producer Price Index (PPI) and the European Central Bank (ECB) monetary policy decision. Speculation surrounds whether the ECB will act before the Fed and whether it will hint at a potential rate hike in June.
Technical Perspective
The weekly candle closed green with lower wicks after three consequently bearish candles, indicating buyers may take control of the price and it can recover toward the resistance level.
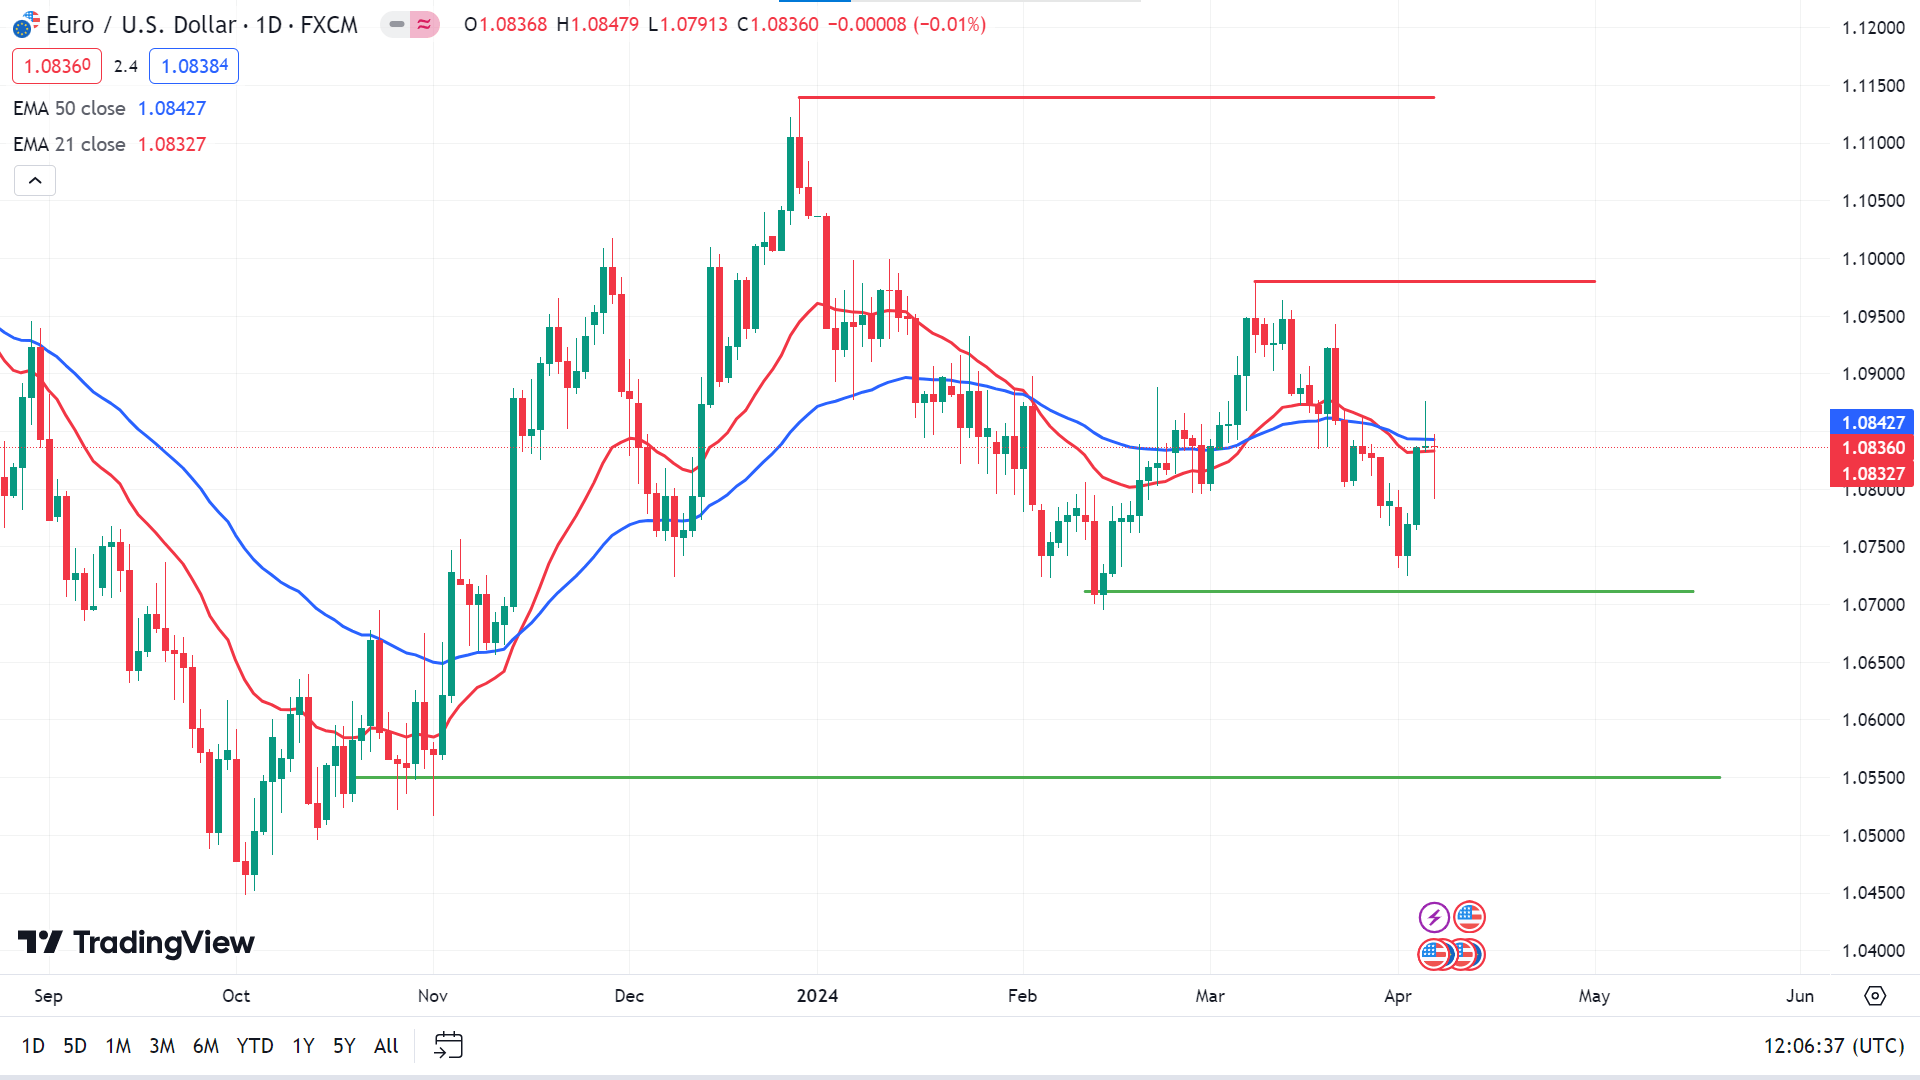
The RSI reading confirms the price remains near the middle line, declaring a neutral condition. The EMA 5, EMA 10, EMA 20, and EMA 200 lines signaling the price can move up and reach the current resistance level near 1.0980, following the next resistance near 1.1140.
Meanwhile, the EMA 50 and EMA 100 lines hint that sell pressure continues on the asset price, signaling the price may reach the primary support level near 1.0711. The following support is near 1.0550.
GBPJPY
Fundamental Perspective
GBPJPY experienced a marginal downturn, hovering just above the 191.000 threshold. The pressure on the exchange rate intensified due to subdued inflation forecasts in the UK, sparking speculation of a potential interest rate reduction by the Bank of England (BoE) in June. Such presumption weakened the Pound Sterling, a common outcome when lower interest rates are anticipated, as they typically deter foreign capital inflows.
Meanwhile, Japan's central bank, the Bank of Japan (BoJ), recently enacted a departure from its prolonged negative interest rates, implementing a modest increase at its March meeting. This development triggered speculation among investors, pondering whether it marked the initiation of a cycle of rate hikes that could bolster Yen's position over the long term. BoJ Governor Ueda's remarks in a recent interview with the Asahi Shimbun hinted at the likelihood of further rate increases, citing an acceleration in inflation propelled by positive outcomes in the Shunto spring wage negotiations.
Technical Perspective
The trading session ended with GBPJPY hovering near the mid-highs of the week but remaining below the key 192.00 level. Despite maintaining a position above the Ichimoku Cloud (Kumo), the pair exhibited a lower high and low, indicating a subtle inclination towards the downside.
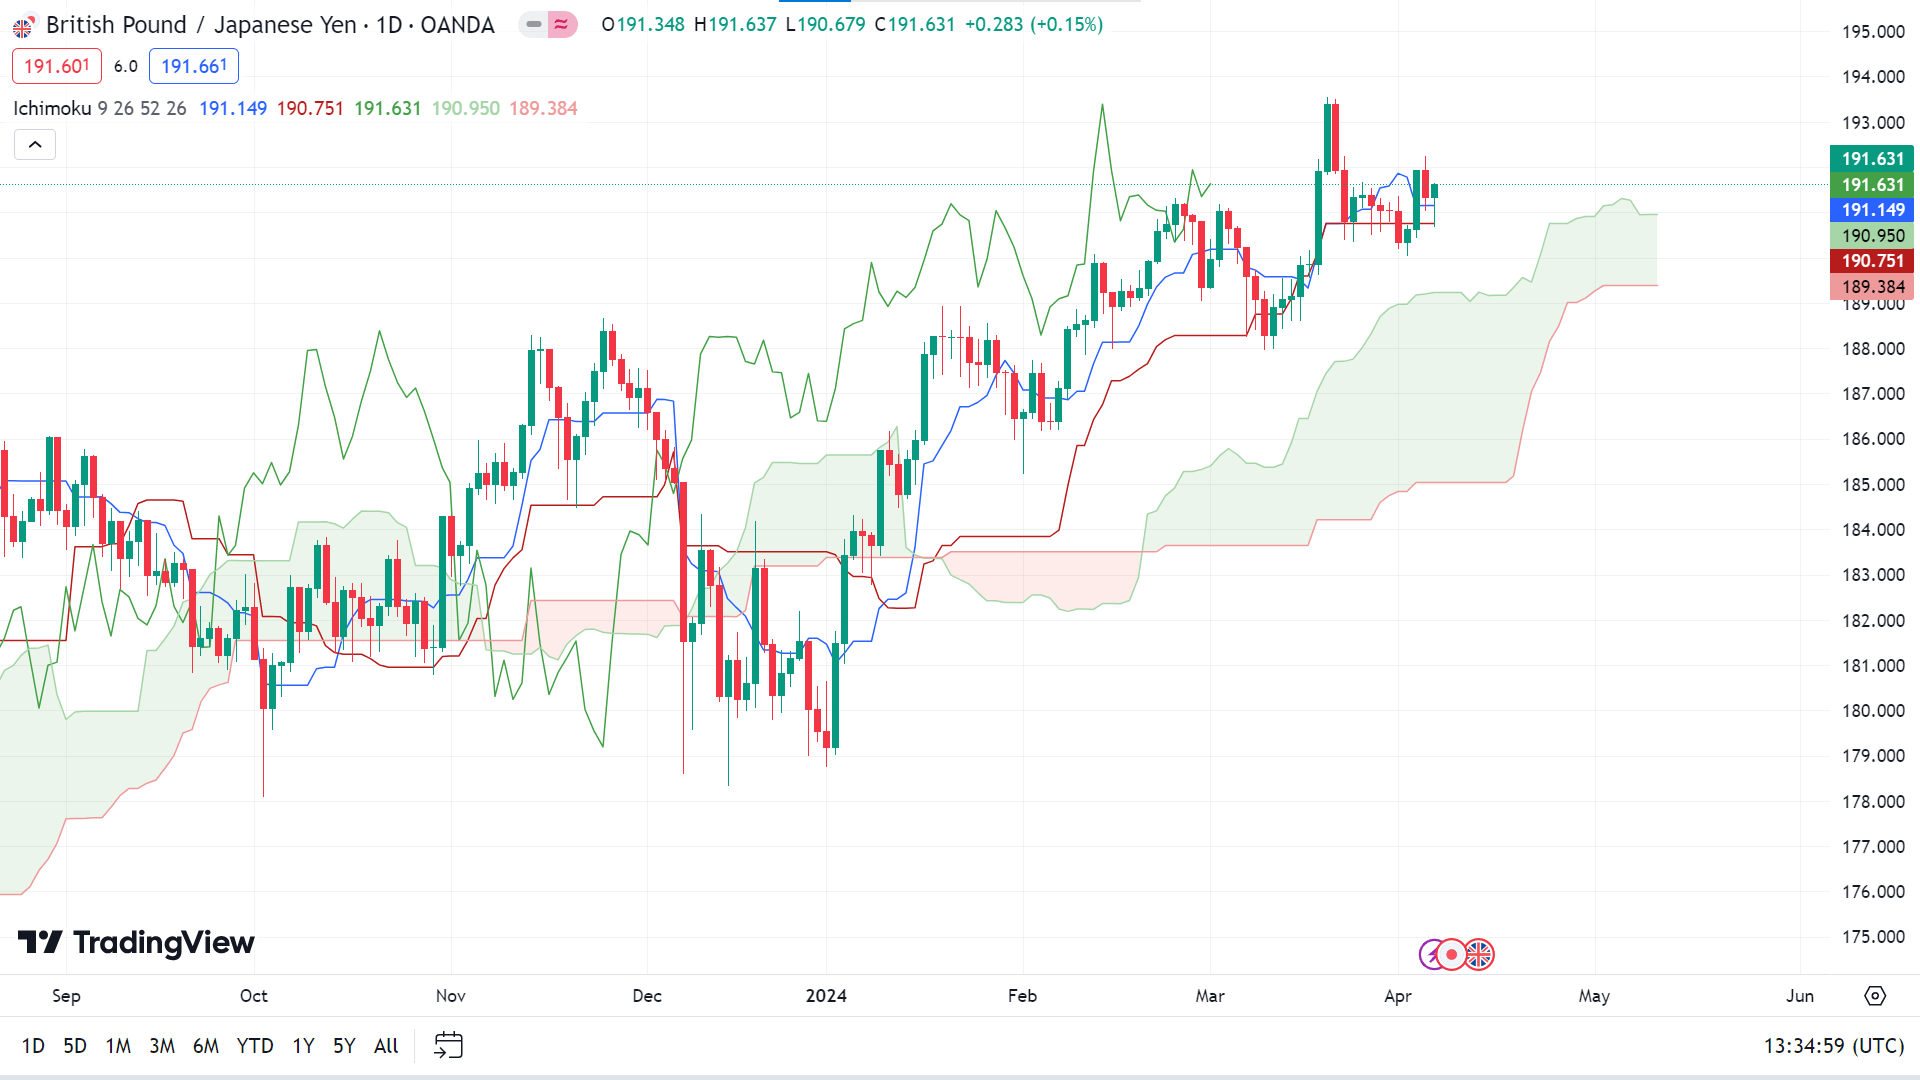
In this context, the initial support for GBP/JPY is found at the Senkou Span A level of 190.96. A breach of this level would pave the way for further declines. The next support rests at the Kijun-Sen at 190.74, followed by the April 2 low of 190.03. Additional downside potential is observed at the Senkou Span B support at 189.38.
Conversely, the primary resistance level lies at the psychological barrier of 192.00. If surpassed, this could open the path towards the 193.00 mark, with further upside potential seen at the year-to-date (YTD) high of 193.54.
Nasdaq 100 Index (NAS100)
Fundamental Perspective
From a fundamental perspective, US stock indexes showed promise for a higher open on Friday, propelled by robust March jobs data indicating resilience in the labor market. The Labor Department's report revealed an impressive increase of 303,000 jobs, surpassing economists' expectations of 200,000.
On a monthly basis, average earnings increased by 0.3%, as expected, but the unemployment rate held steady at 3.8%, as opposed to an anticipated 3.9%.
David Waddell, CEO and chief investment strategist at Waddell & Associates, highlighted the significance of the average hourly earnings figure, which declined to 4.1% year over year, the lowest since June 2021. This aspect of the employment report suggested a cooling inflationary trend, reassuring the market despite the substantial job numbers.
Following the data release, money markets adjusted their expectations, now pricing in a 56% chance of at least a 25 basis point rate cut by the Federal Reserve in June, down slightly from 60%. This shift came after Fed officials' hawkish remarks triggered a selloff in the previous session. Three major indexes dropped more than 1% after Fed officials' hawkish comments.
For the coming days, investors should wait until Friday before having significant earnings reports from- J P Morgan Chase & Co, Wells Fargo & Company, BlackRock, Inc and Citigroup Inc.
Technical Perspective
The weekly candle of NAS 100 finished with a red body with wicks on both sides, after a doji candle, declaring bulls may lose power.
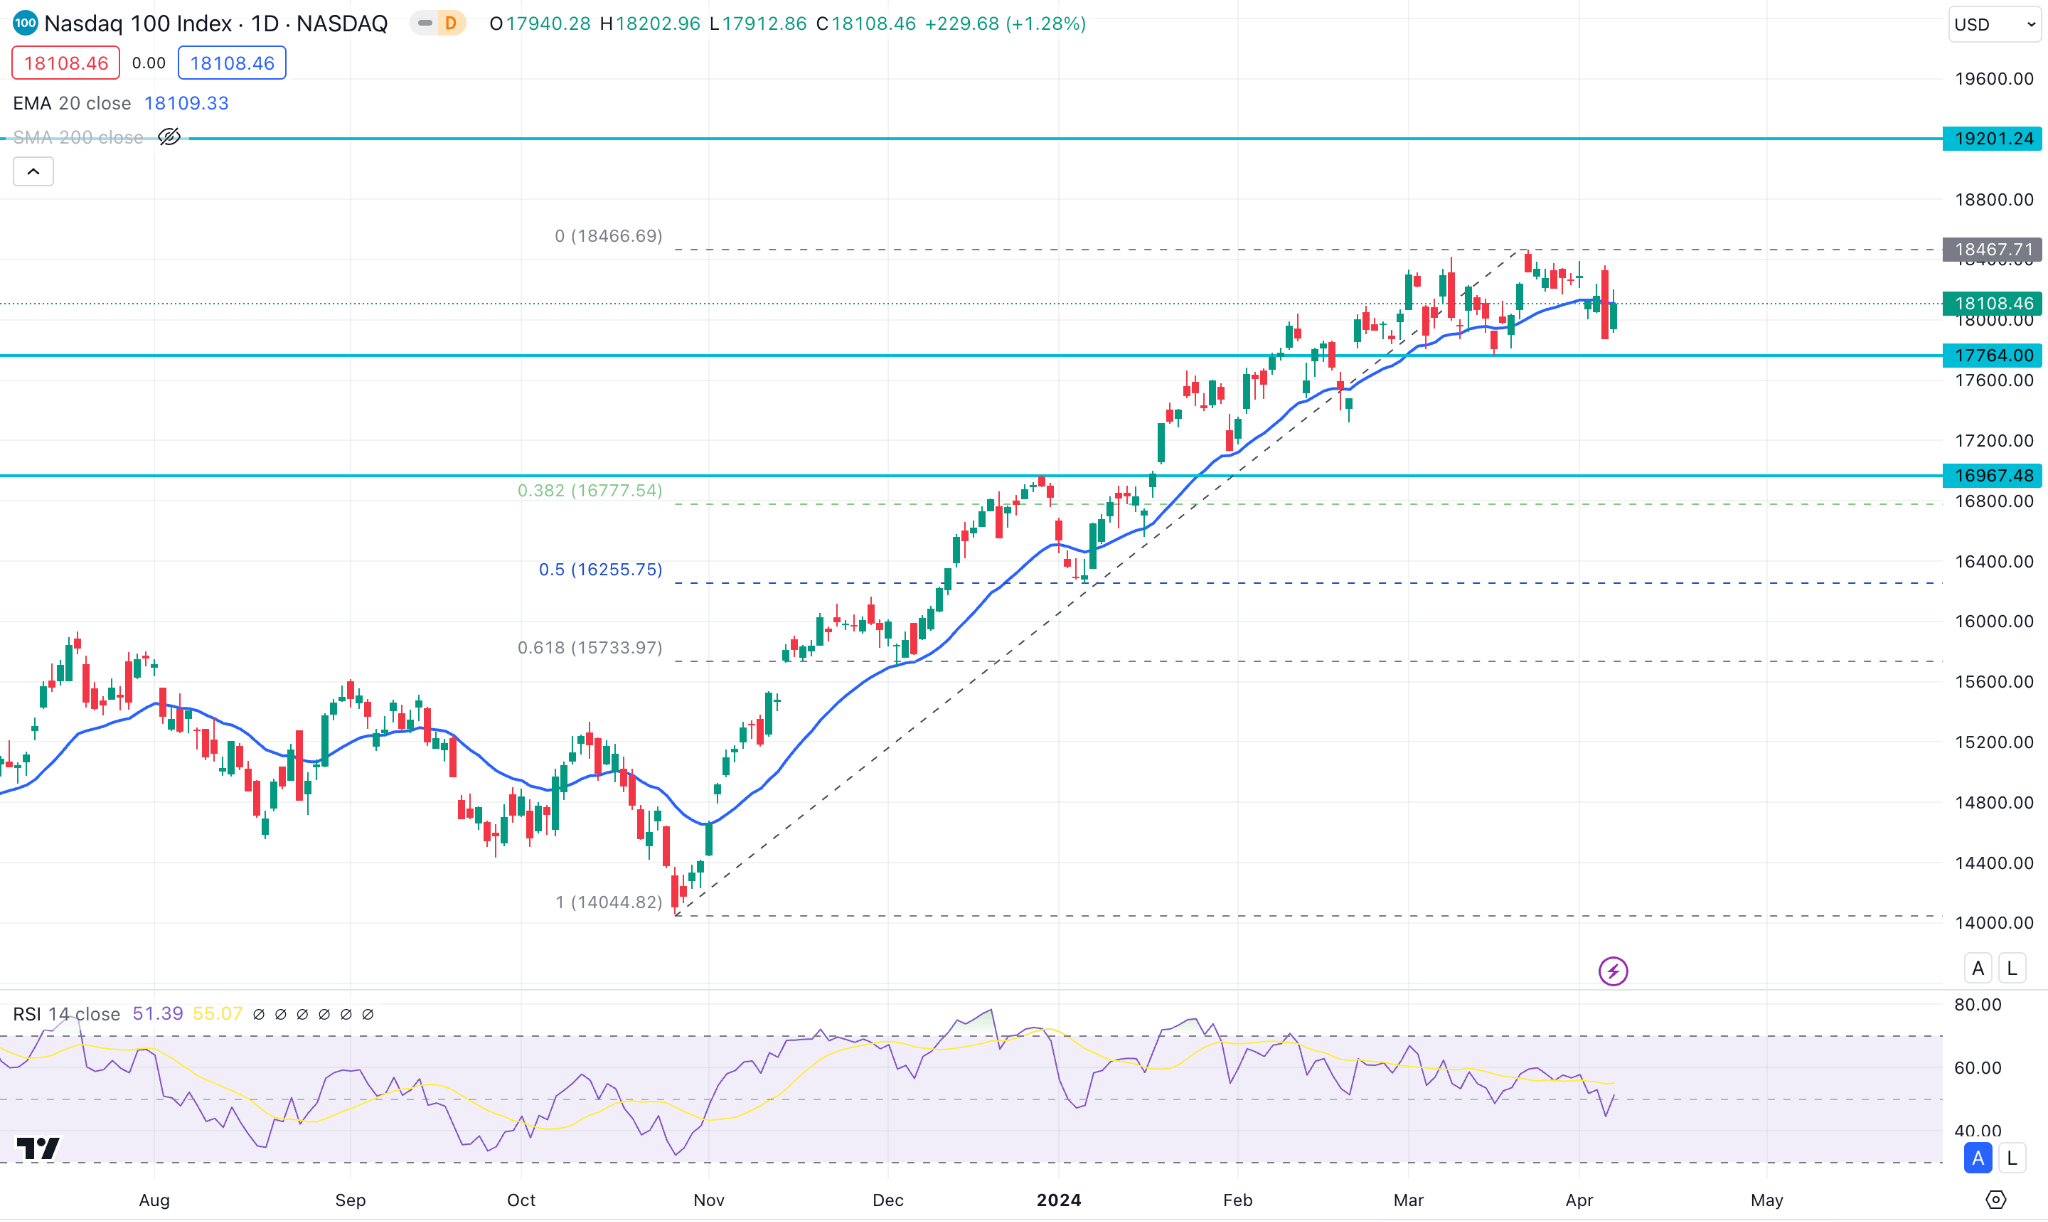
The price closed just below the EMA 21 line, a solid bull candle within a red candle, declaring the price may continue to the bullish trend as it remains for several months and break to the recent peak of 18494.00 and climb above.
On the other hand, the price can retrace back to the recent support level near 17445.22 as the price gets below the EMA 21 line, and the RSI indicator suggests a neutral condition.
S&P500 (SPX500)
Fundamental Perspective
The latest jobs report revealed a remarkable surge in job additions, marking the highest increase in ten months for the US economy. Moreover, the unexpected decline in the jobless rate from its two-year highs, coupled with the steady uptick in wages by employers, highlighted the tightness of the labor market. Given the conflicting signals from Federal Reserve officials, these indicators hint at the potential for a gentle landing for the US economy, potentially delaying the widely anticipated interest rate cuts.
Despite Friday's rebound, the Dow Jones recorded a 1.9% loss for the week, while the S&P 500 and Nasdaq retreated by 1% and 1.3%, respectively.
Technical Perspective
The weekly candle closed as a hammer with a red body and lower wicks, signaling bulls may not lose hope.
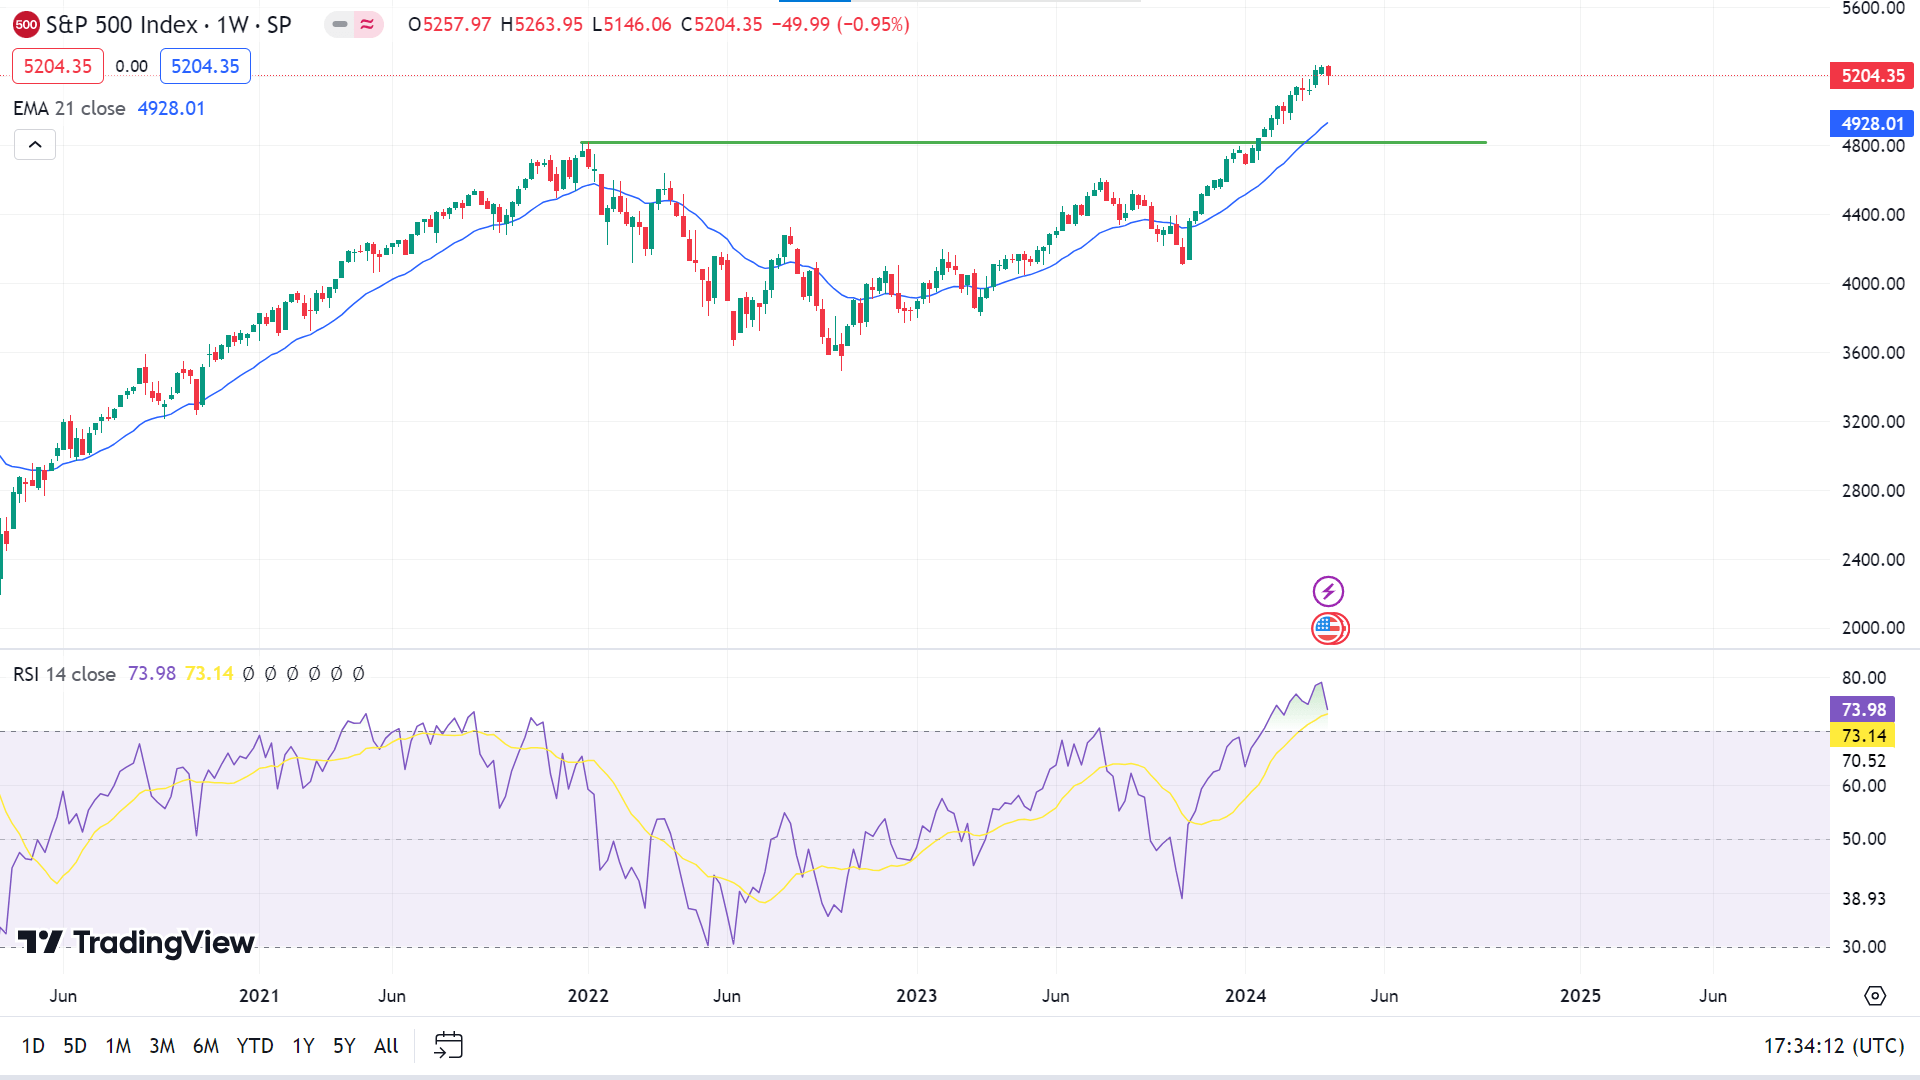
The price has remained above the EMA 21 line since November 2023, declaring solid bullish pressure on the asset price. So, the price can remain on the trend and break above the peak of 5263.95 in the coming days.
On the other hand, the RSI line indicates the price remained overbought, so the price can decline if buyers lose interest and reach the recent support near 4928.01 (EMA 21) or the next one near 4820.00 before climbing more.
Bitcoin (BTCUSD)
Fundamental Perspective
The monthly returns data for Bitcoin highlights a notable trend: the second quarter historically delivers robust average returns, boasting an impressive 30% compared to the first quarter's 11.41%. Moreover, the second quarter has exhibited remarkably few negative returns over the past decade, suggesting a relatively smooth ride for BTC investors based on historical trends.
April, in particular, stands out as the month with the second-highest average return over the past decade, adding an element of anticipation to the current month's performance.
However, recent insights from Glassnode sound like a cautionary note: there is a growing divergence in Bitcoin holdings between short-term and long-term investors. While short-term holders rapidly accumulate BTC, long-term holders gradually reduce their positions.
This shift raises concerns, as a surge in short-term holdings often hints at bearish sentiment, given the impulsive nature of such investors. Consequently, any perceived threat to their holdings may trigger swift sell-offs, potentially precipitating a significant correction in Bitcoin's price.
Technical Perspective
The weekly candle closed as a red hammer with a long wick on the downside, which hints that the bullish trend is still in play.
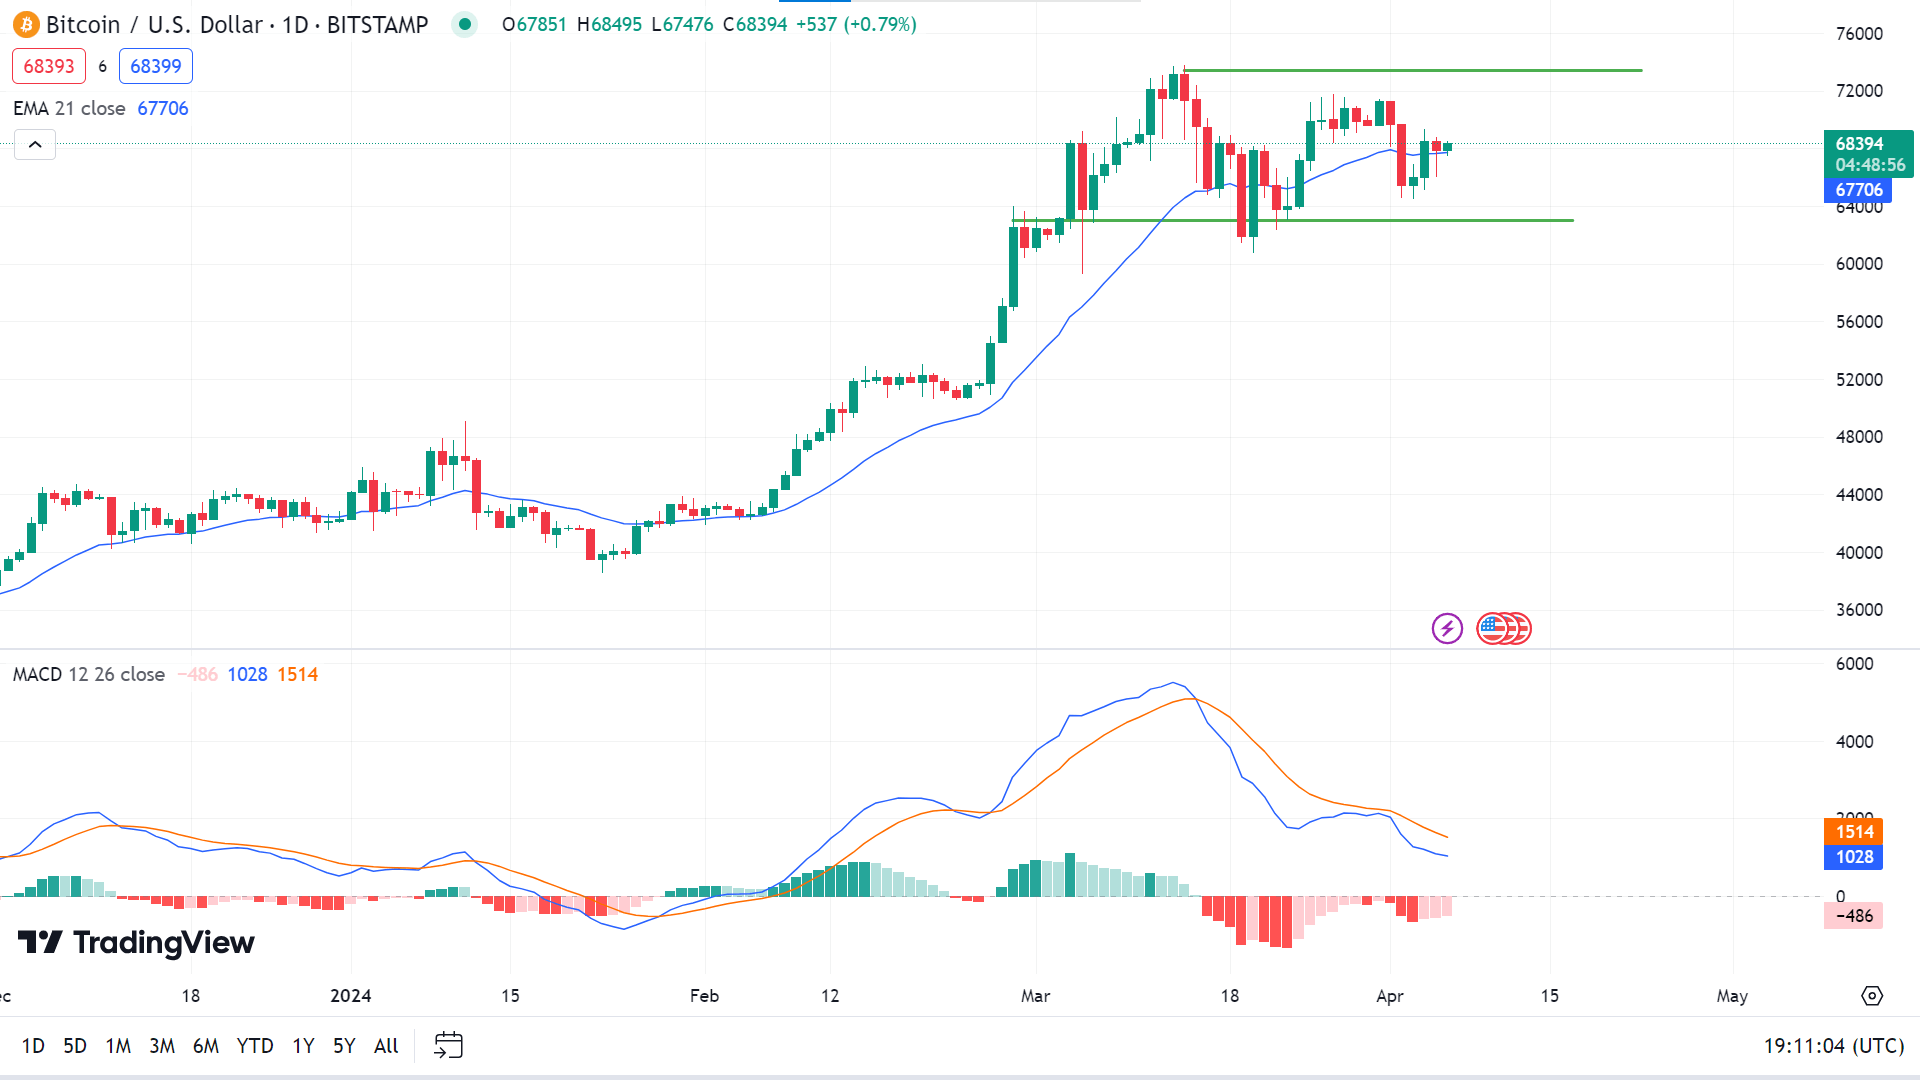
The price has entered sideways after reaching the ATH near $73,450. Remaining above the EMA 21 line, indicating the price may continue the uptrend and regain the peak or above as the hype continues.
On the other hand, the MACD indicator suggests that bullish pressure may fade, and the price can reach the current support of nearly $63000 or more downside.
Ethereum (ETHUSD)
Fundamental Perspective
Over recent weeks, Ethereum (ETH) has lingered within the $3,500 price range, exhibiting little movement. However, a recent correction has precipitated a notable downturn in ETH's value, prompting a shift in market sentiment.
However, despite this correction, substantial outflows of approximately 1,000,000 ETH, equivalent to $3.41 billion, have been observed from exchanges since March. This consistent trend persists despite macroeconomic challenges and concerns regarding the SEC's potential rejection of a spot ETH ETF.
Such outflows suggest active participation in actual activities on the Ethereum network, including transaction payments, staking, and restaking. It indicates confidence in holding ETH amidst unfavorable market conditions rather than mere speculative trading. Nonetheless, liquidity for spot ETH remains highly prized.
Currently, ETH is trading at $3,254.80, with a 2.68% decrease over the last 24 hours. The rapid decline in ETH's price has led to the liquidation of many traders' positions, totaling $57.22 million, according to Coinglass' data, with approximately $41 million worth of long positions being liquidated.
The velocity of ETH trading has also decreased recently, signaling a material decline in the rate of trading activity. ETH's network growth has also considerably slowed, indicating a waning interest from new addresses.
Technical Perspective
The weekly candle of ETHUSD closed with a red body and a small wick on the downside covering the previous green candle, indicating that sellers had taken control of the asset.
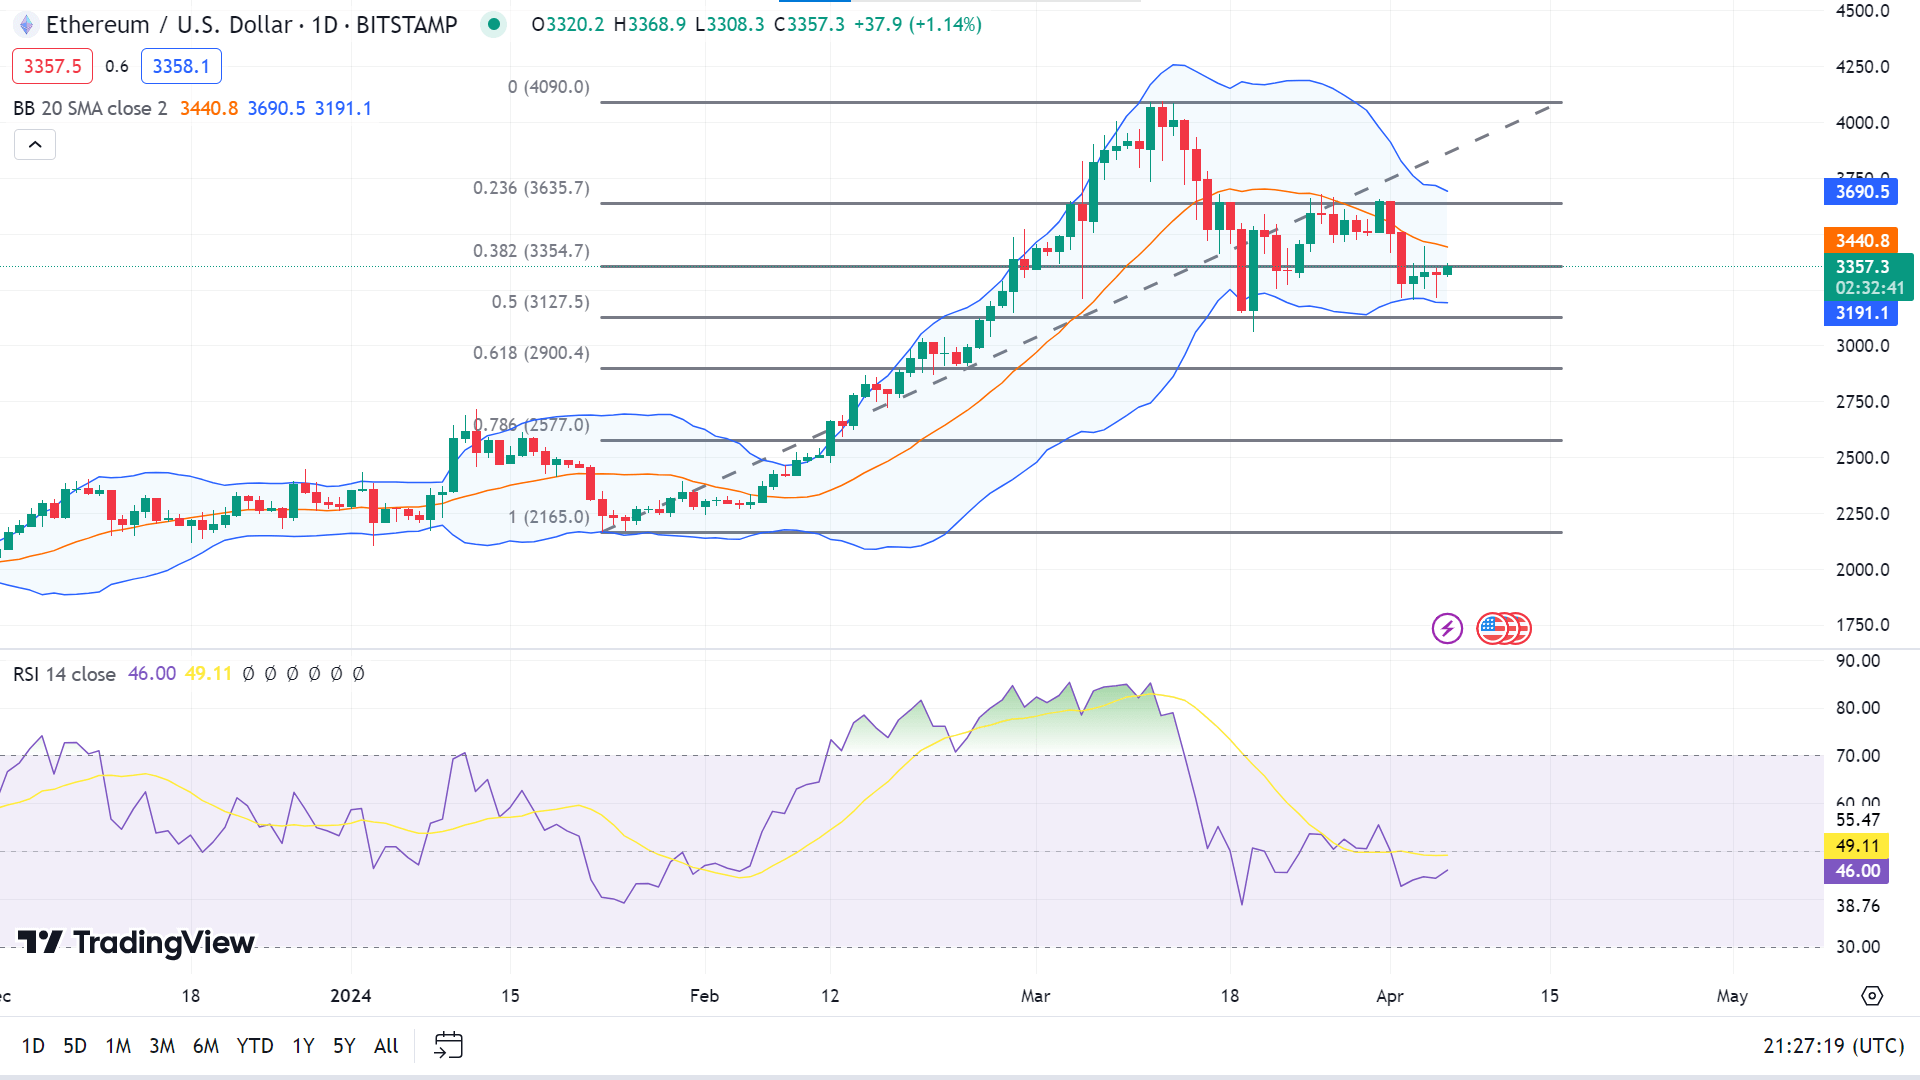
Ethereum price remains on the lower channel of the Bollinger bands, declaring bearish pressure, just below the 38% Fibo retracement level in the $4090.00-$2165.00 range. So, the price can reach the $3127.50 level, followed by the subsequent support of nearly $2900.40.
On the other hand, buyers can take control of the asset price as EMA 50, EMA 100, and EMA 200 lines suggest bulls are still active. So the price can reach the recent resistance in $3635.70 following the ATH near 4090.00.
Nvidia Stock (NVDA)
Fundamental Perspective
Several Wall Street analysts are cautious about Nvidia's future despite its stellar performance in the AI chip market. Despite the company's impressive performance under Jensen Huang's leadership, concerns loom over its future prospects.
Analyst Gil Luria from DA Davidson predicts a possible 20% decline in Nvidia's stock by year-end, citing skepticism about its high valuation. Nvidia's rapid growth may slow down as AI-focused companies reach their limit in GPU purchases.
While Nvidia's earnings per share are projected to nearly double by the first quarter of 2024, concerns persist about its sky-high valuation. Deutsche Bank maintains a "hold" rating, indicating a 5% downside from current levels. The firm emphasizes that Nvidia's impressive innovation pace and AI leadership may already be fully priced into the stock.
Economic slowdowns could further jeopardize Nvidia's stock performance if major customers reduce GPU spending. Despite a minority of analysts expressing bearish sentiments, most remain bullish on Nvidia's rally.
Technical Perspective
The weekly candle of NVDA stock closed red, as did the previous one, suggesting that sellers may have taken control of the asset price.
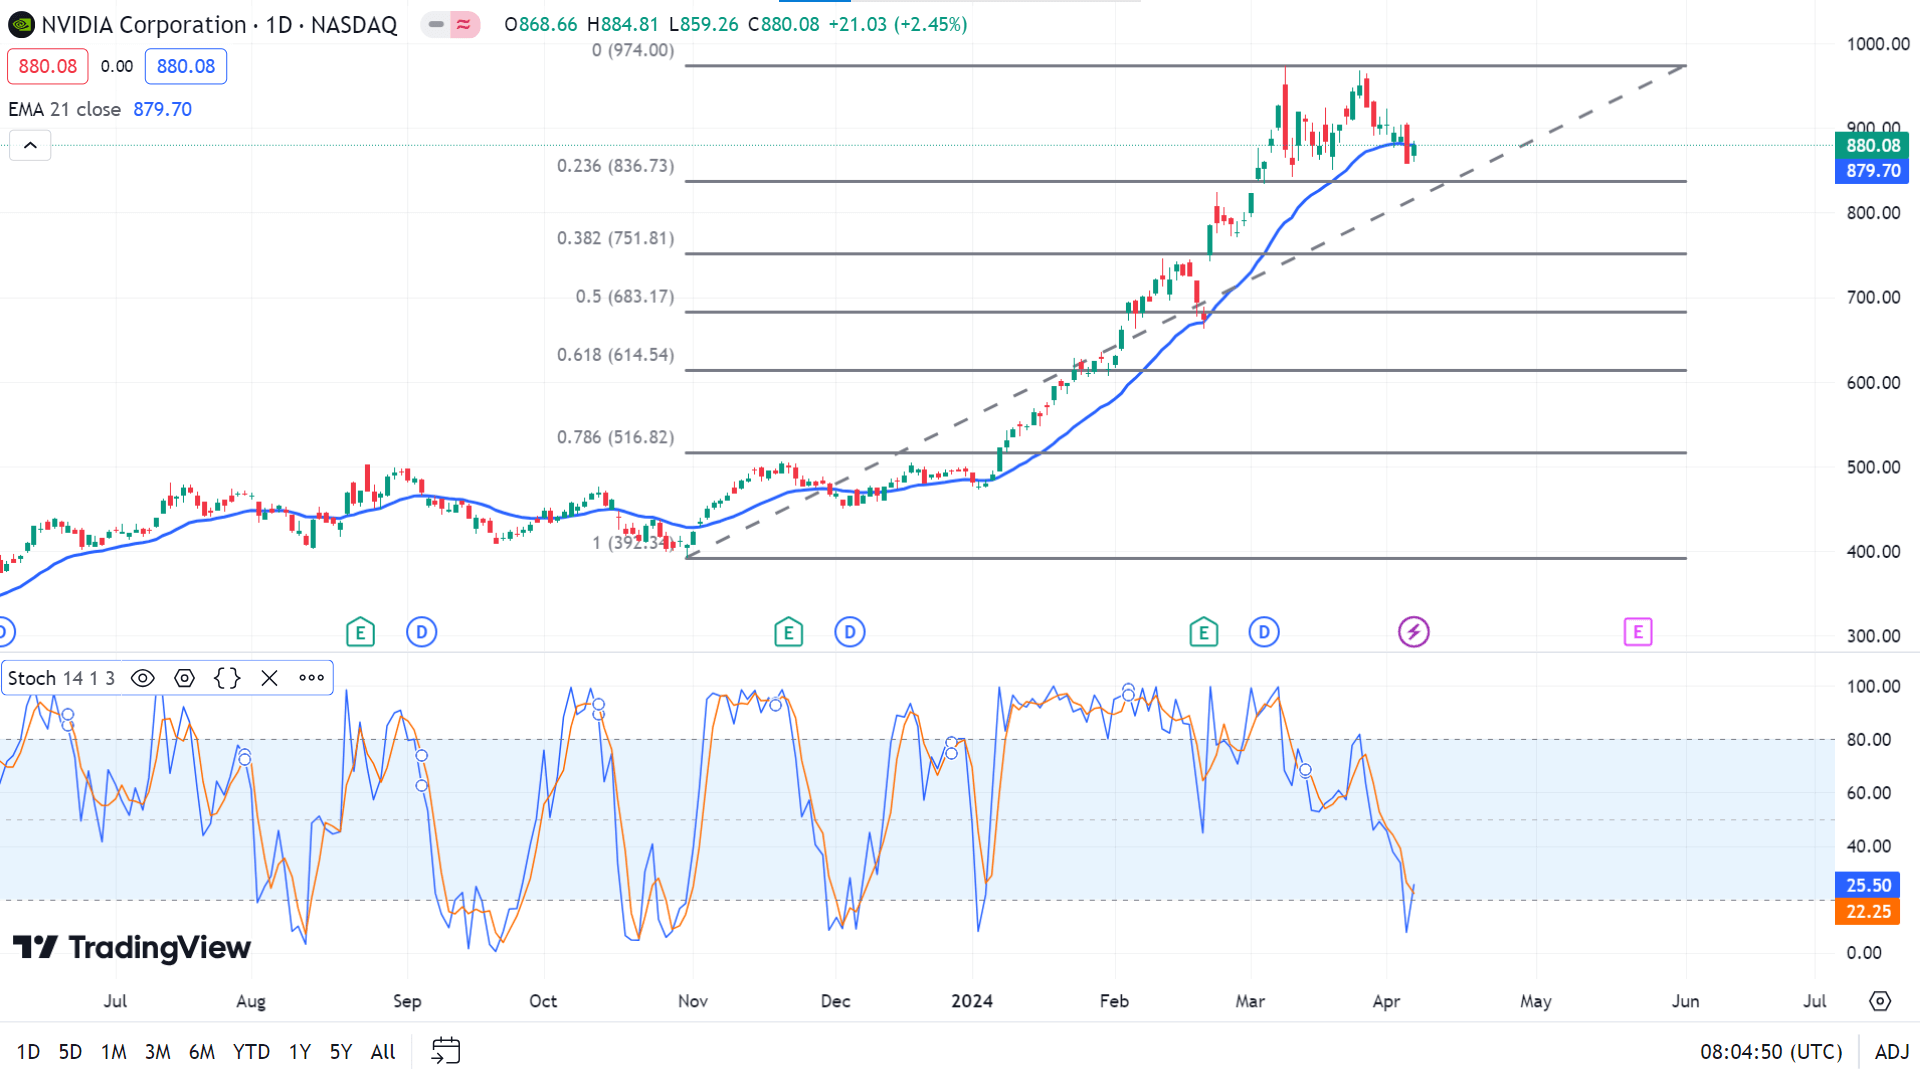
The price has been moving on an uptrend since the beginning of the year and hit a peak of $974.00 last month. Since then, the price has moved sideways, indicating confusion among investors, and bulls may lose power. The EMA 10, 20, 50, and 100 lines suggest bearish pressure on the asset price. It may reach $836.83 as it is a neckline of a possible double top pattern, following the next support near $751.81.
On the other hand, the Stochastic Oscillator suggests the price may reach an oversold level and be ready to surge upside. It may touch the recent peak of $974 or above with significant bullish pressure.
Tesla Stock (TSLA)
Fundamental Perspective
Elon Musk, CEO of Tesla (TSLA), took to his social media platform last Friday to announce that the electric vehicle (EV) maker will unveil its long-awaited robotaxi on August 8th, stating, "Tesla Robotaxi unveiled on 8/8." This announcement triggered a surge in Tesla’s shares, rising nearly 4% to $171.19 in extended trading after a 3.6% dip during the regular session.
This news follows shortly after Musk refuted reports about Tesla canceling plans for a lower-priced vehicle, instead focusing on an autonomous vehicle that could potentially make other vehicles obsolete.
Musk previously mentioned the robotaxi, described as a next-generation self-driving vehicle, in 2019. He envisions a future where owners could earn money by renting out their vehicles for an autonomous taxi service, with Tesla taking a commission.
However, the realization of Musk's ambitious vision has encountered setbacks, with initial projections suggesting robotaxis would be operational by 2020. Acknowledging this delay, Musk candidly admitted, "Sometimes I'm not on time."
Technical Perspective
The weekly candle closed red with smaller wicks on the downside, indicating solid bearish pressure on the asset price, so the price can continue to drop.
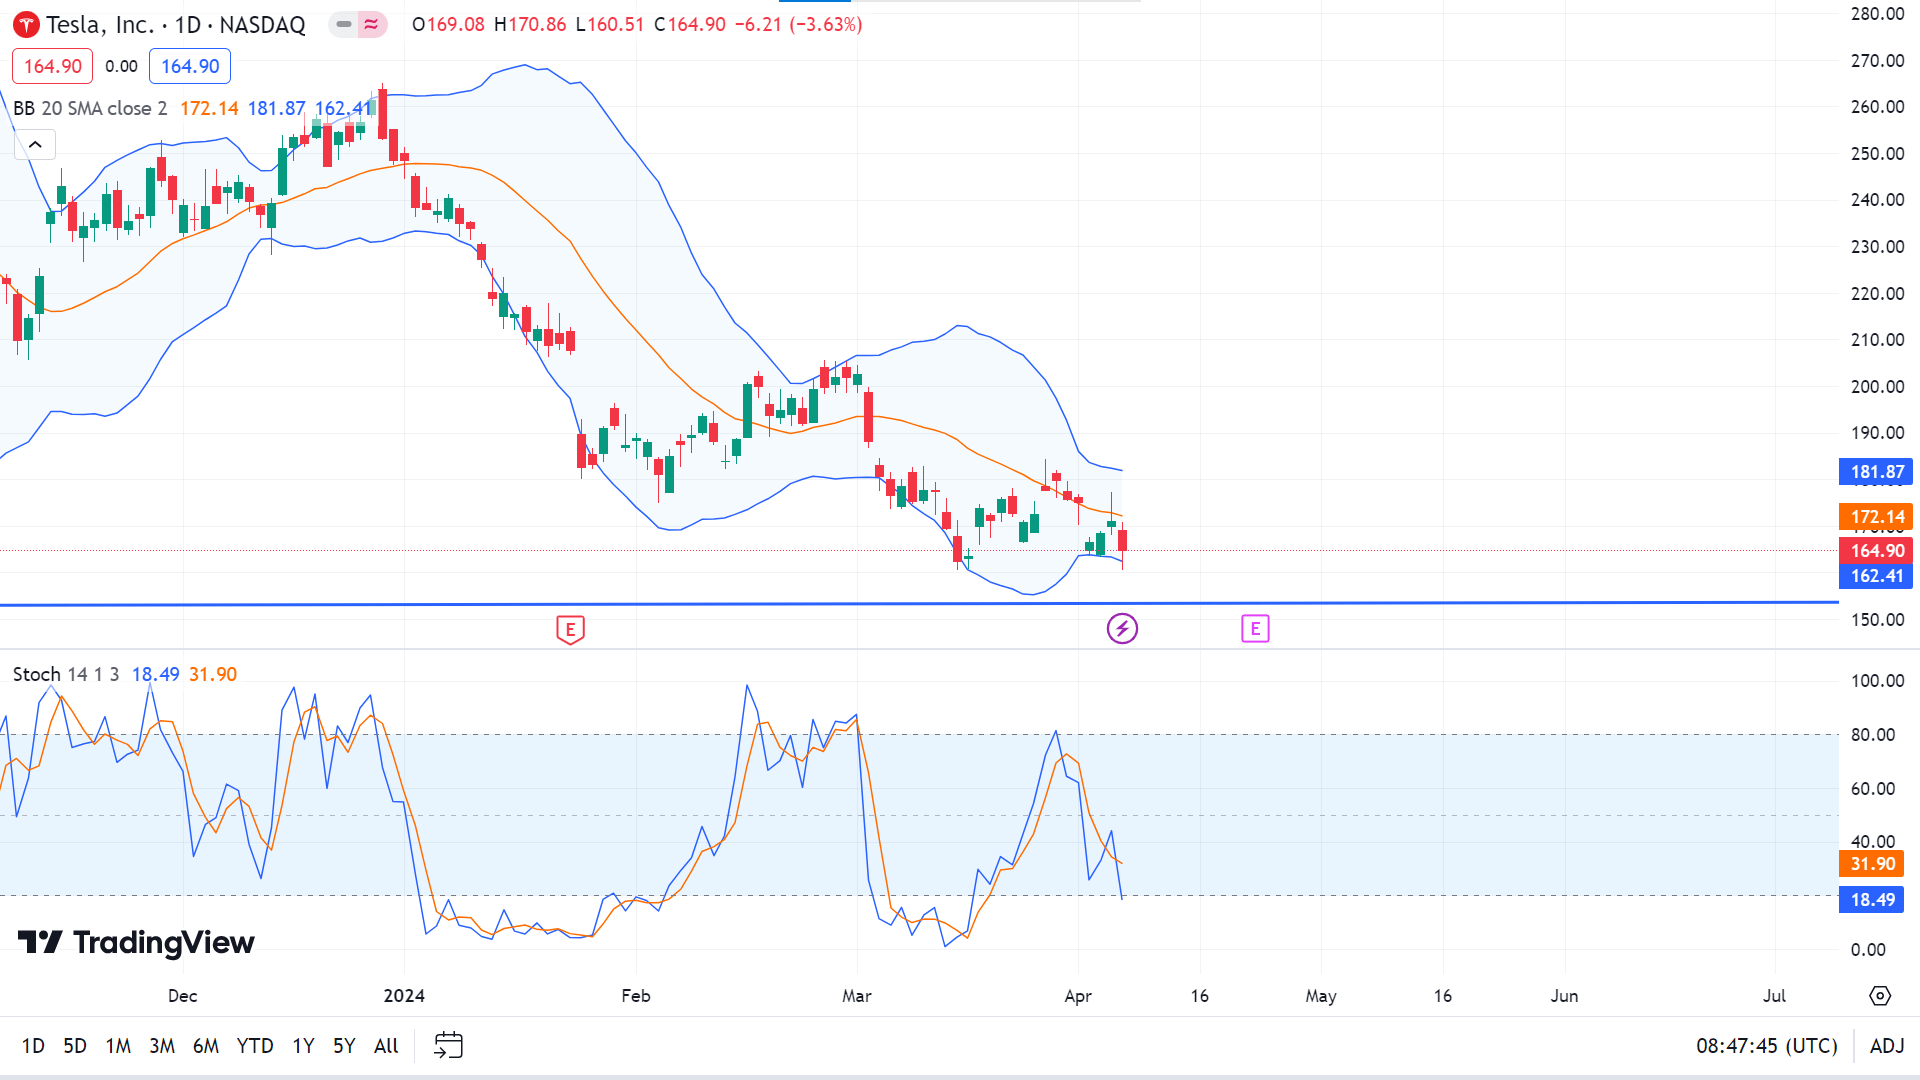
The daily chart shows the price has remained in a downtrend since the beginning of the year. EMA 10, 20, 50, 100, and 200 all suggest seller domination on the asset price. So, the price can decline to the current support of $152.35, following the next $101.81.
On the other hand, buyers can take control of the asset price and reach the peak of $184.25, as the Stochastic Oscillator suggests the price remains oversold.
Gold (XAUUSD)
Fundamental Perspective
Last week, Gold surged to new all-time highs above $2,300, despite a report from the United States Bureau of Labor Statistics (BLS) indicating further strengthening in the labor market for March. The Nonfarm Payrolls (NFP) report revealed robust hiring, with US employers adding 303K jobs, surpassing expectations of 200K and the previous reading of 270K. Additionally, the Unemployment Rate dropped to 3.8%, lower than both the consensus and prior reading of 3.9%.
However, while annual wage growth slowed to 4.1% from the previous 4.3%, in line with forecasts, the monthly Average Hourly Earnings slightly rose to 0.3% from February's 0.2%.
Despite the positive labor market data, gold prices surged due to expectations that strong labor demand might hinder progress toward achieving a 2% inflation target, potentially delaying the Federal Reserve's plan to reduce interest rates starting in June. This expectation raised the cost of holding non-yielding assets like gold, influencing its price. Concurrently, the 10-year US Treasury yield climbed to 4.37% in anticipation of the Fed maintaining higher interest rates for longer.
Traders initially priced in a 58% chance of Fed rate cuts in June, but bets decreased following the upbeat NFP data. The US Dollar Index (DXY) also strengthened to 104.50 as strong employment conditions indicated a positive economic outlook.
Technical Perspective
The weekly XAUUSD candle finished solid green, indicating the price is facing significant bullish pressure and can continue to surge upside.
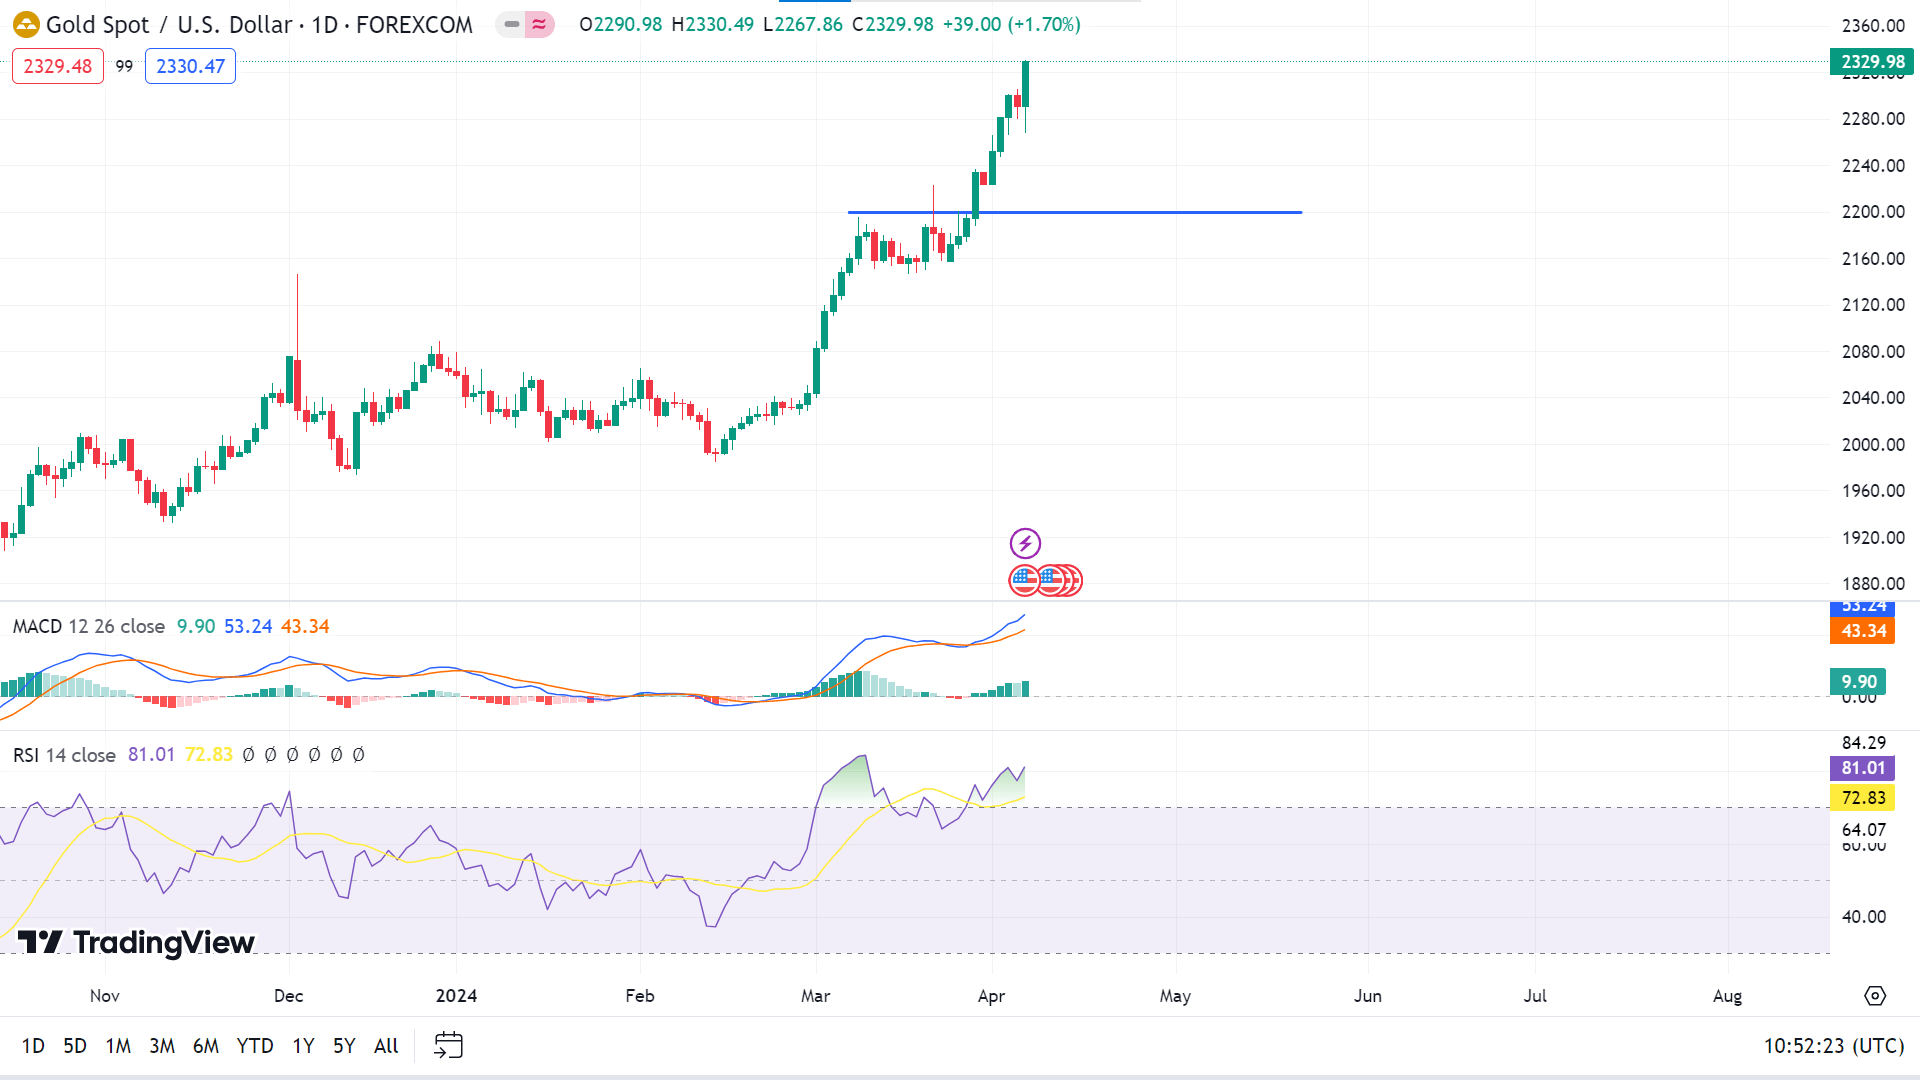
Gold prices are rapidly surging, and the upside has reached an all-time high above $2300. Technical indicators, including MACD, EMA 20, EMA 100, EMA 200, and CCI, indicate that the price can continue to increase and reach a new high of $2500 in the coming days.
On the other hand, the RSI indicator suggests the price remains overbought, suggesting a price decline is anticipated if buyers lose interest. The primary support is near $2200, following the next support near $2000.
WTI Crude Oil (USOUSD)
Fundamental Perspective
The oil market experienced a notable surge last week, witnessing both Brent and West Texas Intermediate (WTI) crude oil benchmarks climbing nearly $4 per barrel. This ascent, reaching its highest levels since October, was driven by escalating tensions in the Middle East and encouraging economic indicators from the United States, signaling robust future demand.
Technically, the market appears poised for a breakout above a significant trend line, potentially triggering more aggressive buying and amplifying momentum if it sustains a move above $85.18 this week.
The looming threat of direct conflict between Israel and Iran has become a significant concern for oil markets, with Iran vowing retaliation for attacks on its military personnel. Its heightened geopolitical risk, a traditional driver of oil supply and prices, is further compounded by ongoing attacks on Russian refineries by Ukrainian drones, straining Russia’s fuel output capabilities.
In its recent meeting, OPEC+ opted to maintain its current oil supply policy and emphasized stricter adherence to production cuts, hinting at a tighter oil market in the upcoming quarter.
The robust performance of the US economy, characterized by significant job creation and wage growth, also shapes oil demand significantly. The addition of 303,000 jobs in March signals robust potential for oil consumption despite potential delays in US Federal Reserve interest rate cuts, which may impact commodity markets.
Considering the current geopolitical landscape and economic factors, the short-term outlook for crude oil remains bullish, with market participants closely monitoring global developments that could influence oil prices and market dynamics.
Technical Perspective
The solid green weekly candle and the gap indicate buyer dominance on the asset price, and the price may keep gaining in the upcoming days.
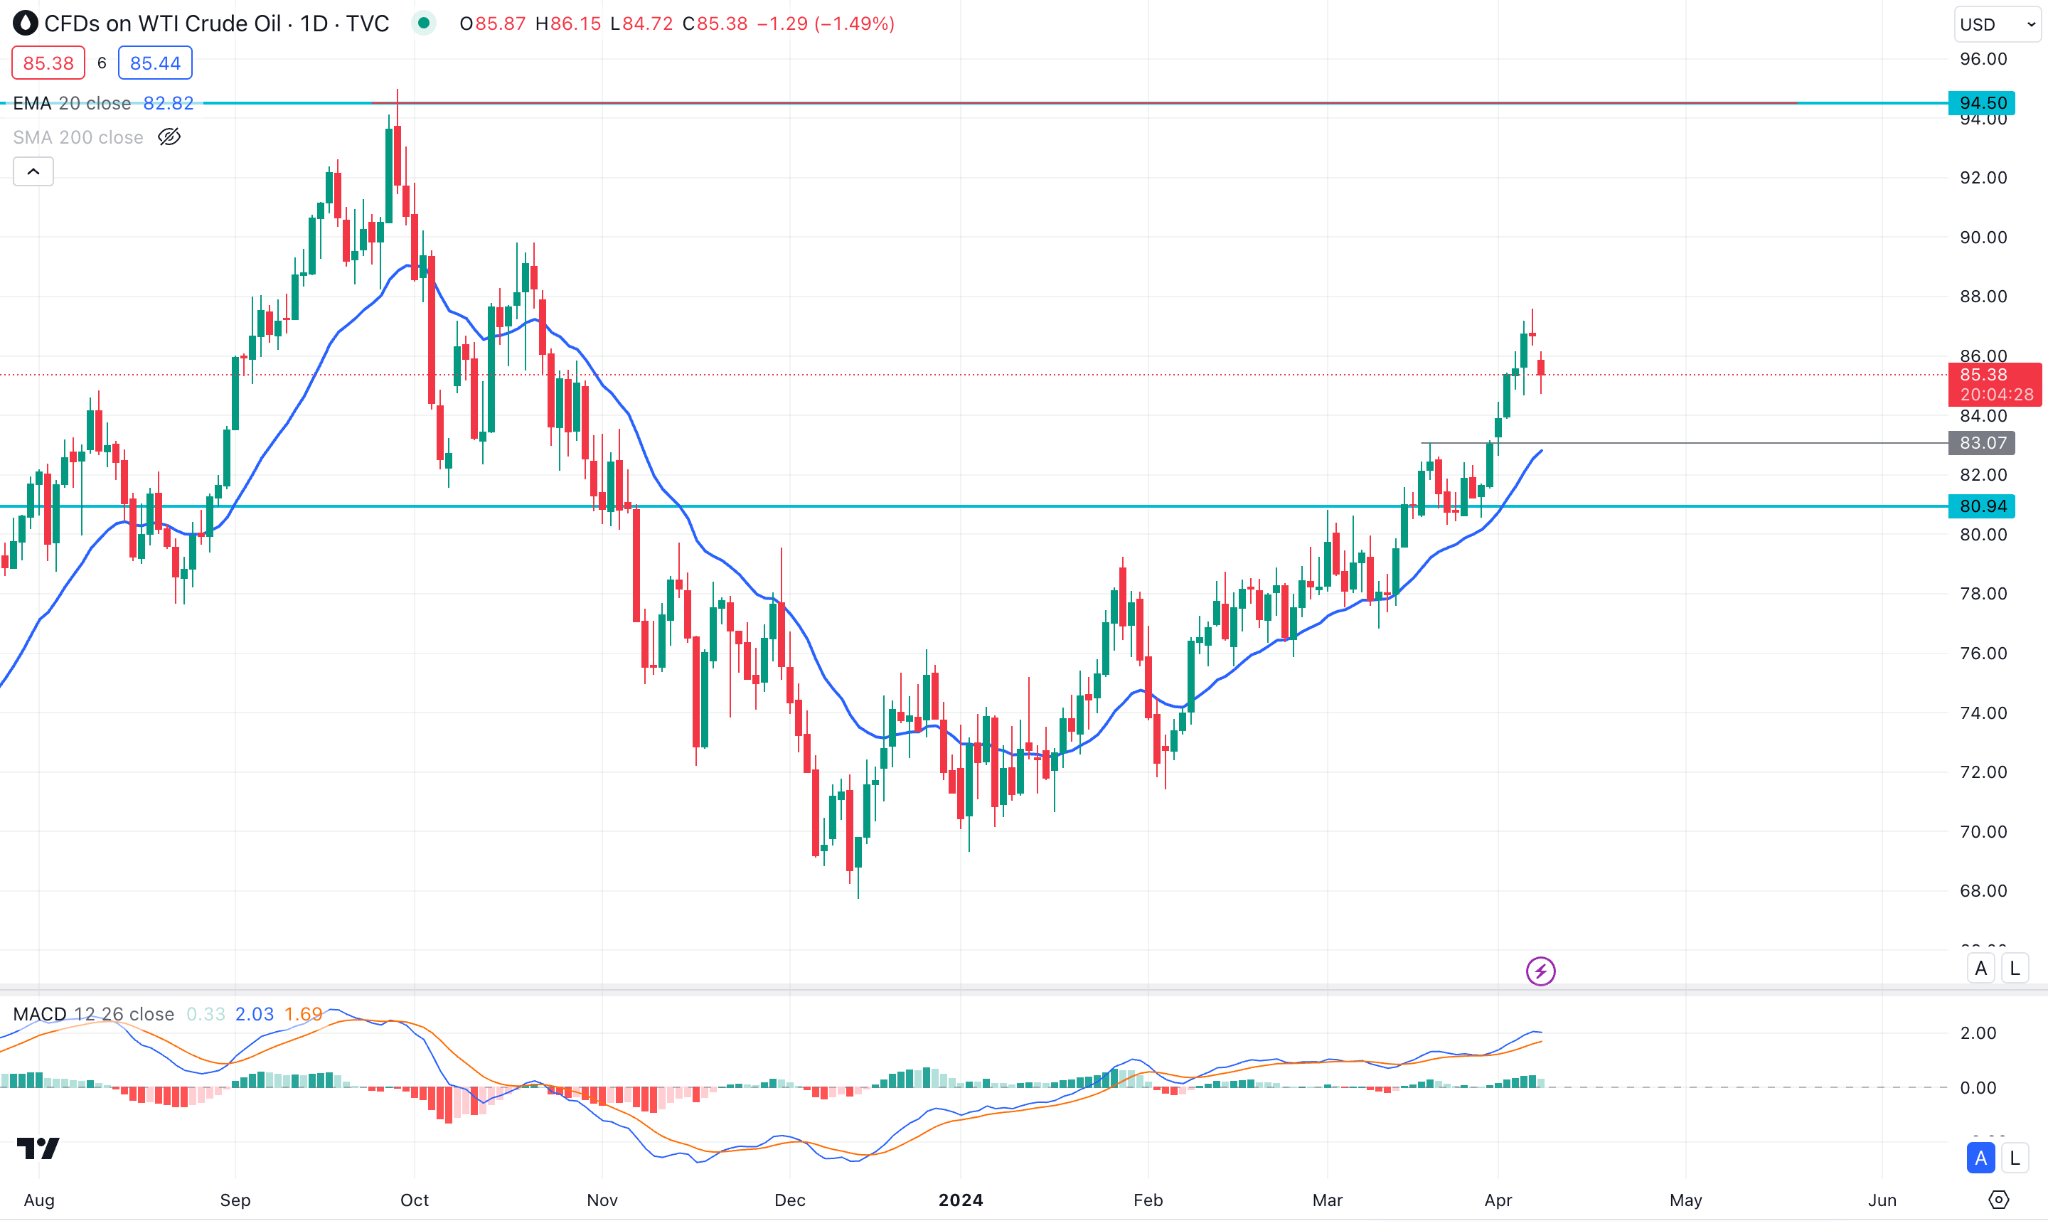
The price may head toward the current resistance level of nearly $91.50, which is also the top for 2023, as several indicators, such as MACD, Stochastic Oscillator, EMA 50, EMA 100, and EMA 200 lines, suggest significant bullish pressure on the asset price.
Conversely, EMA 10, EMA 20, and ADX indicator readings suggest the price can drop from here to the recent support of $82.00, following $80.50 to fill the gap and as a correction before continuing to the uptrend.


