


EURUSD
Fundamental Perspective
The US Dollar (USD) surged last week, driving the EURUSD pair to its lowest point since November. The primary catalyst behind the stronger USD was the high inflation figure, although this wasn't the sole contributing factor.
Federal Reserve (Fed) officials have opted for a wait-and-see approach. Market analysts have long speculated about the potential timing of monetary policy adjustments, but persistent inflationary pressures have restrained policymakers from pursuing normalization. Moreover, the prospect of higher interest rates has evoked nuanced responses across different sectors of the economy.
On Wednesday, the US Bureau of Labor Statistics (BLS) revealed that the March Consumer Price Index (CPI) escalated by 0.4% MoM and 3.5% YoY, surpassing projections. The core annual CPI, excluding volatile food and energy prices, exceeded expectations, reaching 3.8%. These figures heightened risk aversion among speculative interests, aligning with Federal Reserve Chair Jerome Powell's recent affirmations regarding the central bank's cautious stance on rate adjustments.
Market sentiment underwent a significant transformation, shifting from anticipation of three rate cuts throughout 2024, with the possibility of an initial cut in March, to contemplating only two cuts by year-end, potentially commencing in July.
Conversely, European Central Bank (ECB) officials are deliberating rate cuts to stimulate economic activity. The EURUSD pair depreciated approximately 120 pips following this revelation. Despite maintaining key rates unchanged, ECB President Christine Lagarde hinted at the potential easing of monetary policy constraints contingent upon inflationary trends.
Technical Perspective
The weekly EURUSD candle closed as a solid red pressure, signaling a downside continuation this week.
The daily chart confirms that the price broke below the primary support level of 1.0700, and as Bollinger bands suggest, it can reach the next support level, which will be near 1.0510 in the coming days.
On the other hand, the price can return to the previous support of 1.0700, as the MACD suggests the price fluctuates at a neutral position where buyers can be interested.
GBPJPY
Fundamental Perspective
Amidst a relatively subdued week regarding data releases, GBPJPY traders anticipate limited market-moving events, with the UK CPI inflation report for March taking precedence.
Wednesday's release of inflation figures will be the highlight, preceded by a speech by BoE policymaker Sarah Breeden.
The UK jobs report will be released on Tuesday. It will be followed by BoE Governor Andrew Bailey's address at the International Monetary Fund (IMF) Spring Meetings, which will offer insights into the UK's economic landscape.
Continuing the discourse, Bailey returns to the podium on Wednesday, presenting his perspective on the global economic outlook at the Institute of International Finance Global Outlook Forum.
As the week draws to a close, Friday will feature appearances by BoE policymakers Sarah Breeden and Dave Ramsden, coinciding with the release of March’s UK Retail Sales data.
Technical Perspective
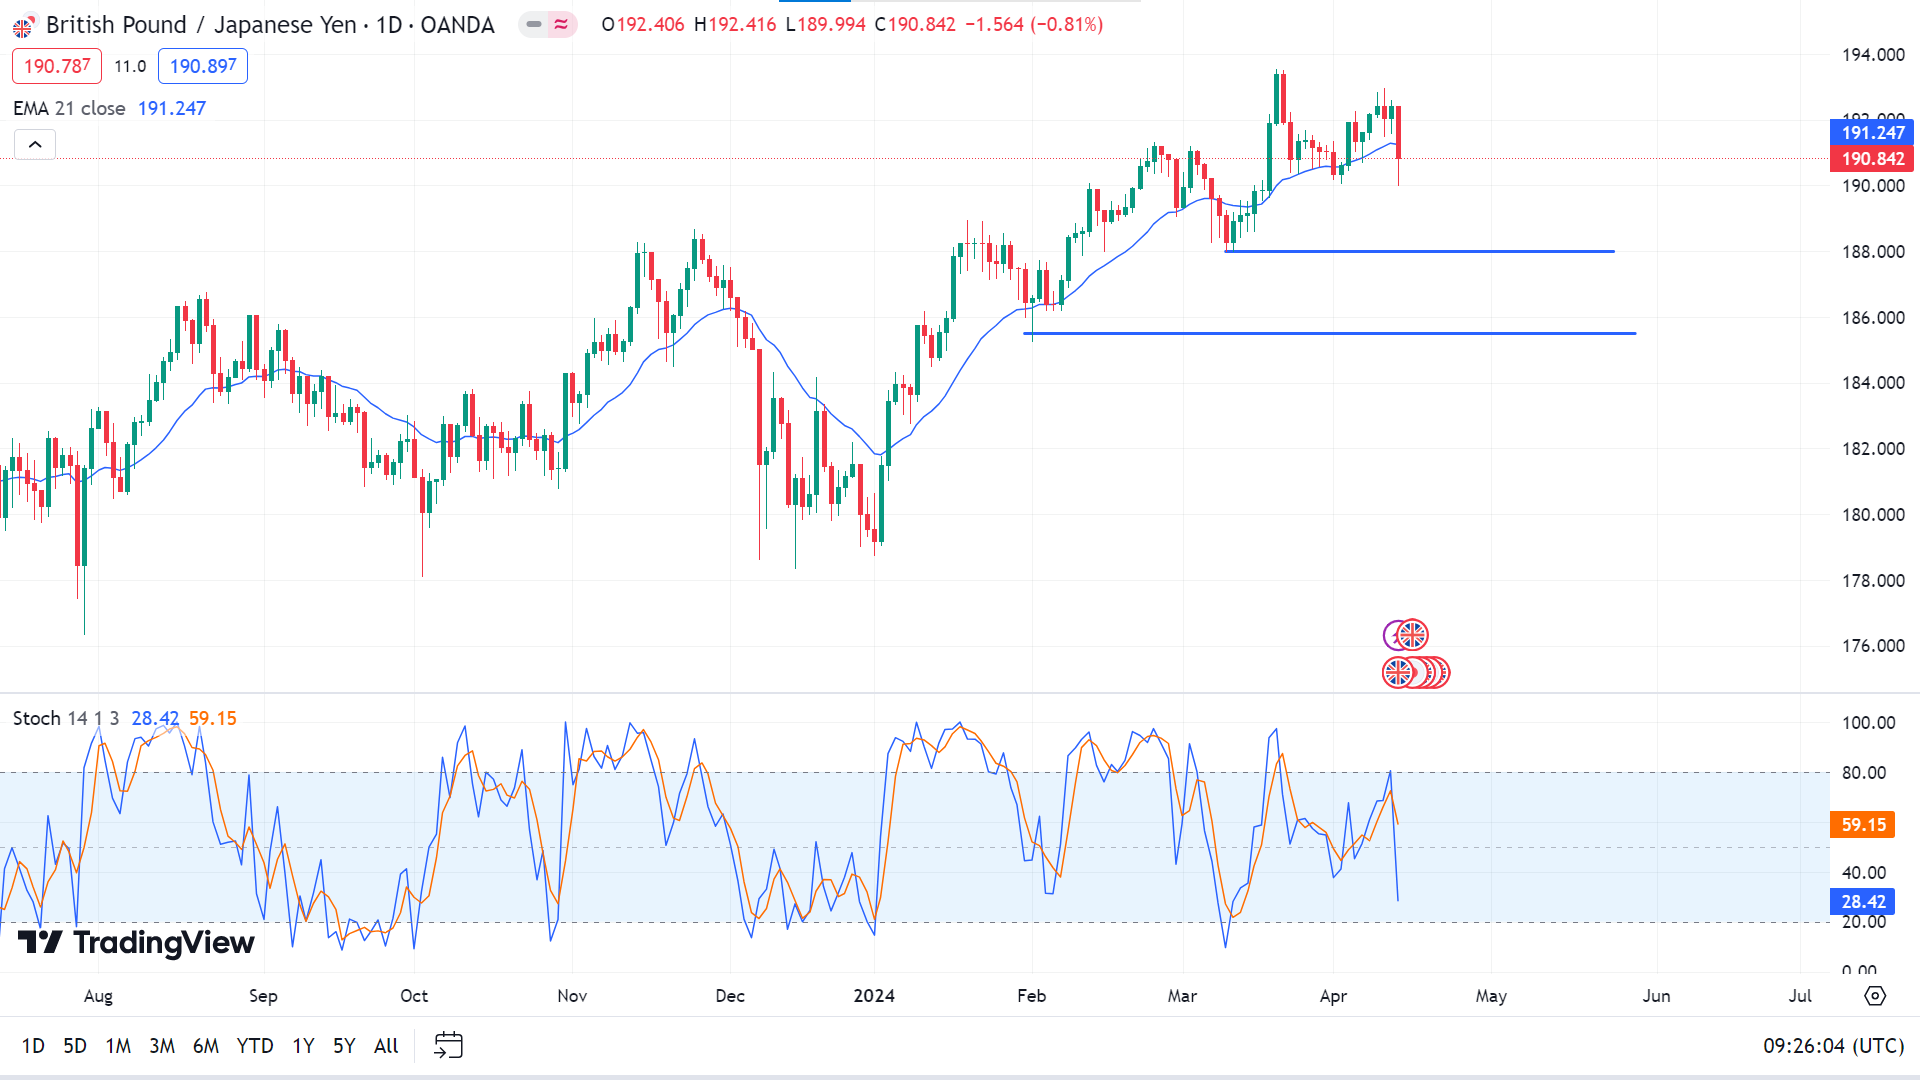
The weekly GBPJPY candle finished red, slightly consolidating near a multi-year high, suggesting a downside pressure to the critical level.
On the daily chart, the price slips from a consolidating phase, reaching below the EMA 21 line. This suggests the price may head toward the previous support of nearly 188.00, followed by the next support of almost 185.50.
On the other hand, the price can continue to move upward as the Stochastic indicator suggests that long-term buyers may still be in play, whereas short-term investors may take profit from a multi-year high. So, the price can reach 192.95 as the primary resistance, and a breakout can trigger the price to 195.26, which is near the high of 2015.
Nasdaq 100 (NAS100)
Fundamental Perspective
The recent mixed Producer Price Index (PPI) report had minimal impact on market volatility, with most major US indices edging slightly higher, except for the Dow, which tested mid-February lows. A surge in the Consumer Price Index (CPI) the day prior spurred bearish sentiment, prompting investors to recalibrate their expectations for Federal Reserve rate cuts. They anticipate only two cuts commencing in September, compared to the previous projection of three cuts as early as June or July. The likelihood of a June cut has diminished to less than one in five, while the probability of a 25 basis point cut in July has fallen below 50%, a significant shift from expectations just weeks ago.
Concerns regarding mounting inflation and rising bond yields have subdued risk appetite, evident in the struggle of major US indices to maintain the momentum witnessed over the past two quarters, characterised by frequent record-setting days. There is more volatility, particularly with the Dow experiencing more selling pressure than buying.
Attention now turns to the forthcoming earnings season. Given the market's elevated levels, investors anticipate robust earnings, but the economy's performance may need to exceed expectations to justify current valuations.
Additionally, escalating tensions in the Middle East, impacting crude oil prices, add to inflation concerns. Despite a modest easing in crude prices, renewed uncertainties have tempered earlier optimism about interest rate cuts, as inflationary pressures and resilient economic data pose unforeseen challenges for bullish investors.
Technical Perspective
The weekly NAS 100 chart shows three consecutive losing weeks, indicating not much bullish pressure.
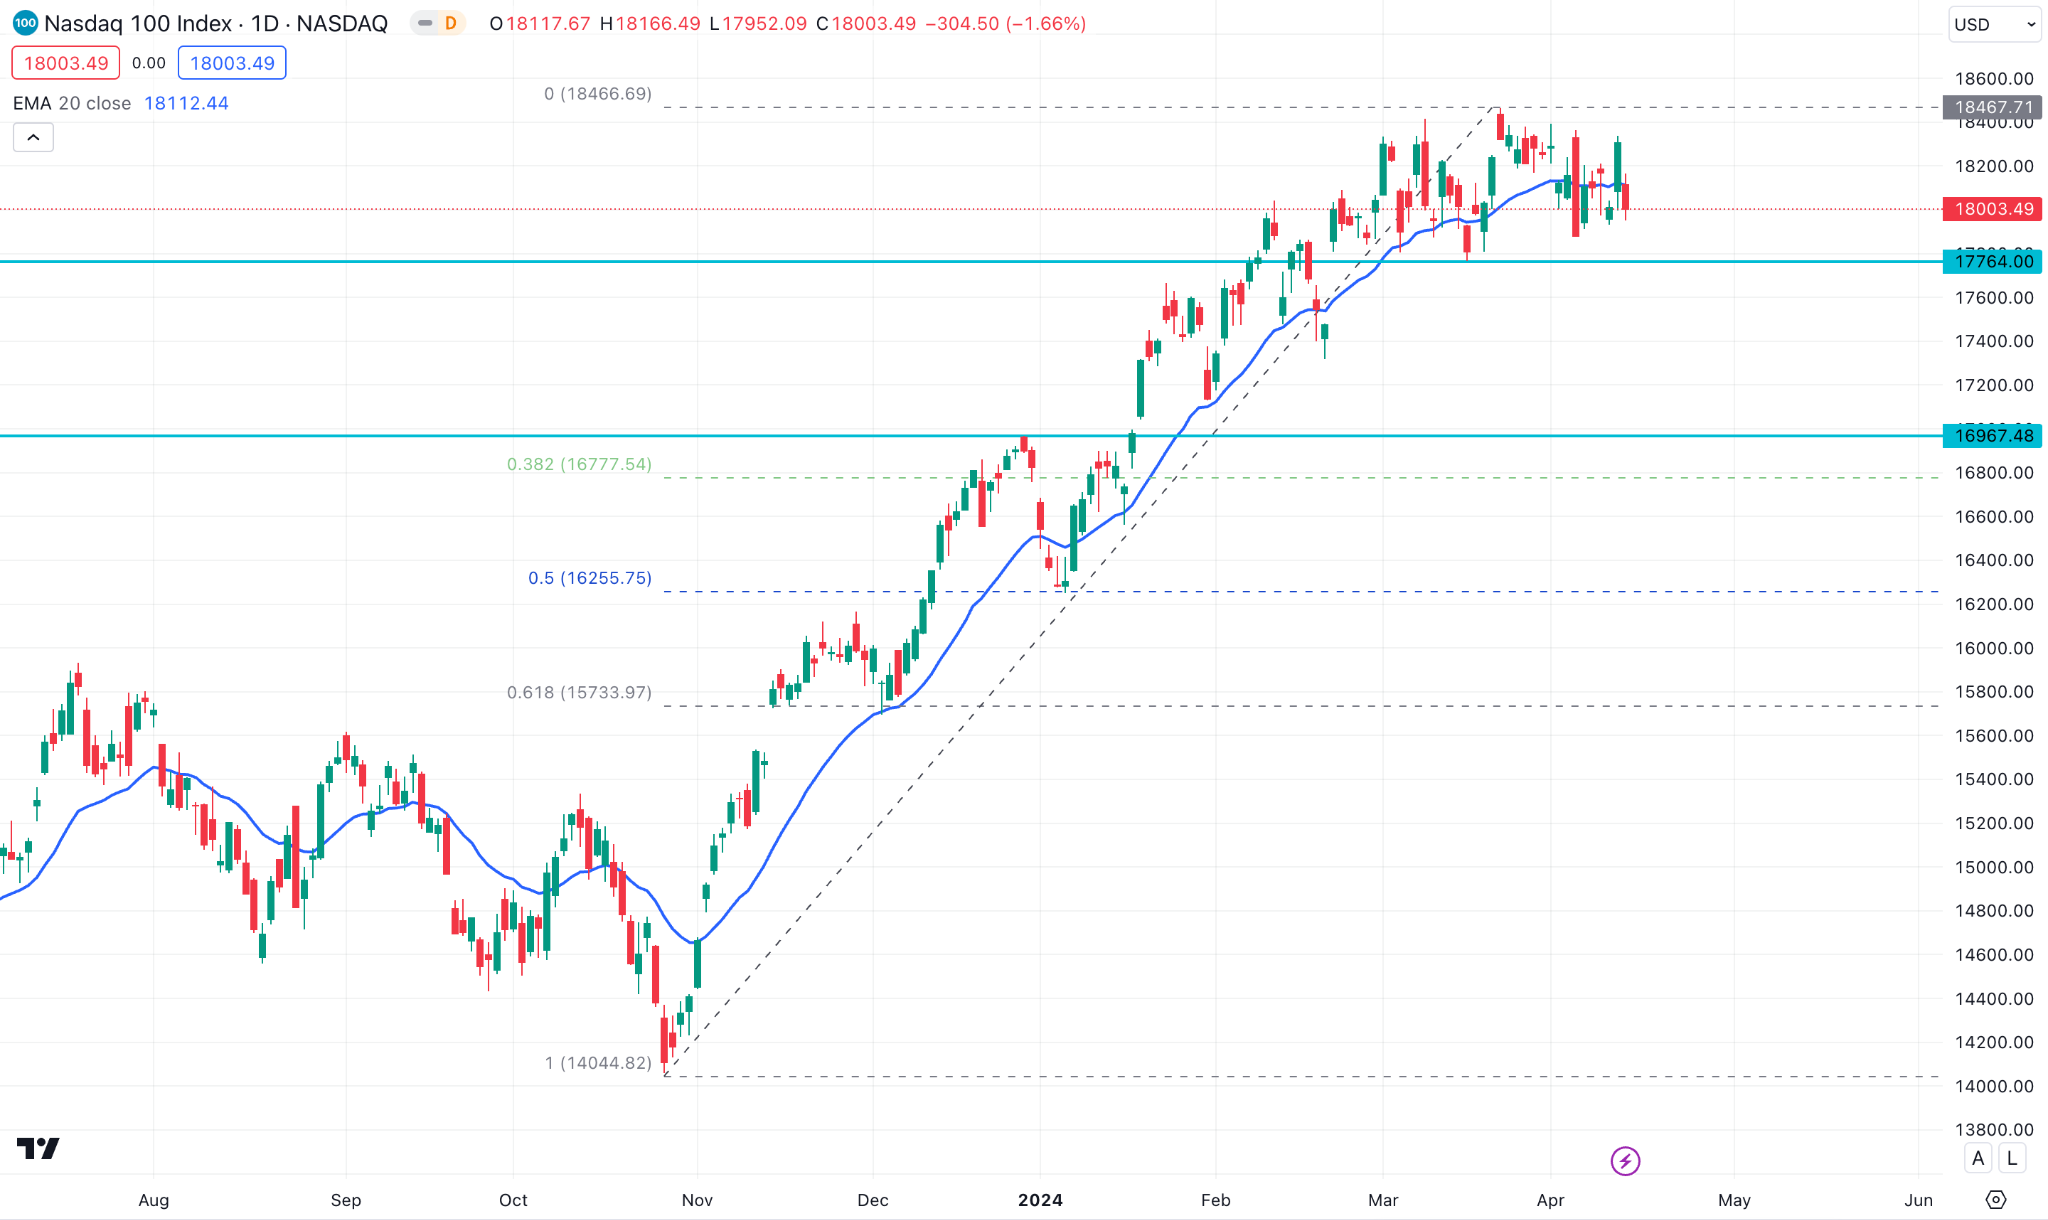
The Nasdaq 100 price consolidates after reaching the top at nearly 18494.36. The EMA 21 line suggests losing bull power, and the price can continue to drop near 17445.22 in the upcoming days.
On the other hand, the RSI indicator reading shows the price fluctuates near a neutral level after dropping from the overbought area, Indicating bulls are in control for now. Still, the price can surge to the peak of 18494.36 and continue to gain as it remains on an uptrend for years.
S&P500 (SPX500)
Fundamental Perspective
US stocks experienced a sell-off on Friday as disappointing results from major U.S. banks marked the culmination of a week characterised by significant market events, including impactful inflation data, evolving expectations regarding US Federal Reserve policy, and mounting geopolitical tensions.
The S&P 500 index recorded its most substantial weekly percentage decline since January, while the Dow Jones Industrial Average suffered its most significant weekly loss since March 2023.
Throughout the week, economic data, particularly Wednesday's Consumer Price Index report revealing higher-than-expected inflation, hinted at a potentially enduring inflationary trend. It prompted investors to recalibrate their expectations regarding the timing and extent of Federal Reserve rate cuts for the year.
Boston Fed President Susan Collins anticipates a couple of rate cuts this year, acknowledging the time it might take for inflation to align with the targeted level. Meanwhile, Austan Goolsbee, president of the Chicago Fed, eagerly awaits the Personal Consumption Expenditures report on April 26 for a more precise assessment of inflation's trajectory.
Amidst this backdrop, simmering geopolitical tensions, highlighted by Iran's threats against Israel following an April 1 airstrike on its embassy in Damascus, further fueled market uncertainty and contributed to the sell-off.
Technical Perspective
The weekly S&P 500 chart shows the last candle was solid red, posting two consecutive losing weeks, indicating sellers are in winner on the asset price, and it may head to the support near 4820.00.
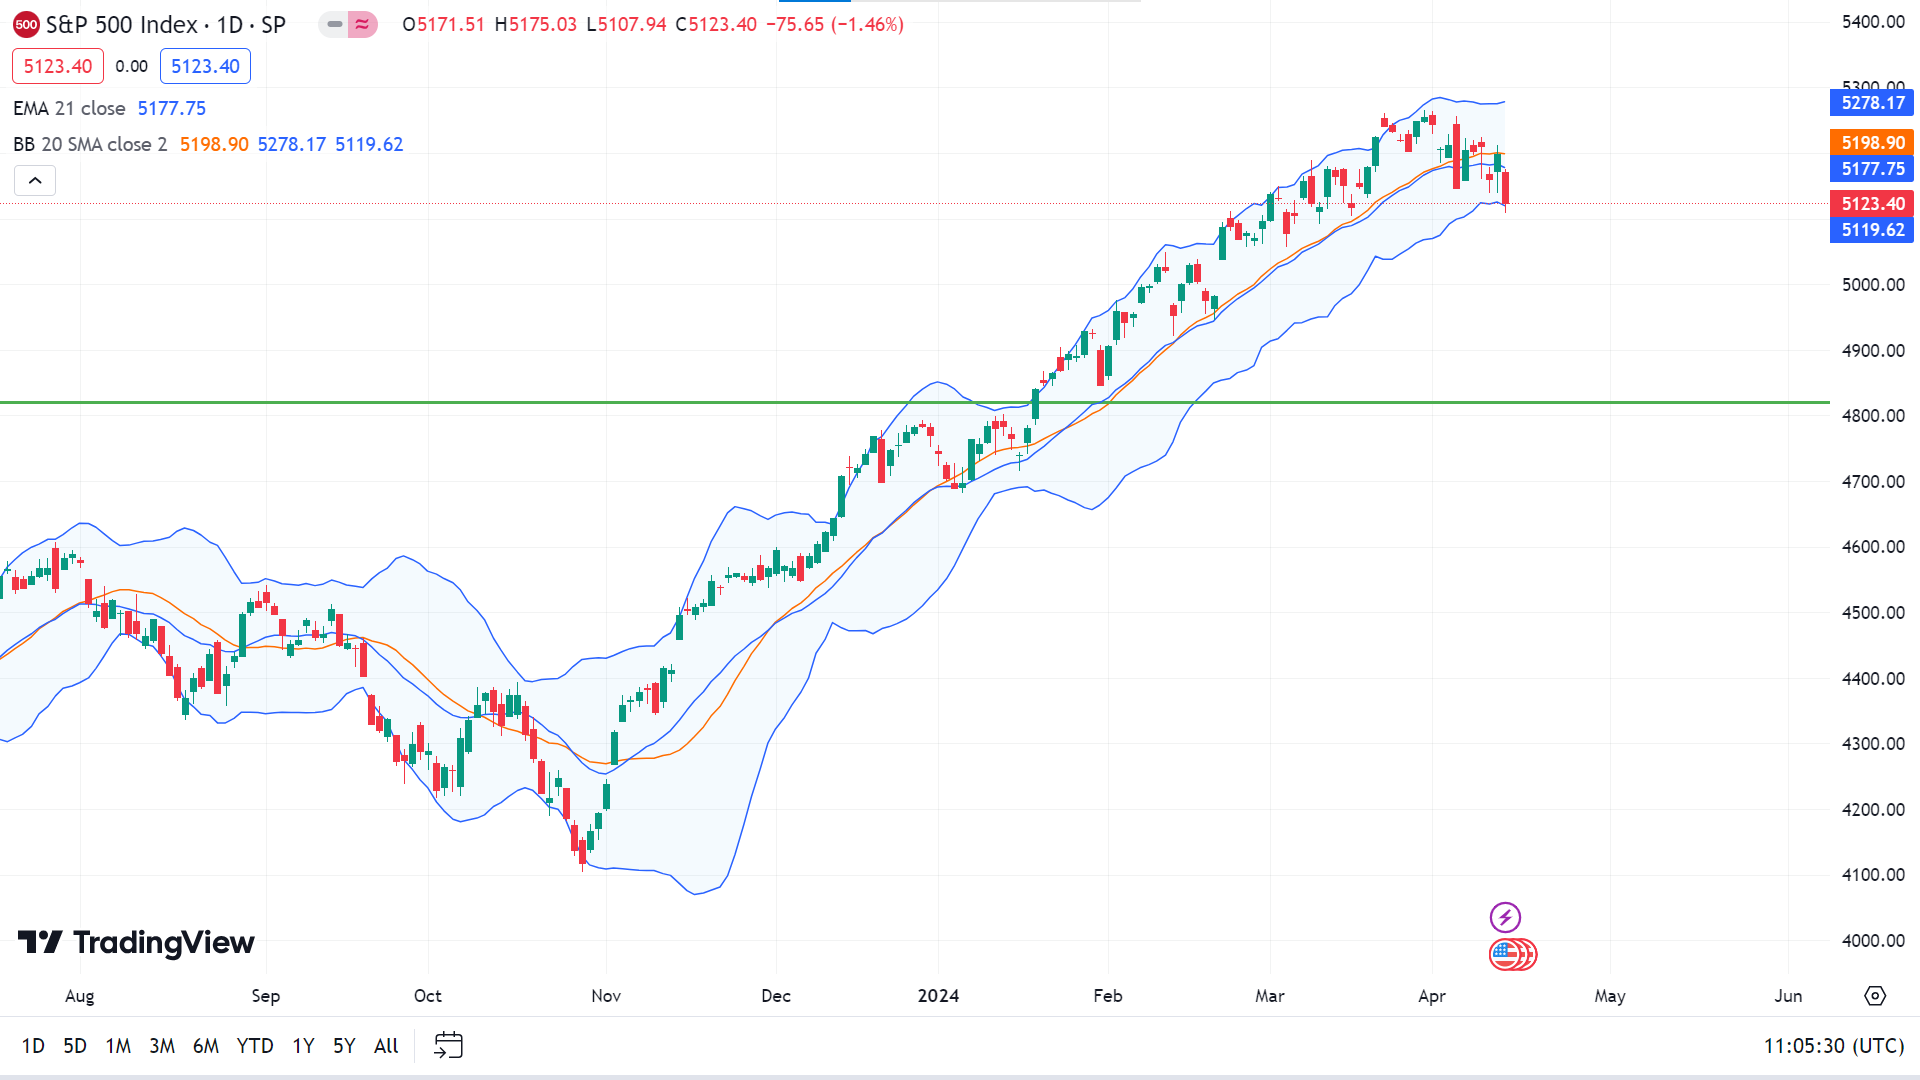
The price faces resistance near 5264.25 on the daily chart and reaches below the EMA 21 line over five months, indicating investors can see 4820.00 again.
However, the Bolinger bands show that the price reaches the lower band, suggesting a potential buy area. The price may regain its peak of 5264.25 and continue its long-term trend.
Bitcoin (BTCUSD)
Fundamental Perspective
In a recent analysis on X, blockchain intelligence firm Santiment provided captivating insights into Bitcoin's current market cycle and price performance. Notably, Santiment spotlighted the Mean Dollar Invested Age metric as a pivotal indicator amid Bitcoin's lateral movement.
The Mean Dollar Invested Age metric tracks the average age of investment in an asset within the same wallet. A rising indicator suggests stagnation in investments, with older coins remaining in wallets. Conversely, a decreasing metric indicates a resurgence of investments into regular circulation, indicative of heightened network activity.
Throughout Bitcoin's historical bull cycles, a declining Mean Dollar Invested Age line has been a recurring pattern. Sentiment observed a parallel trend in the ongoing bull run initiated in late October 2023. However, the firm highlighted a recent stagnation in Bitcoin's Mean Dollar Invested Age line, a significant observation given the imminent halving event.
The impending Bitcoin halving, reducing miners' rewards from 6.25 BTC to 3.125 BTC, traditionally instills bullish sentiment and has contributed to optimistic forecasts for Bitcoin in 2024.
Santiment's analysis underscores the significance of monitoring the Bitcoin Mean Dollar Invested Age metric. A resurgence in the declining trend of BTC's Mean Dollar Invested Age line would signal renewed circulation and participation from major stakeholders, potentially indicating a sustained bullish market sentiment.
Technical Perspective
The weekly chart shows the price continues sideways after reaching the ATH near $73794.00, reaching the low near $61,308 for the week.

On the daily chart, the price reaches below the lower band of the Bollinger bands, indicating a potential buy area for BTC, and a close above $70,000 will open the door to regain $73794.00.
On the other hand, if the price closes below the $61,308 level, it could trigger the price to reach $52,500, as MACD suggests seller domination.
Ethereum (ETHUSD)
Fundamental Perspective
The discourse surrounding Ethereum (ETHUSD) and its data storage optimisation for enhanced functionality has found its way onto the crypto X platform, featuring a debate between Polygon co-founder Mihailo Bjelic and Vitalik Buterin, Ethereum's co-founder. The conversation kicked off with Bjelic posing a question about the wisdom of transitioning Ethereum to Verkle trees, given the potential for its zk-fication.
In response, Buterin expressed skepticism, deeming the implementation of ZK technology with keccak Merkle Patricia trees impractical due to potential witness sizes reaching 300 MB. Given the limitations of the current Merkle Patricia trees, plans are underway to replace them with Verkle trees, promising shorter proofs and improved bandwidth.
Bjelic contested Buterin's reservations, citing Polygon's zkEVM's ability to efficiently manage the 300 MB benchmark, albeit requiring substantial computational resources.
Buterin emphasised that Merkle trees were not originally designed to integrate with ZK technology, advocating for adopting Verkle trees with vector elements to facilitate compatibility.
In the grand scheme of Ethereum's architecture, ZK protocols predominantly manifest as Layer-2 scaling solutions. While these solutions offer improved throughput, scalability, reduced gas fees, and enhanced data storage, Ethereum grapples with scaling amidst increasing demand.
Buterin underscored the necessity of transitioning Ethereum to a ZK-tech-compatible network by adopting Verkle trees. Such a transition could position Ethereum to leverage the long-term benefits of the Dencun upgrade.
Technical Perspective
The weekly chart of ETHUSD shows a sharp drop from a consolidation phase, indicating sellers' domination of the asset price, delivering a solid red candle.
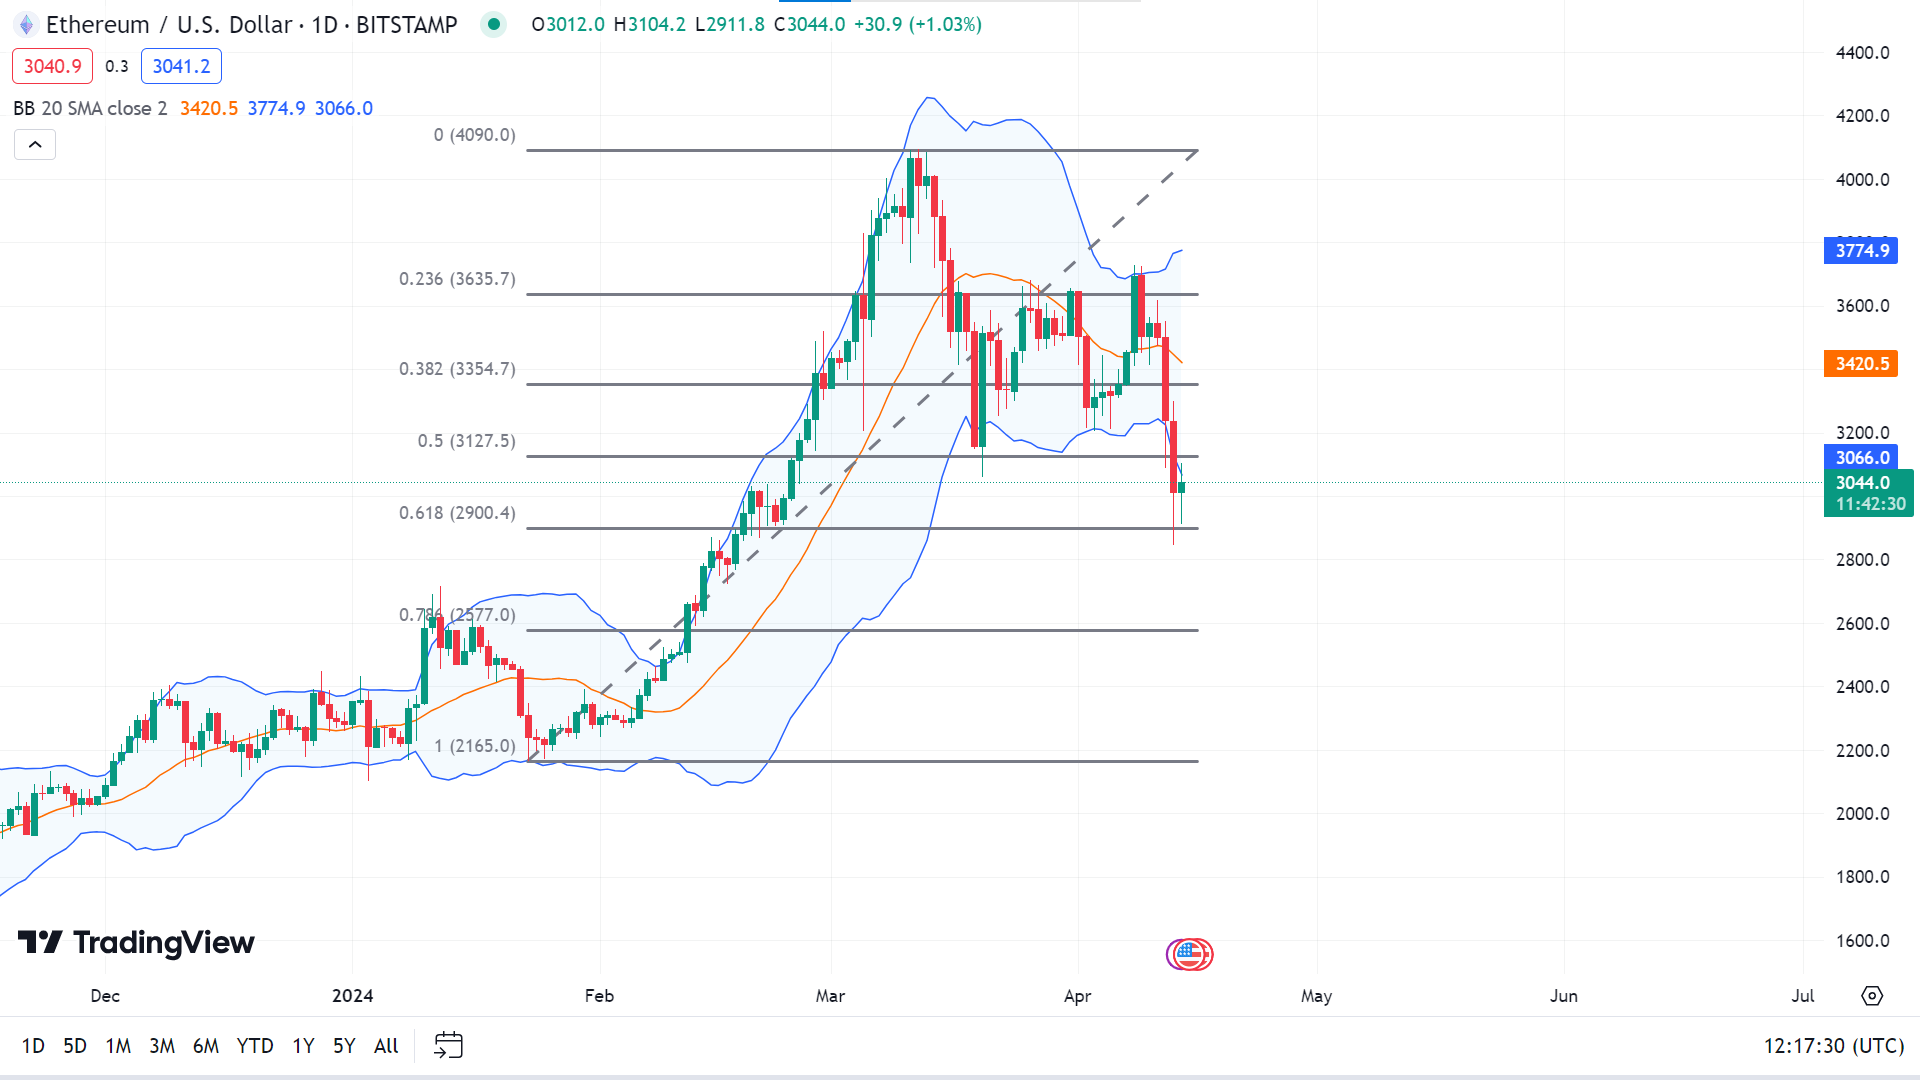
On the daily chart, the price retreats from the 61.8% Fibo level between the $4090.00 to $2165.00 range, delivering it as a buy area; if the price remains above the $3200 level it can continue to reach the next resistance level, near $3500.00.
However, a close below $3100.00 can trigger the price to the primary support near $2900.40, following the next support near $2577.00.
Nvidia Stock (NVDA)
Fundamental Perspective
Bank of America (BAC) analysts have characterized Nvidia's recent dip as a "rejuvenating pause," underscoring their steadfast belief in the chip giant's capacity to weather market shifts and maintain or enhance its market share. This recent downturn marks the ninth occurrence since ChatGPT's inception in 2022, per Bank of America's research.
Several market factors are believed to have contributed to this downturn, including unexpected spikes in inflation, market volatility, concerns surrounding competition, and what analysts term "AI stock fatigue."
Despite the emergence of new chip announcements from industry giants like Alphabet's Google Axion Processor and Intel's Gaudi 3 AI accelerator, Bank of America stands firm in its conviction, reaffirming Nvidia as a top pick.
The analysts project Nvidia's continued supremacy, forecasting a capture of over 75% of the approximately $90 billion accelerator market. They anticipate that internally developed custom chips by industry giants such as Google, Microsoft, and Amazon will command a market share of 15% to 20%, with another 15% to 20% distributed among competitors like Advanced Micro Devices (AMD) and Intel (INTC).
Technical Perspective
The weekly candle closed with a small red body and a long lower wick after two consecutive losing weeks suggesting bulls may come back soon, and the bullish trend may continue from this level.
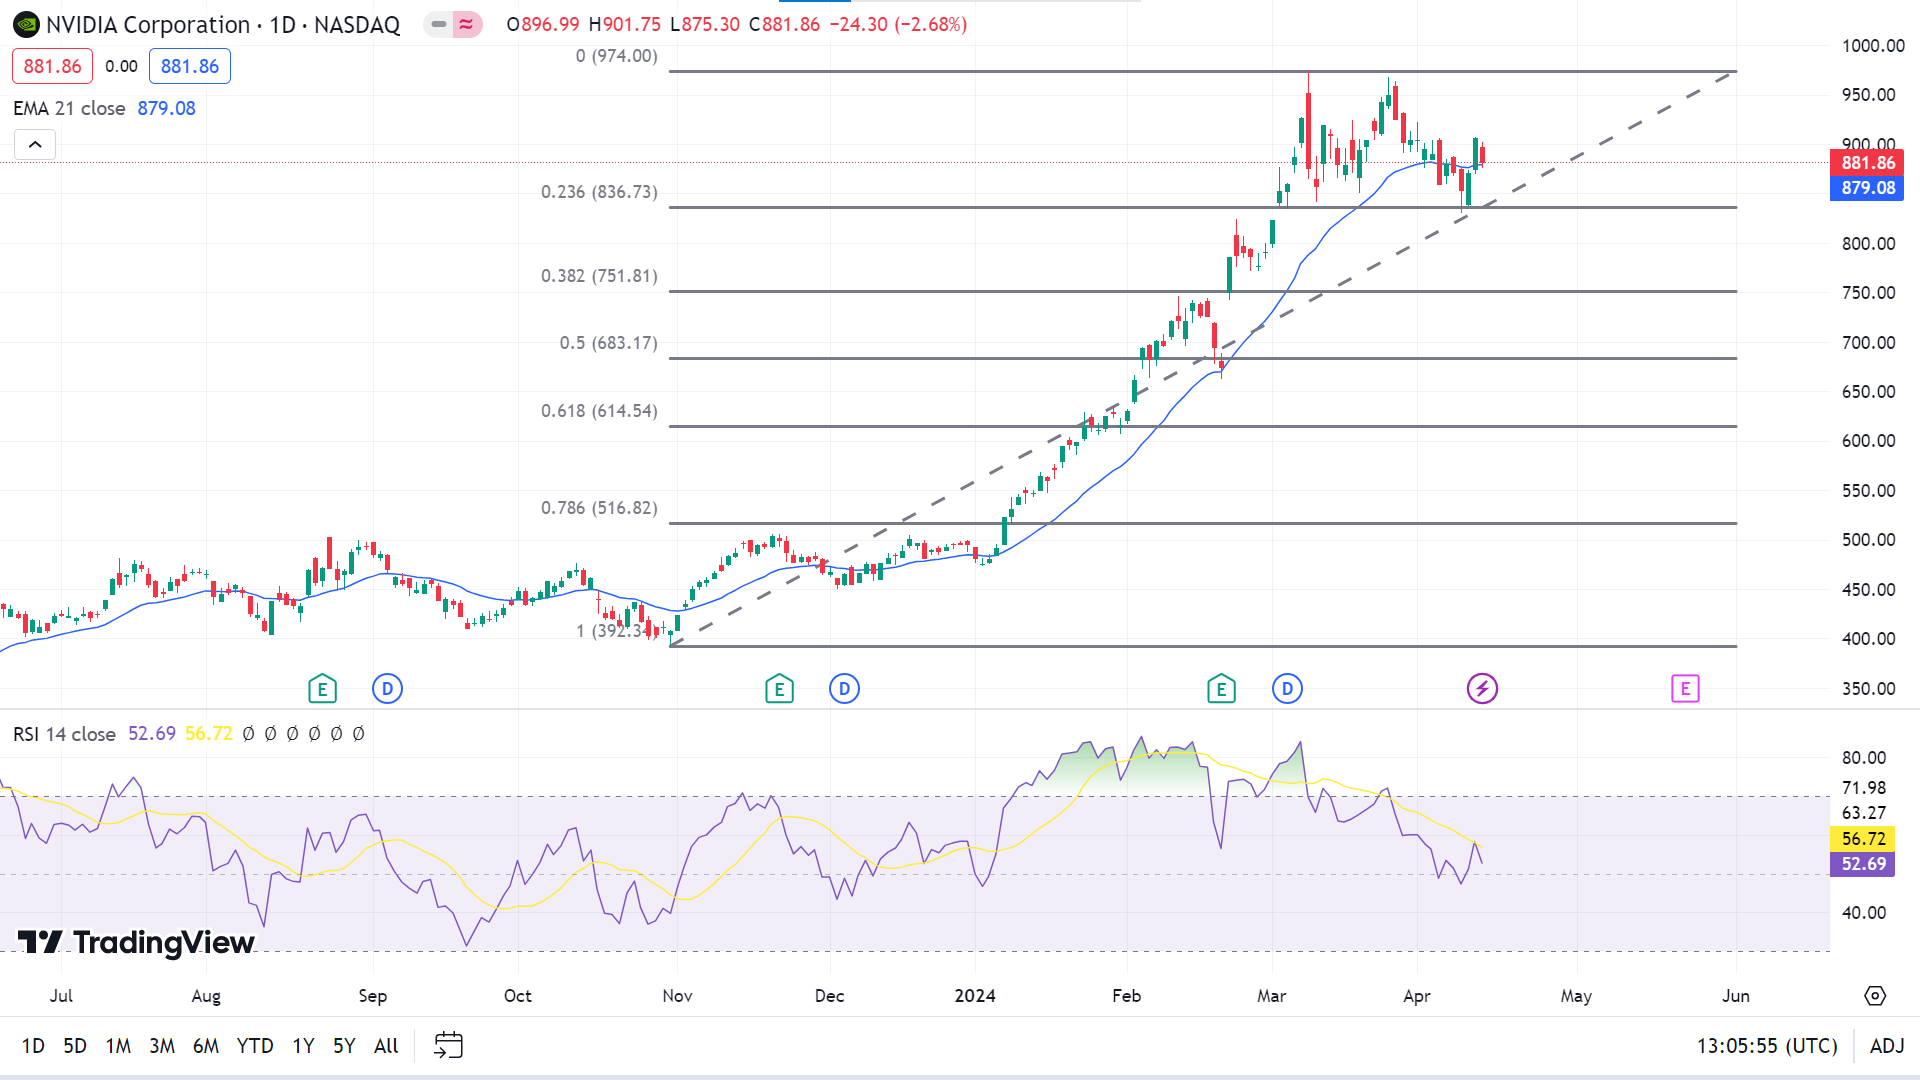
The daily chart of NVDA Stock shows the price reaches above the EMA 21 line, indicating the price may regain $974.00 and rally above that resistance level.
On the other, the RSI indicator window shows the price reaches a neutral zone, but the last candle closes within the previous candle, indicating sellers can take a chance when the price reaches near $836.73. Meanwhile, a close below that level could open a window to the next support near $751.81.
Tesla Stock (TSLA)
Fundamental Perspective
Tesla Inc. has unveiled a significant reduction in the price of its Full Self-Driving (FSD) subscriptions, slashing the monthly fee from $199 to $99 in the United States. This strategic decision follows a survey conducted by Teslike, which indicated that the $99/month option resonated most strongly with potential subscribers.
In Canada, Tesla extends the same pricing model, offering the FSD feature for C$99 per month. This shift to a subscription-based model provides users with a more flexible alternative, allowing access to the FSD feature without the need for an upfront payment. Subscribers can engage with the FSD feature under supervision, as Tesla continues to achieve full self-driving capability, pending regulatory approval.
This decision reflects Tesla's commitment to democratizing advanced automotive technology and accelerating the adoption of autonomous driving features. By making FSD more affordable and accessible, Tesla aims to enhance the driving experience for its customers and pave the way for a future of safer, more efficient transportation.
Technical Perspective
The weekly chart of TSLA stock shows the price remained in a consolidation phase after being in a downtrend for several weeks, indicating an indecision.
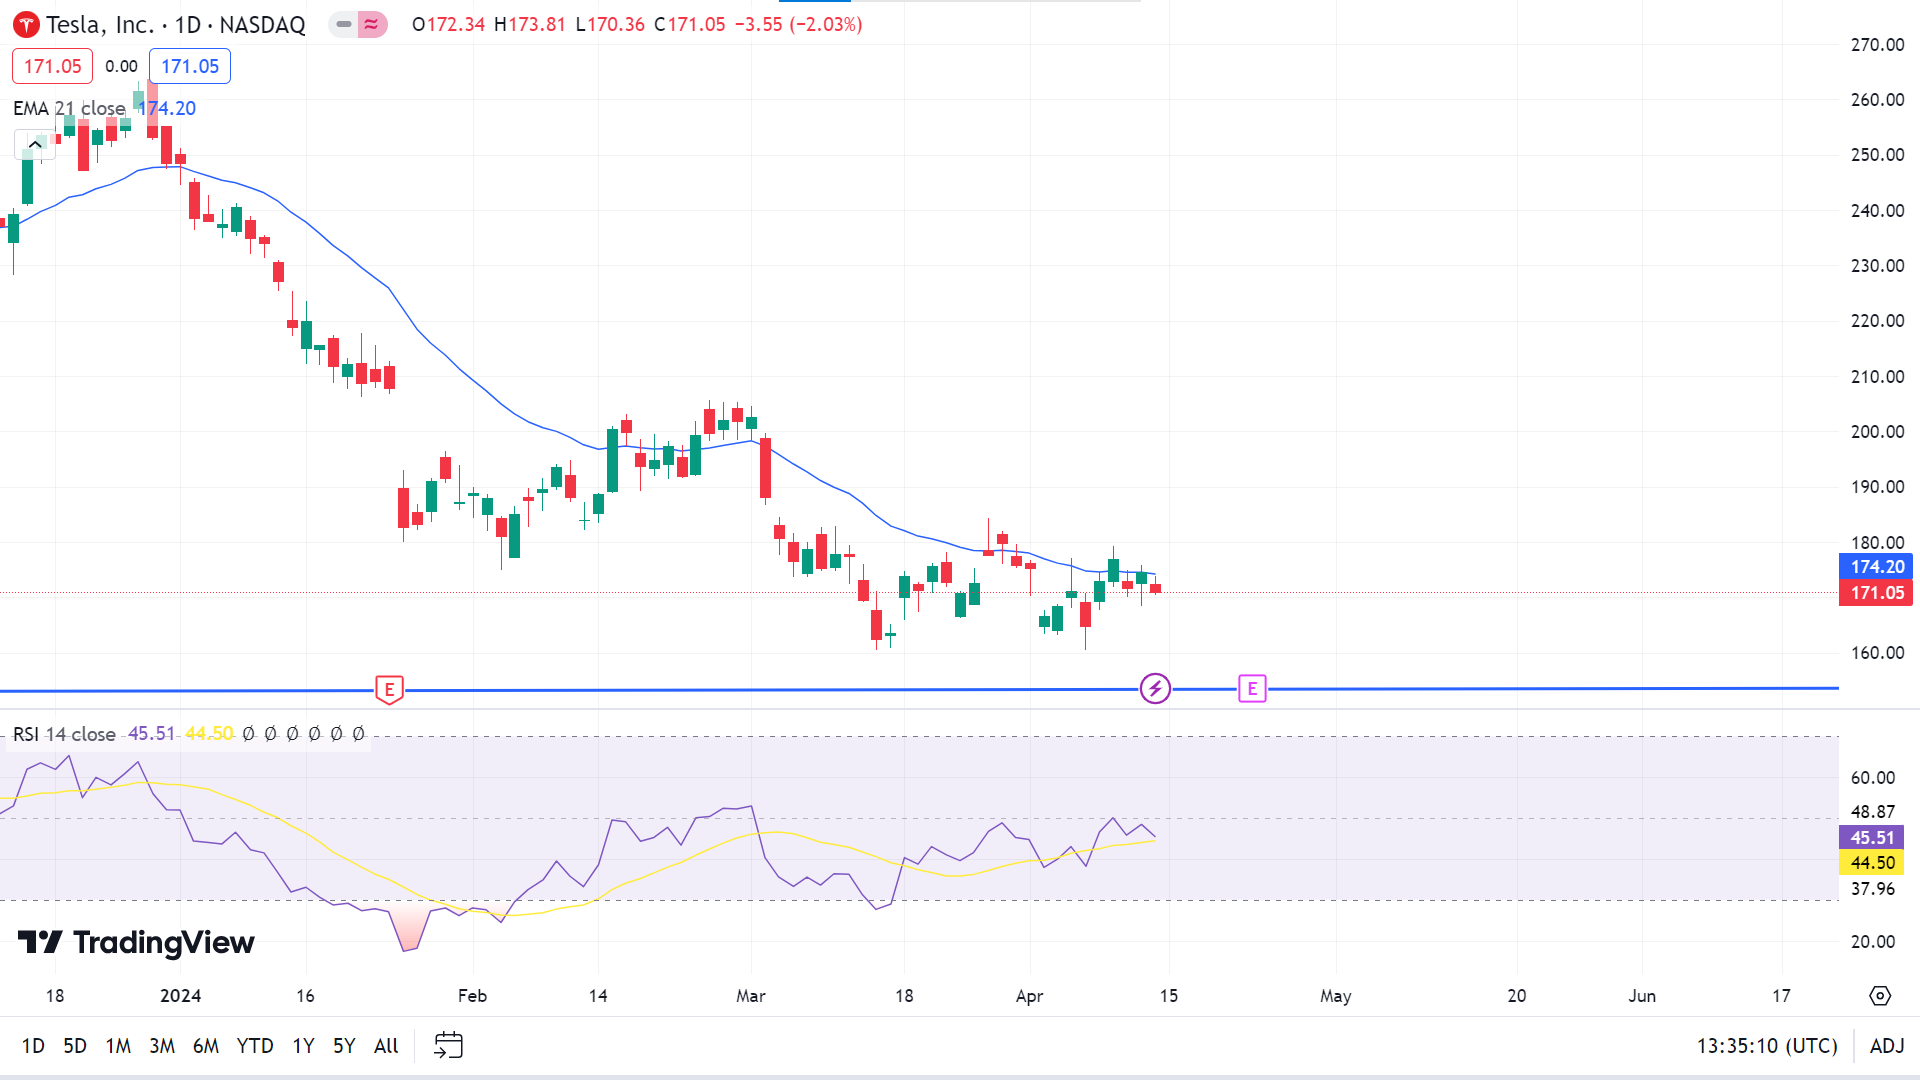
The daily chart shows the price facing resistance after reaching the EMA 21 line; it can reach the primary support near 101.81, followed by the next support near $61.50.
However, the RSI indicator shows the price remains near a neutral territory, so a close above $182.50 can trigger the price to reach the resistance near $205.60.
Gold (XAUUSD)
Fundamental Perspective
Gold began the week with a bullish trend, maintaining its upward trajectory through the initial two trading days. However, as investors awaited crucial inflation data from the US, trading activity for XAU/USD remained relatively subdued.
On Wednesday, the US Bureau of Labor Statistics (BLS) reported a notable increase in annual inflation, with the Consumer Price Index (CPI) rising to 3.5% in March, surpassing the previous month's 3.2%. Both the CPI and core CPI, excluding volatile food and energy prices, saw a monthly uptick of 0.4%, exceeding market expectations. This announcement triggered a surge in the benchmark 10-year US Treasury bond yield and pushed the USD Index to a five-month high above 105.00, prompting a corrective decline in Gold prices.
Market sentiment swiftly shifted as the likelihood of the Federal Reserve (Fed) maintaining the policy rate in June surged to nearly 80%, leading to a nearly 1% decline in XAUUSD on Wednesday, marking its second consecutive daily loss in the past two weeks.
Despite ongoing USD strength on Thursday, escalating geopolitical tensions provided a boost for Gold, with Iran's pledge of retaliation against Israel amplifying fears of a deepening conflict in the Middle East.
As the European Central Bank (ECB) kept its key rates unchanged at the after-April policy meeting, investors turned their attention to geopolitical developments, with a potential de-escalation in the Middle East conflict posing a risk to Gold's bullish trajectory.
Conversely, sustained risk aversion could lend support to XAUUSD, notwithstanding USD strength driven by growing expectations for a delay in Fed policy adjustments.
Technical Perspective
The weekly candle closed with a small green body and long upper weeks after two consecutive positive weeks, signaling that the next candle will possibly be positive.

The daily chart shows the price retrace back after reaching an all-time high near $2431.59. Many technical indicators, including EMA 20, EMA 50, EMA 100, EMA 200, MACD, and ADX, indicate positive pressure on the asset price. So it may regain its peak of $2431.59 to reach an anticipated level of $2500 in the upcoming days.
Meanwhile, the RSI shows the price remains overbought, indicating the price can reach the primary support near $2326.90, following the next support near $2262.13.
WTI Crude Oil(USOUSD)
Fundamental Perspective
Oil prices are rebounding on Friday, recovering from a slight 0.75% dip experienced on Thursday. This resurgence coincides with a broader rally in commodities, driven by escalating geopolitical tensions. Notably, this upward trend persists despite the US Dollar's continuous climb for the fourth consecutive day this week.
Meanwhile, the International Energy Agency (IEA) has revised its oil demand projections for both the current year and the next as negative, citing a sluggish economic outlook and the expanding market presence of electric vehicles. Anticipating subdued growth in 2025, the IEA's forecast highlights the evolving landscape of energy consumption.
At the same time, the US Dollar Index (DXY) is charting a notable 1.8% surge, propelled by mounting expectations of a widening interest-rate gap between the Federal Reserve (Fed) and other global central banks. This divergence underscores the differing monetary policies across economies, with some central banks contemplating rate cuts while others, exemplified by the robust US economic indicators, remain poised to hold steady. This disparity positions the US at the forefront of economies where current conditions warrant no immediate need for rate cuts.
Technical Perspective
The weekly candle closed below the opening price after four consecutive green weeks, suggesting the next candle can be another green candle.
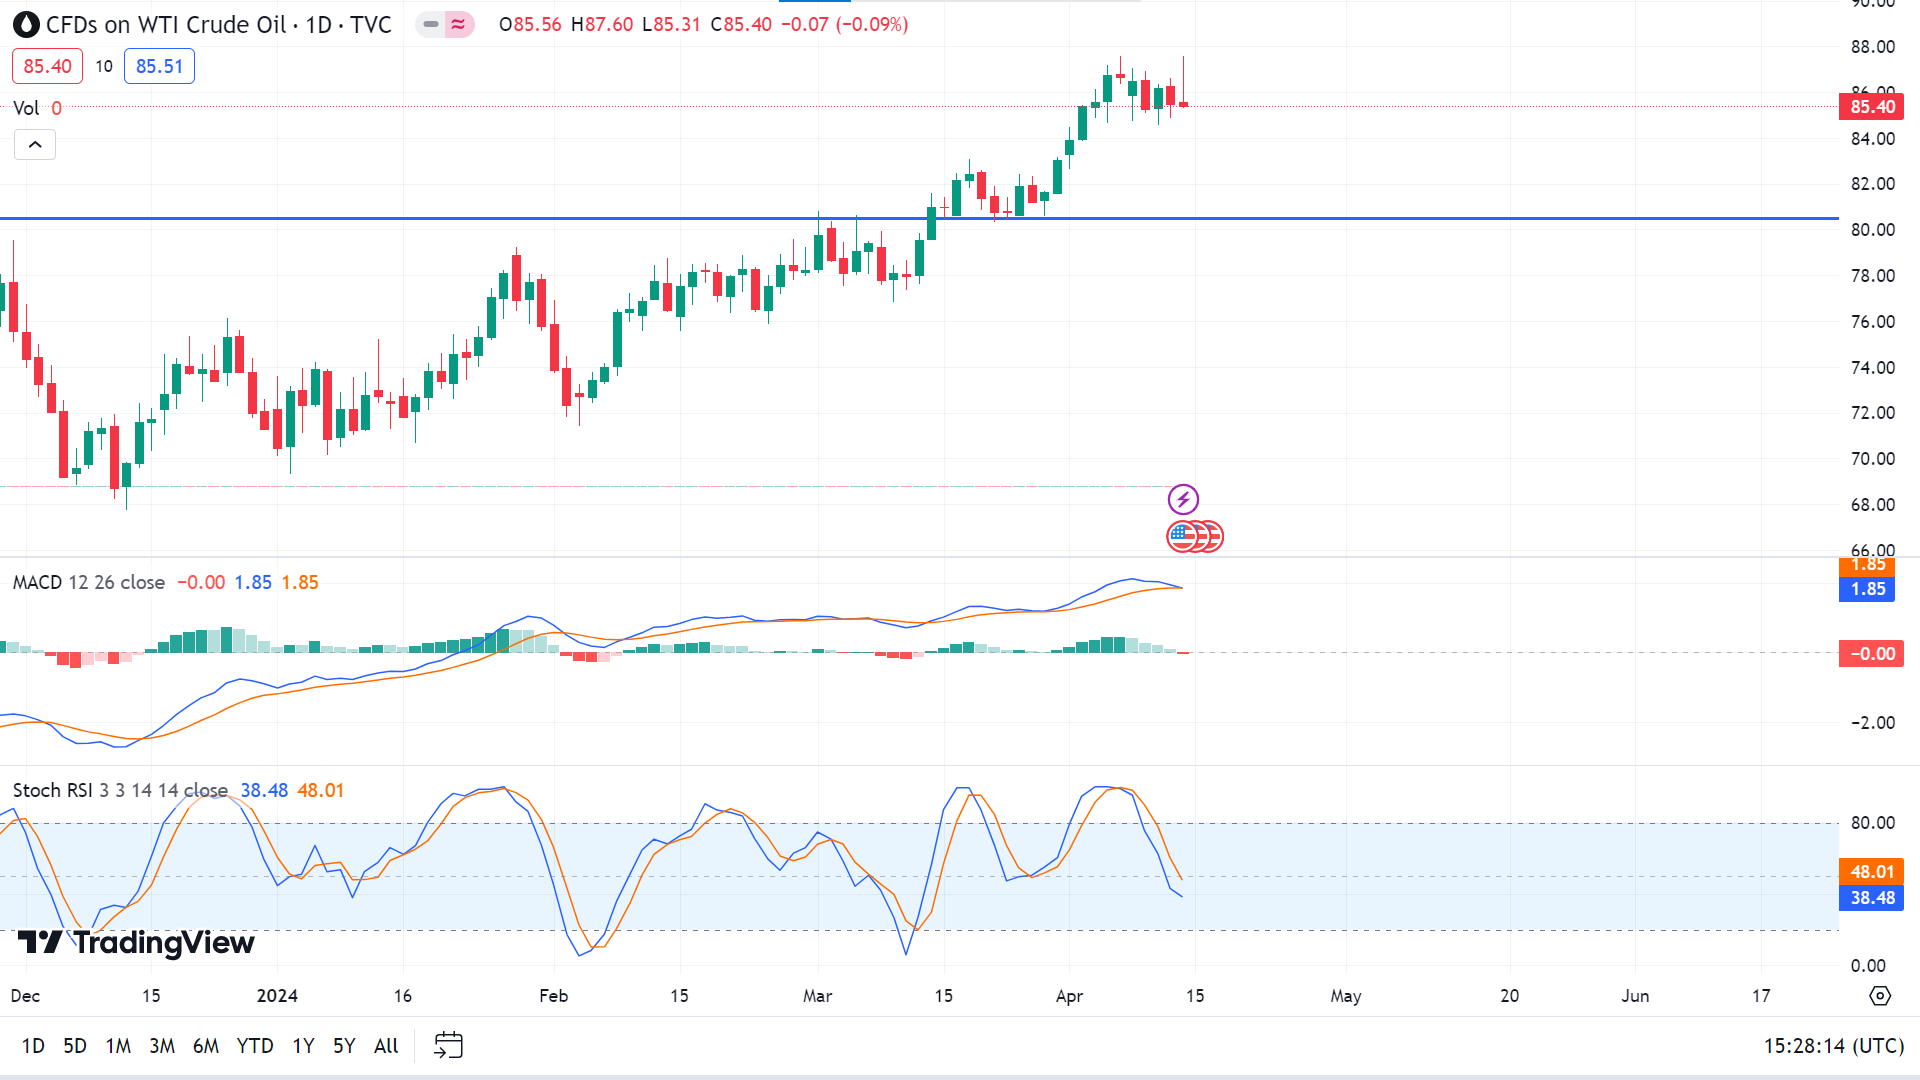
Many technical indicators, including MACD, RSI, ADX, EMA 100, and EMA 200, suggest that buy pressure remains intact on the asset price in the daily chart. So, the price may regain to the recent top near $87.60. A breakout of this level could trigger the price to reach the Sep 2023 peak near $94.99.
Meanwhile, the Stochastic RSI indicator shows the price remains at a neutral level. So the price can retrace back to the solid support level near $80.50 in the upcoming days.


