


EURUSD
Fundamental Perspective
Despite the Euro slipping to five-month lows against the US Dollar (USD) and hitting a crucial support level at 1.0600, EURUSD managed to stage a recovery following a dull start to the week.
Throughout the week, investors remained fixated on the divergence in monetary policies between the Federal Reserve (Fed) and the European Central Bank (ECB). The Fed adopted a cautiously hawkish stance, hinting at a potential interest rate cut later in the year in response to robust domestic fundamentals. However, policymakers remained wary of rising US inflation, opting for a gradual approach. Market indicators, including the CME Group’s FedWatch Tool, pointed towards mounting expectations of a Fed rate cut, particularly in September and December.
In contrast, ECB officials underscored the possibility of a rate cut in the summer, aiming to tackle subdued inflation within the Eurozone. Despite this, they urged against premature speculation on future rate adjustments, citing differing inflation dynamics between Europe and the US. ECB President Christine Lagarde echoed this sentiment, expressing readiness to lower rates if economic conditions warranted it while emphasizing ongoing efforts to rein in inflationary pressures within the Eurozone.
The comparative weakness of European economic fundamentals relative to the US bolstered expectations of a stronger Dollar in the short to medium term, especially with the potential for ECB rate cuts preceding those of the Fed. Consequently, EUR/USD was expected to face continued downward pressure shortly.
Technical Perspective
The weekly EURUSD candle closed with a small green body with wicks on both sides, whereas the previous candle was solid red, indicating the next candle may be a red one.
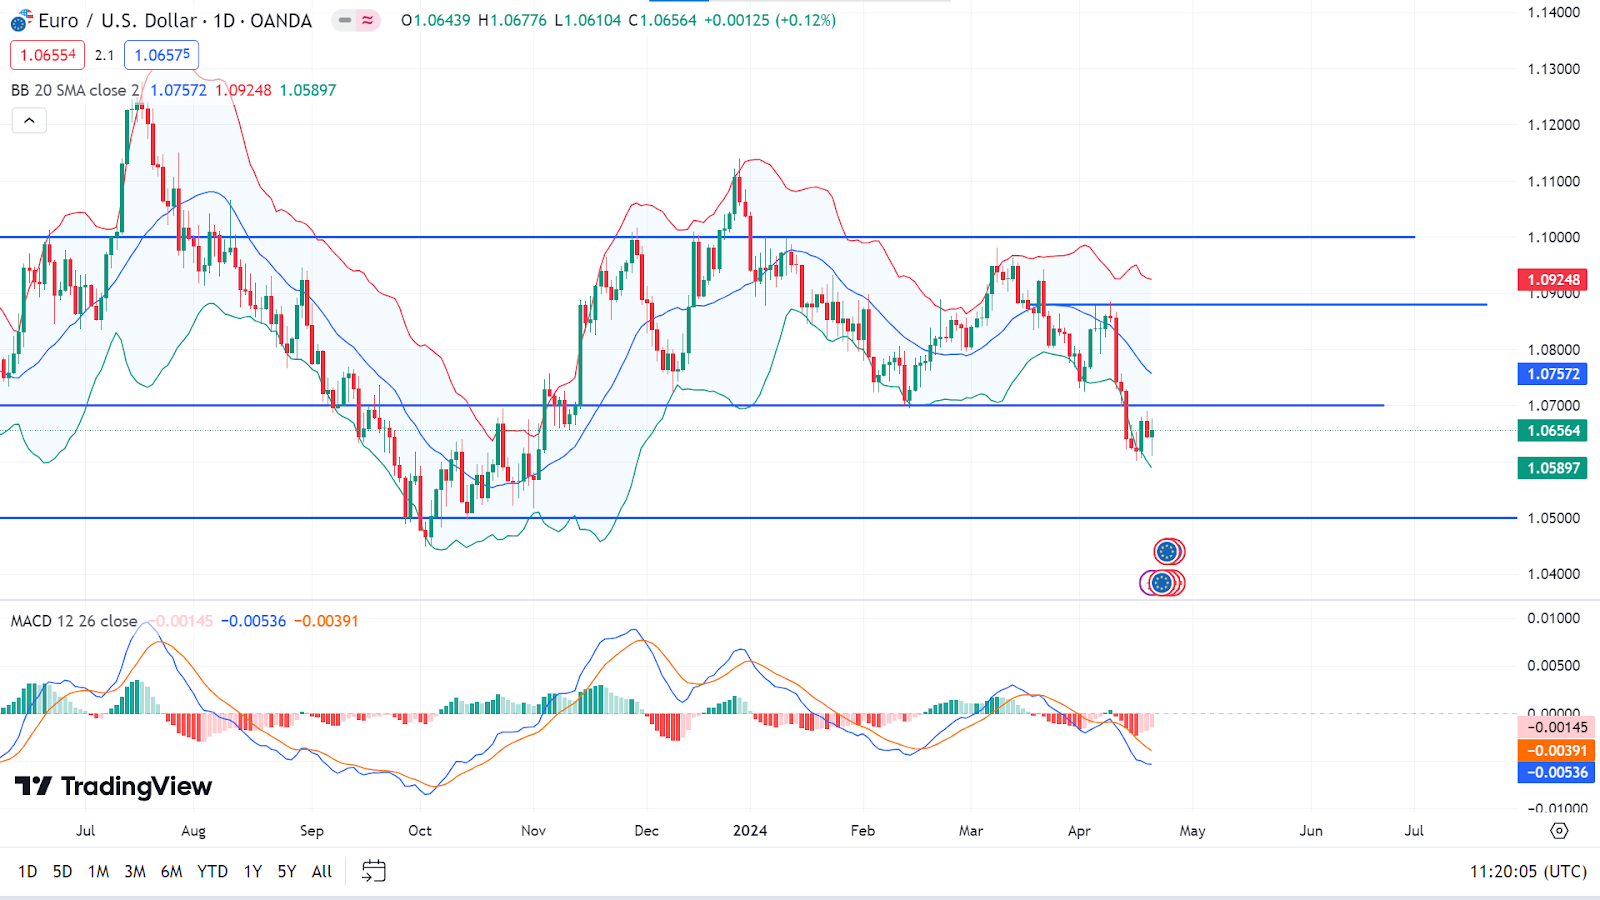
The daily chart shows the price bouncing back from the lower band of the BB indicator, indicating it may touch the primary resistance of 1.0750. A breakout can trigger the price to reach the next support near 1.0880.
On the other hand, the MACD indicator suggests the price remains in bearish territory, so it may continue to drop to 1.0500 support in the upcoming days.
GBPJPY
Fundamental Perspective
Following this week's upbeat job data and inflation figures exceeding forecasts, the market has fully priced in a 25 basis points rate cut for September by the Bank of England (BoE). Despite recent improvements in the Eurozone and UK economies, as indicated by their PMI numbers, inflation appears to align with the ECB and BoE targets. Consequently, even if these releases surprise positively, expectations regarding central bank actions are unlikely to shift dramatically, tempering any potential resurgence for the euro and pound against the US dollar.
Turning to the upcoming Bank of Japan (BoJ) decision, anticipation mounts following the recent cessation of negative interest rates and the abandonment of the yield curve control policy. Despite assurances from Governor Ueda about maintaining accommodative policy conditions, the yen has continued to depreciate, prompting concerns about intervention from Japanese officials. Governor Ueda's remarks dismissing direct responses to currency movements suggest a cautious approach, albeit with a nod towards potential future rate hikes if inflation accelerates further.
Investor focus now fixates on indications of a potential summertime rate hike, especially given inflationary upticks since the BoJ's last meeting. Further dovish sentiments may exacerbate yen selling, heightening prospects for intervention as needed. The upcoming Tokyo CPI release holds sway over market sentiment and is poised to illuminate inflationary trends preceding the meeting.
Technical Perspective
The weekly candle of GBPJPY closed as an inverted hammer with a small green body, whereas the previous candle was also an inverted hammer with a red body, indicating asset may lose bull power and may the next candle will be a red one.
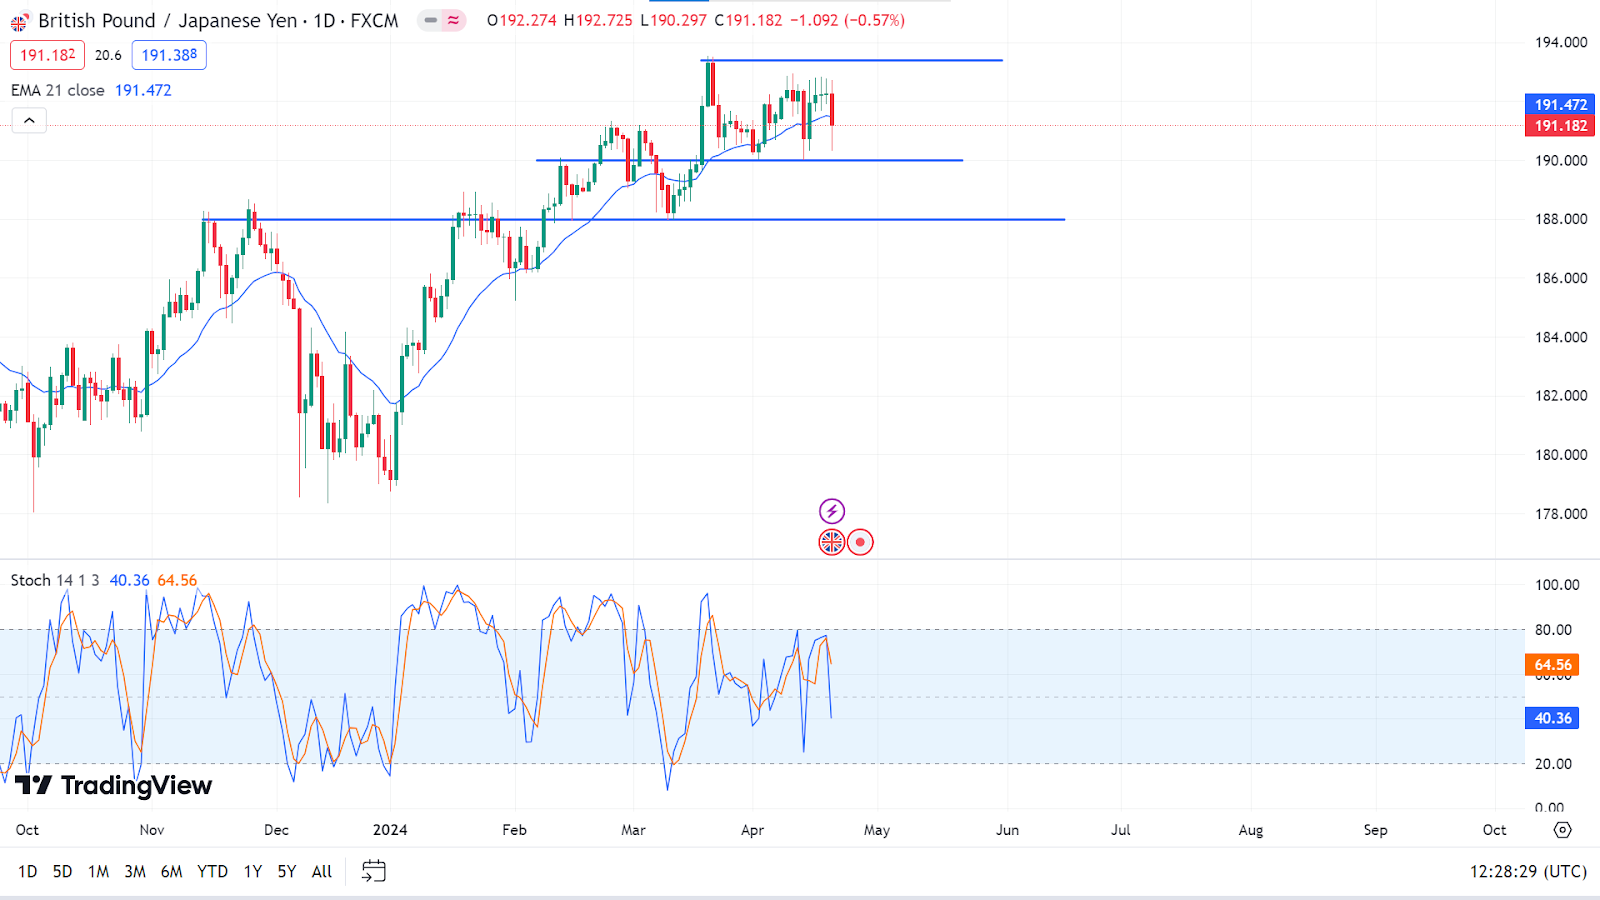
On the daily chart, the Stochastic indicator suggests the price can move upward from this level to the recent resistance near 193.40, following the next resistance of 195.00.
Meanwhile, the EMA 5, EMA 10, EMA 20, and ADX indicators suggest selling pressure here. So the price may reach near the current support at 190.00. Any break below that level can trigger the price to reach the next support level, near 188.00.
Nasdaq 100 Index (NAS100)
Fundamental Perspective
Today, chip stocks face downward pressure amid concerns over demand, spurred by Taiwan Semiconductor Manufacturing Co's downward revision of its 2024 semiconductor market growth expectations. This occurs against a backdrop of escalating tensions in the Middle East, following reported retaliatory strikes by Israel on Iran in response to recent missile and drone attacks. Despite Israel's strikes being limited to military targets in Syria and Iran, an Iranian military official has sought to play down the seriousness of the incidents.
Conversely, Paramount Global's stock value surged by over 8%, buoyed by reports indicating potential joint acquisition interest from Apollo Global Management and Sony Group. Additionally, American Express's Q1 adjusted EPS exceeded consensus expectations, causing an increase of over 4%. Similarly, Fifth Third Bank registered a gain of over 5% following its Q1 net interest income report, which surpassed expectations.
Looking ahead, market sentiment suggests diminishing probabilities of a 25-basis-point rate cut, with estimates at 3% for the upcoming FOMC meeting on April 30 - May 1 and 19% for the subsequent June 11-12 meeting.
Technical Perspective
The weekly candle Nasdaq 100 (NDX) finished as a large solid red candle after several weeks of consolidation, indicating seller domination on the asset price, so the next candle can be another red candle.
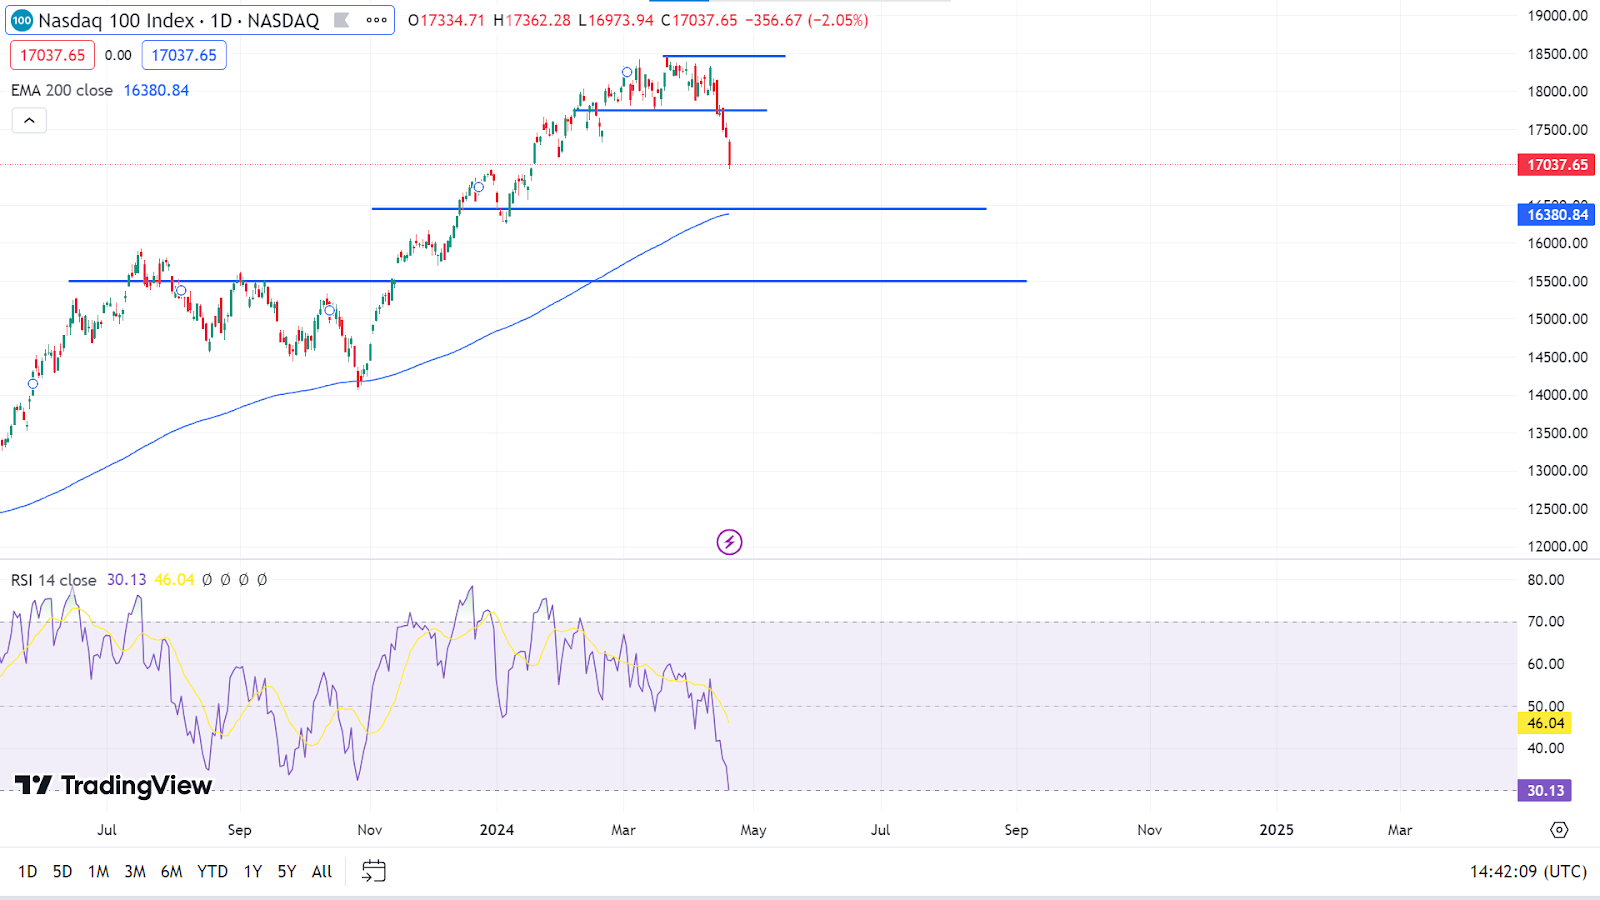
On the daily chart, the price is declining after reaching ATH near 18,464.70. The RSI indicator alongside the EMA 10, EMA 20, EMA 50, and EMA 100 lines indicate significant bearish pressure on the asset price, so it may reach the primary support near 16,450.00, following the next support near 15500.00.
However, on the upside, the primary resistance level is near 17,750.00 as EMA 200 suggests still buy pressure on the asset price, and RSI (14) suggests the price is oversold.
S&P 500 (SPX500)
Fundamental Perspective
The S&P 500 faced a notable decline throughout the trading week, dipping below the critical 5000 level by the Friday session, a symbolic marker of significant importance. However, amidst this downturn, a ray of optimism emerged with a subsequent recovery, representing a necessary correction following an 8% drop over recent tumultuous weeks.
Amidst this backdrop, the market navigates earnings season, anticipating potential volatility. Additionally, expectations of prolonged Federal Reserve tightening add to the prevailing cautious sentiment, which has persisted throughout the year. Geopolitical tensions, particularly in the Middle East, remain a looming concern.
Nevertheless, beneath the surface challenges, the market's underlying upward momentum endures, capturing the interest of astute investors on the lookout for promising opportunities. Despite lingering caution, especially regarding unpredictable weekend developments, the resurgence of value-seeking behavior suggests a resurgence of confidence. Additionally, the temporary absence of major macroeconomic data offers a brief respite from ongoing market turbulence, potentially fostering a sense of stability.
Despite recent setbacks, the fundamental uptrend remains intact, fostering optimism that the current juncture may present favorable entry points for market participants.
Technical Perspective
The weekly chart of the S&P 500 (SPX) posted three consecutive declining candles showing seller domination on the asset price, so the next candle will be another bearish one.
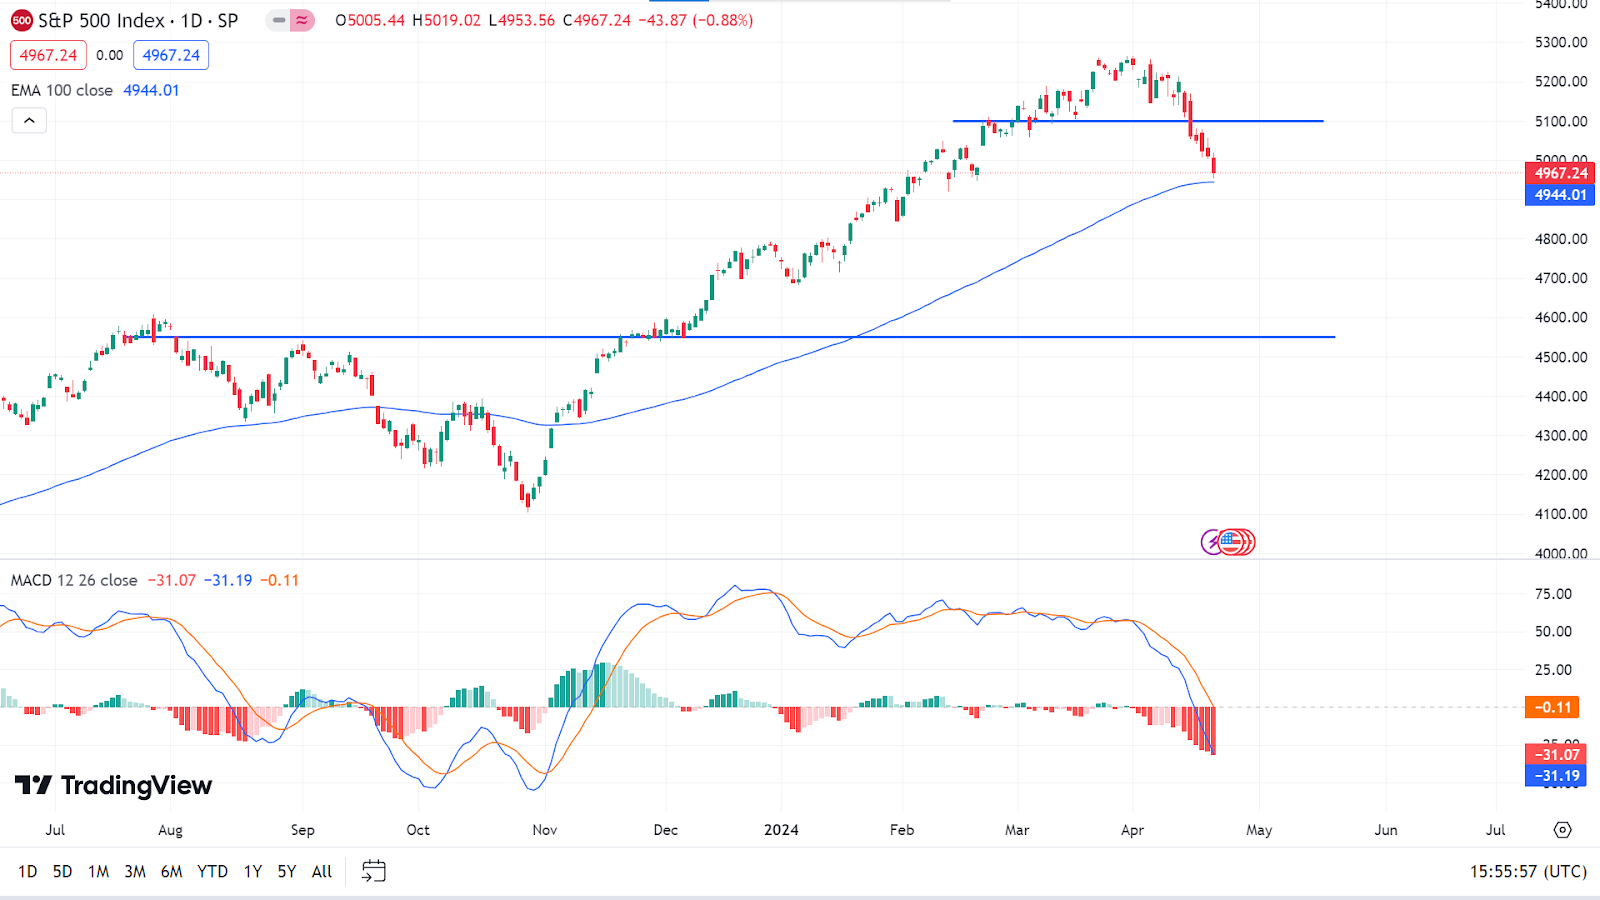
The daily chart confirms significant sellers are on the play. The asset price can reach the recent resistance near 5100.00 and break above the ATH near 5208.34 as the price reaches the EMA 100 line, which can be a well-supported level.
However, the MACD window declares significant bearish pressure, so the price can reach the next support near 4720.00 (EMA 200), following the next support near 4607.07, which was high in 2023.
Bitcoin (BTCUSD)
Fundamental Perspective
Bitcoin, the leading cryptocurrency globally, recently underwent its scheduled "halving," occurring approximately every four years, according to CoinGecko, a reputable cryptocurrency data and analysis company. Following this milestone, Bitcoin maintained relative stability, experiencing a marginal 0.47% decline to $63,747.
The "halving" represents a significant adjustment in Bitcoin's foundational technology to slow the creation rate of new bitcoins. Satoshi Nakamoto, the pseudonymous creator of Bitcoin, embedded this feature into the protocol from its inception. Chris Gannatti, WisdomTree's global head of research, underscored the event's importance, deeming it "one of the year's most pivotal events in crypto."
For Bitcoin advocates, the halving underscores its value as an increasingly scarce asset, with Nakamoto setting a maximum limit of 21 million tokens. Conversely, skeptics view it primarily as a technical adjustment speculators leverage to inflate the cryptocurrency's value.
The halving process diminishes rewards for cryptocurrency miners, making introducing new bitcoins into circulation costlier. This occurrence follows Bitcoin's ascent to an all-time peak of $73,803.25 in March, gradually rebounding from the tumultuous events of 2022. Currently, the cryptocurrency hovers around $63,800, buoyed by factors like the SEC's approval of spot bitcoin exchange-traded funds in January and expectations of central bank interest rate reductions.
Previous halvings occurred in 2012, 2016, and 2020, with some enthusiasts citing subsequent price rallies as potential indicators of appreciation. Nonetheless, many analysts remain skeptical about the halving's direct impact on Bitcoin's price trajectory.
Technical Perspective
The weekly chart shows the market has been digesting significant sell pressures to push below $60,000.00 but floating above $64,500.00 declaring bulls are still in play. So the next candle can be a green one.
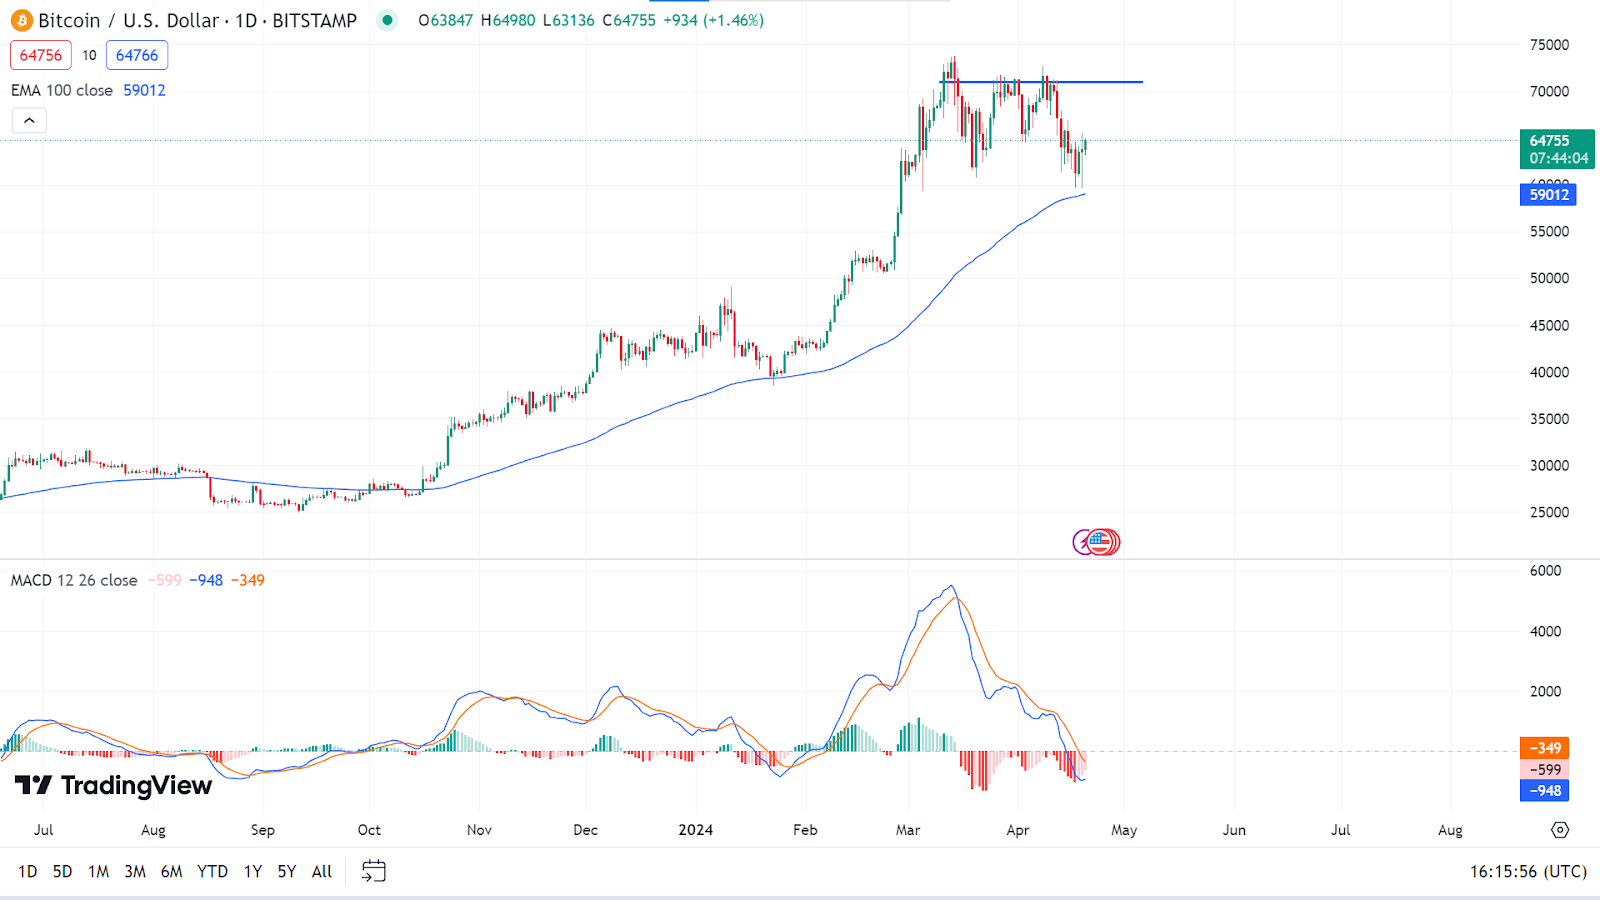
On the daily chart, the price touches the EMA 100 line and bounces back toward the primary resistance near $70,000.00. If bulls remain intact above that level, it can trigger the price toward $75,000.00.
Meanwhile, the MACD indicator shows the price can come back to the current support near $59, 750.00 or break below toward the next support of $55,000.00.
Ethereum (ETHUSD)
Fundamental Perspective
Ethereum (ETH), the world's second-largest cryptocurrency, is transcending its conventional role, exhibiting promising indicators such as robust buyback yields and a flourishing staking ecosystem, alongside potential price surges.
Ranked 16th in buyback yield by Token Terminal, Ethereum outshines industry titans like Tesla and JPMorgan Chase, signaling its allure as a lucrative investment avenue beyond transactional utility. Its youthful existence of nine years contrasts starkly with the average age of listed firms at 44 years, emphasizing the agility and profitability intrinsic to internet-native enterprises like Ethereum.
A recent surge in Ethereum's value followed a significant stake placed on the Beacon Chain by an anonymous investor, affirming confidence in its long-term value. P2P.org's introduction of an innovative staking solution, leveraging Distributed Validator Technology (DVT) and the SSV Network, underscores Ethereum's commitment to security and decentralization, offering an enticing annual percentage yield (APY) exceeding 5.6%.
Despite geopolitical tensions prompting a brief market downturn, Ethereum is rebounding alongside the broader crypto market, currently hovering around $3,100. Analysts interpret Ethereum's recent gas fee decrease as indicative of a potentially stabilizing market with reduced volatility, further bolstering its resilience and attractiveness to investors.
Technical Perspective
The weekly candle closes as a dragonfly doji, suggesting significant bullish pressure on the asset price, so the next candle can be a green one.
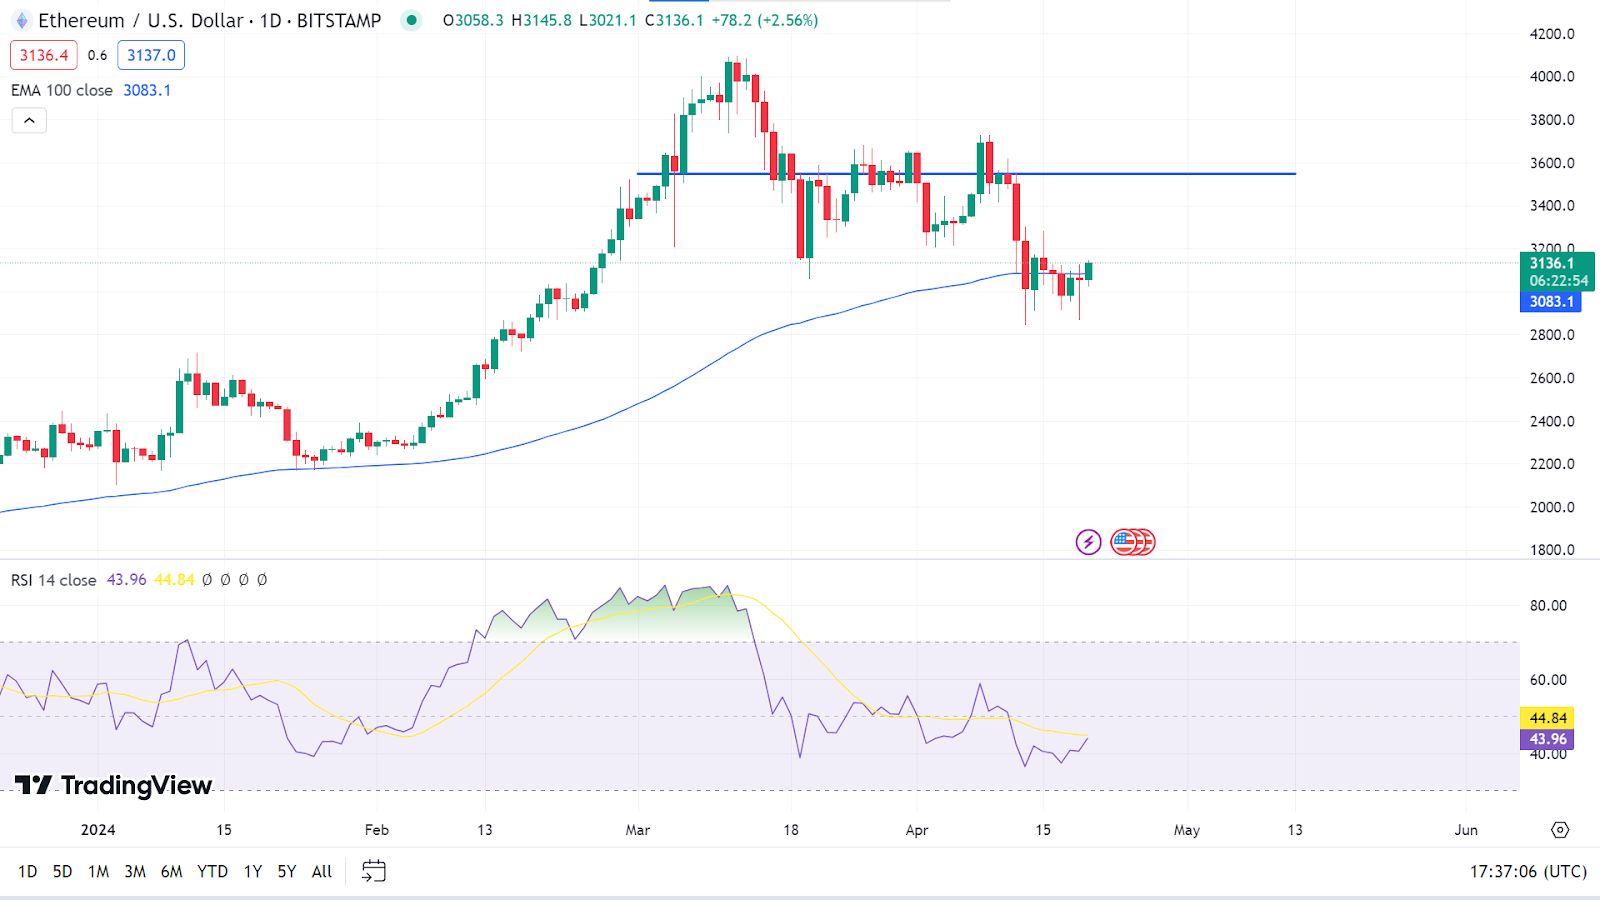
The price reaches above the EMA 100 line indicating bulls may take control of the price. So it can reach the current resistance near $3550.00 and if it remains above that level it can reach the ATH near $4095.40.
However, any close below $3000.00 may open the price to reach the next support near $2700.00 as the RSI indicator reading remains in the bearish territory.
Nvidia Stock (NVDA)
Fundamental Perspective
Amidst Nvidia's (NASDAQ: NVDA) continued market dominance, recent apprehensions suggest a potential shift. Friday's trading saw NVDA stock plummet by 6.5%, raising questions about impending monetary policy changes. However, the focal point may shift to the undervalued realm of artificial intelligence (AI).
Despite these developments, the spotlight remains on the Federal Reserve. Late last year, hopes were high for a dovish stance on monetary policy, with expectations of multiple rate cuts in 2024 and beyond, as reported by CNBC. Consequently, growth-focused investments like NVDA stock surged in the first quarter.
However, attention shifted to the resilience of the labor market as March witnessed the addition of 303,000 nonfarm payrolls, surpassing forecasts by over 100,000 jobs. This trend suggests heightened spending amid constrained goods, amplifying inflation concerns.
Furthermore, escalating geopolitical tensions in the Middle East amplify worries. Iran's retaliatory actions against Israel, following an attack on its embassy in Syria, have triggered concerns about potential disruptions to global oil supply chains. The surge in energy costs exacerbates inflationary pressures, providing little impetus for the Fed to consider rate cuts amidst such uncertainty.
NVDA Stock Technical Perspective
The weekly NVDA chart shows consecutive losing weeks and the last candle ended as a solid red, declaring seller domination on the asset price. So the next candle can be a red one.
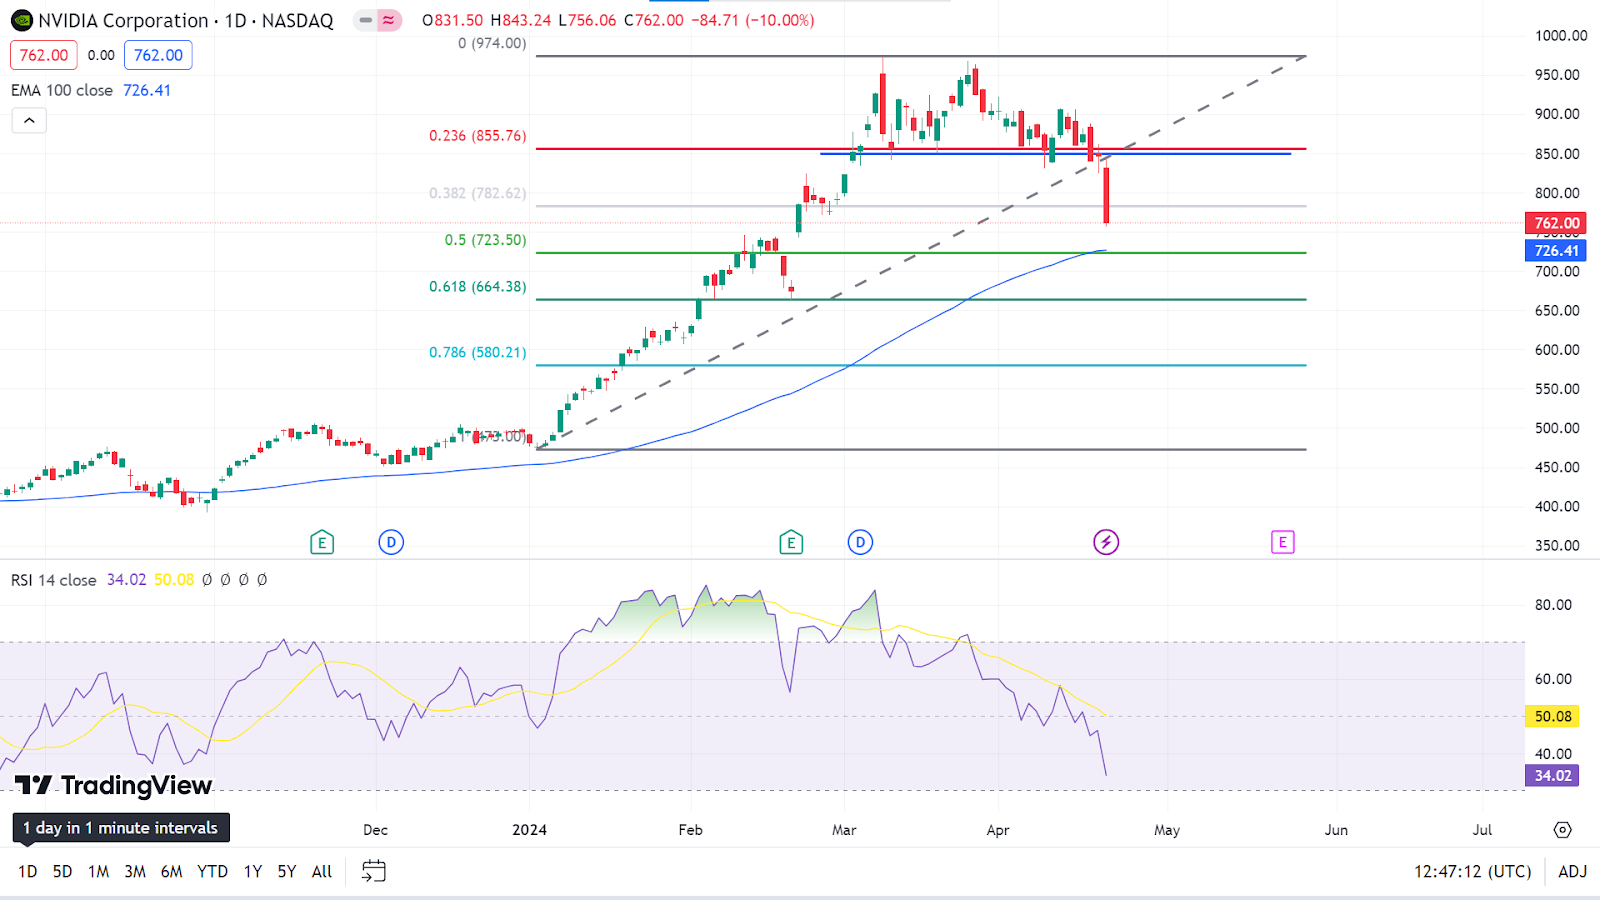
The daily chart shows the price reached an all-time high near $974.00, then heads down after some days of consolidation. The price remains above the EMA 100 and EMA 200 line, indicating buyers are active on the asset price. The price may reach the recent resistance near $850.00 and break toward $974.00.
On the other hand, RSI, MACD, and ADX indicators reveal bearish pressure on the asset price. The price may head toward the recent support of nearly $664.38, following the next support of $580.21.
Tesla Stock (TSLA)
Fundamental Perspective
Tesla (NASDAQ:TSLA) has introduced price reductions of up to $2,000 on several of its electric vehicle (EV) models in the United States, representing another strategic pivot amidst challenging market dynamics.
As reported by Electrek, this price adjustment applies to Tesla's Model Y, Model S, and Model X. Notably, prices for the Model 3 and the newly unveiled Cybertruck remain unchanged.
Despite Tesla's stock enduring further declines on Friday, now down over 40% year-to-date, the company aims to stimulate sales by reverting the price of its flagship Model Y to its lowest ever. This move follows disappointing delivery figures in the previous quarter and a notable surge in inventory levels, as outlined in the company's quarterly report.
These pricing adjustments unfold against a backdrop of considerable turbulence for Elon Musk's company, including a recent 10% workforce reduction and two senior executives' departure. Additionally, investor frustration mounts over Tesla's decision to defer plans for a more affordable $25,000 car.
In response to these developments, analysts have revisited their assessments of Tesla, with Deutsche Bank downgrading the rating to Hold.
TSLA Stock Technical Perspective
The weekly chart shows that TSLA posted a solid losing week, creating a solid red candle. The price remains on a downtrend, so it indicates that the next candle can be another red one.
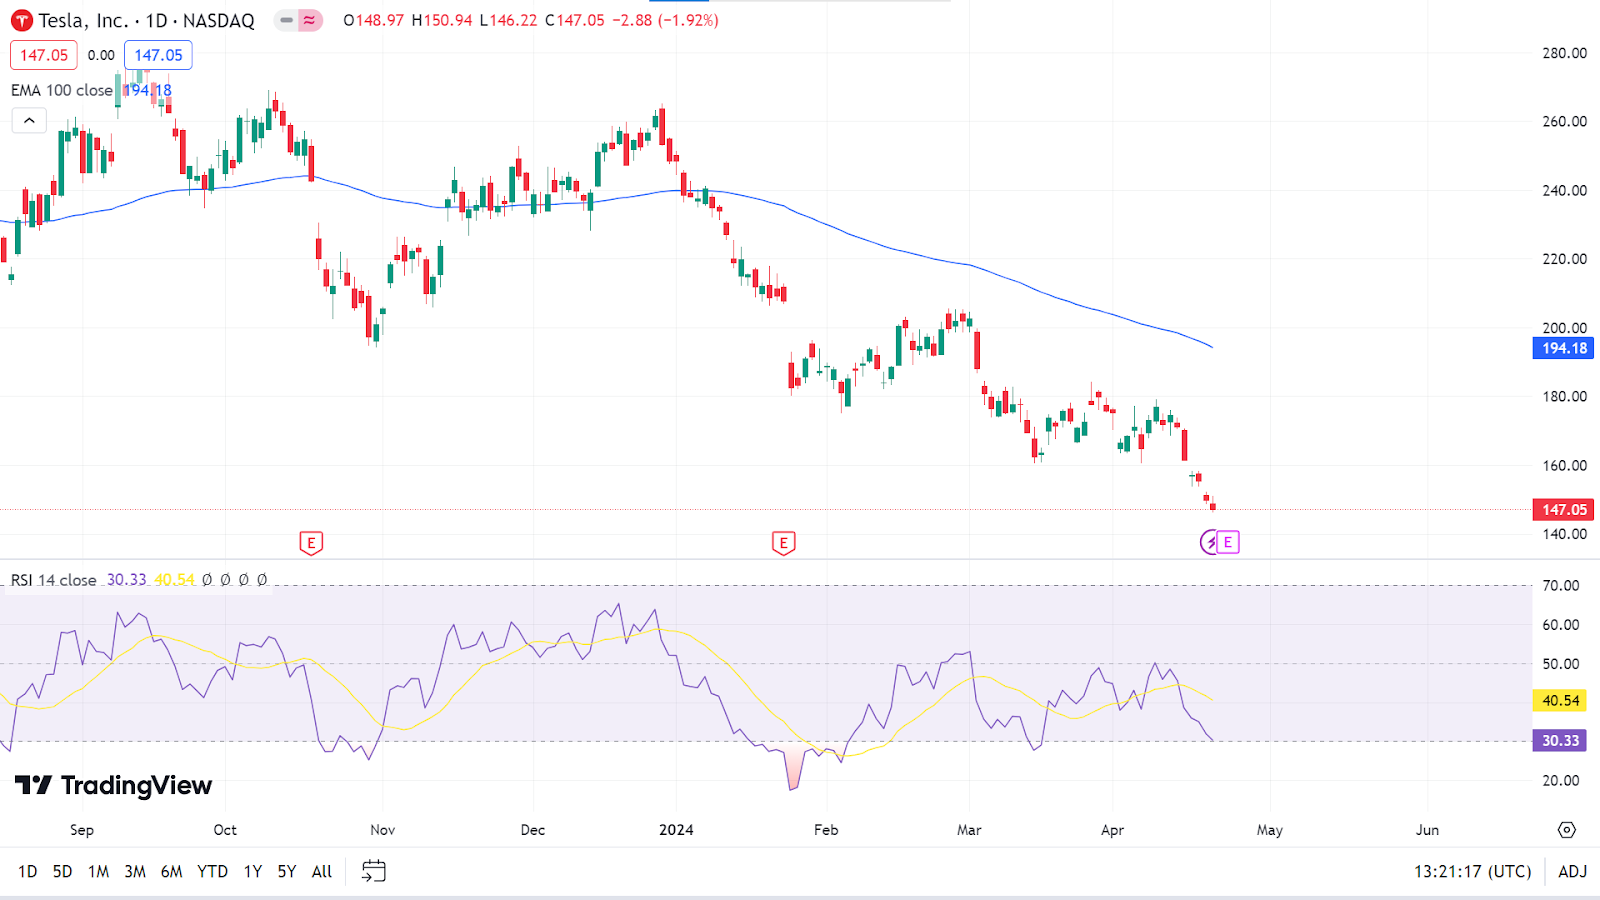
On the daily chart, the price is continuing in a bearish trend, and most indicator readings, including EMA 20, EMA 50, EMA 100, RSI, MACD, etc., show significant bearish pressure on the asset price. So, the price may reach the recent support near $101.81 or break below.
However, the price just broke below the former support of $152.37, the level can be validated and the price can recover toward $184.25 if buyers come back as stochastic RSI shows the price remains on an oversold level.
Gold (XAUUSD)
Fundamental Perspective
Gold (XAU/USD) witnessed restrained movement this week after its record-setting surge, with investors closely monitoring developments in the Iran-Israel conflict and upcoming macroeconomic indicators from the US.
The precious metal initially soared above $2,400 as tensions escalated between Iran and Israel following retaliatory strikes. However, improved market sentiment on Tuesday, driven by calls for de-escalation and hawkish remarks from Federal Reserve (Fed) officials, limited further gains. Fed Chairman Jerome Powell's cautious stance on inflation and San Francisco Fed President Mary Daly's emphasis on prudence tempered gold's momentum.
Despite a lack of significant data releases, gold experienced a downward correction midweek, closing in negative territory on Wednesday. A brief spike occurred on Friday following reports of Israeli strikes on Iran, but sentiments eased amid signs of de-escalation, causing gold to retract below $2,400.
The market focus remains on geopolitical developments, with a potential de-escalation likely to prompt a correction in XAU/USD. However, another retaliatory response by Iran could sustain safe-haven demand. Additionally, the forthcoming US data releases, notably the Advanced Gross Domestic Product (GDP) and Personal Consumption Expenditures (PCE) Price Index, will be closely watched, as stronger-than-expected economic growth may bolster the US dollar and exert downward pressure on gold prices.
Technical Perspective
The weekly chart shows that the XAUUSD pair remains on a solid upward trend, posting solid green candles, indicating the next candle can be another green one.
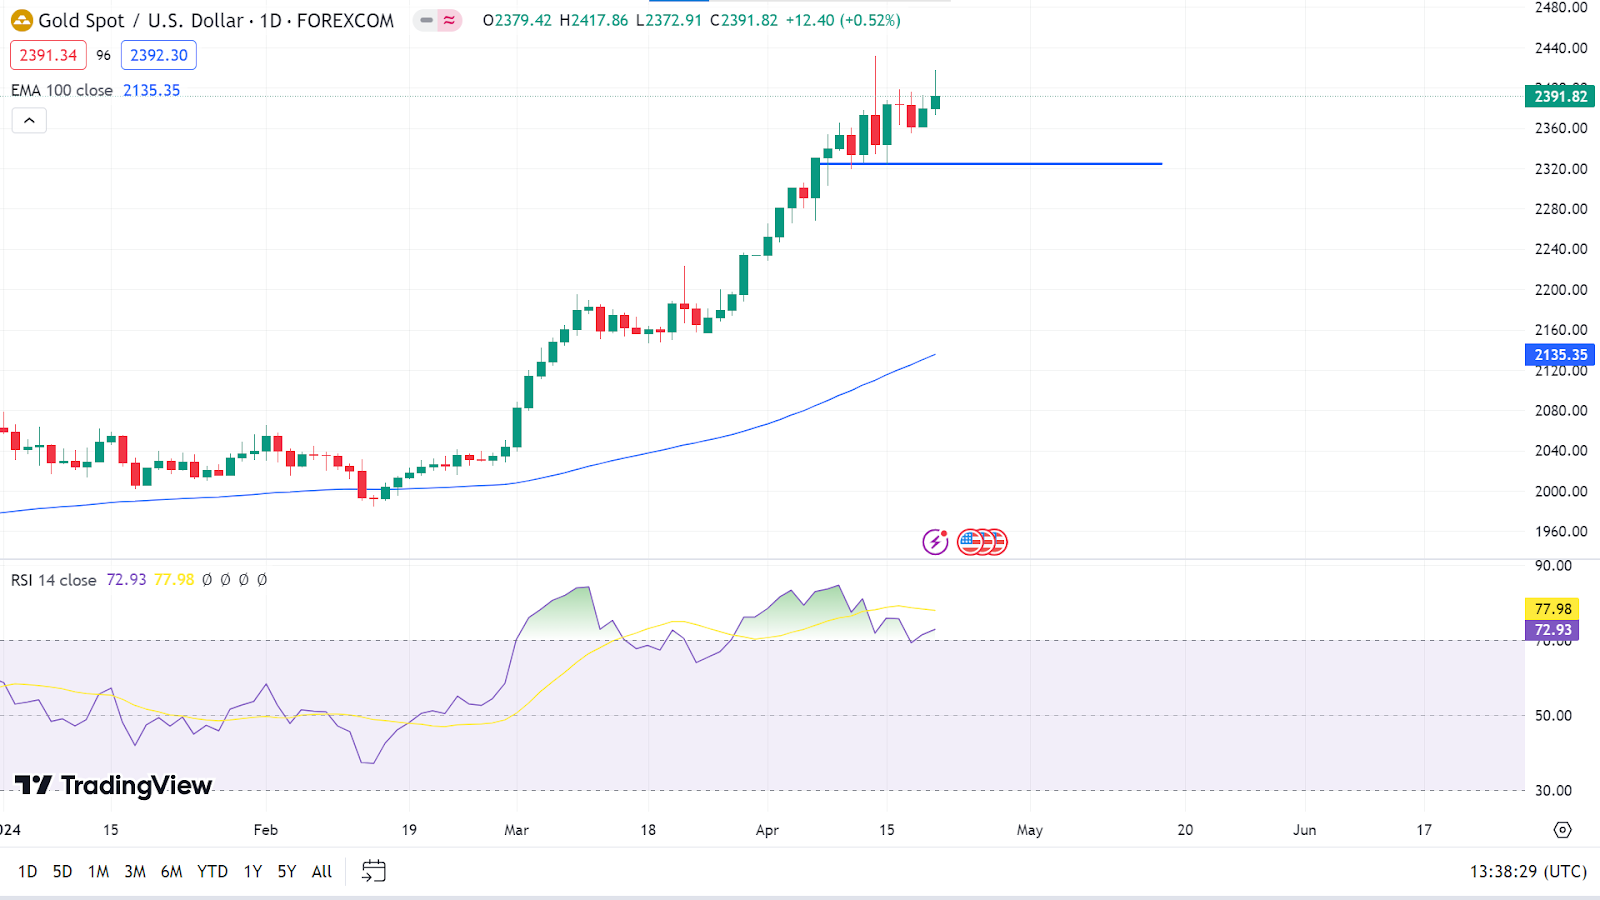
The readings of EMA 20, EMA 50, EMA 100, MACD, and ADX indicate the precious metal facing solid bullish pressure on the daily chart. So the price can reach $2500.00 in the upcoming days.
Meanwhile, the RSI and CCI indicator readings declare the price to remain neutral. So anytime the price can decline to the primary support near $2325.00. Any close below this level can trigger the price to ward the next support near $2275.00.
WTI Crude Oil (USOUSD)
Fundamental Perspective
Crude oil futures showed a mixed performance on Thursday after experiencing earlier declines in the week, as traders reassessed concerns over potential disruptions to crude supplies stemming from tensions between Israel and Iran. The West Texas Intermediate (WTI) contract for May delivery edged up by a marginal 4 cents, settling at $82.73 per barrel, while June Brent futures dipped by 18 cents to close at $87.11 per barrel. Although U.S. crude oil briefly touched a session high of $83.47, it later retraced.
Wednesday saw a notable drop in oil prices by over 3%, prompted by Israel’s restrained response to Iran's weekend air assault, which tempered fears of a significant conflict in the Middle East. Analysts also noted that the receding threat posed by Ukraine’s drone strikes on Russian oil infrastructure contributed to a decline in bullish sentiment.
Furthermore, while the Biden administration imposed new sanctions on Iran, it refrained from targeting the country's oil exports.
Additionally, a significant increase of 10 million barrels in U.S. petroleum inventories last week, as highlighted by strategist Giovanni Staunovo from UBS, also influenced oil prices during the week.
Technical Perspective
The weekly candle for Crude Oil finished solid red after a doji declaring seller domination on the asset price, so no wonder the next candle can be another red one.
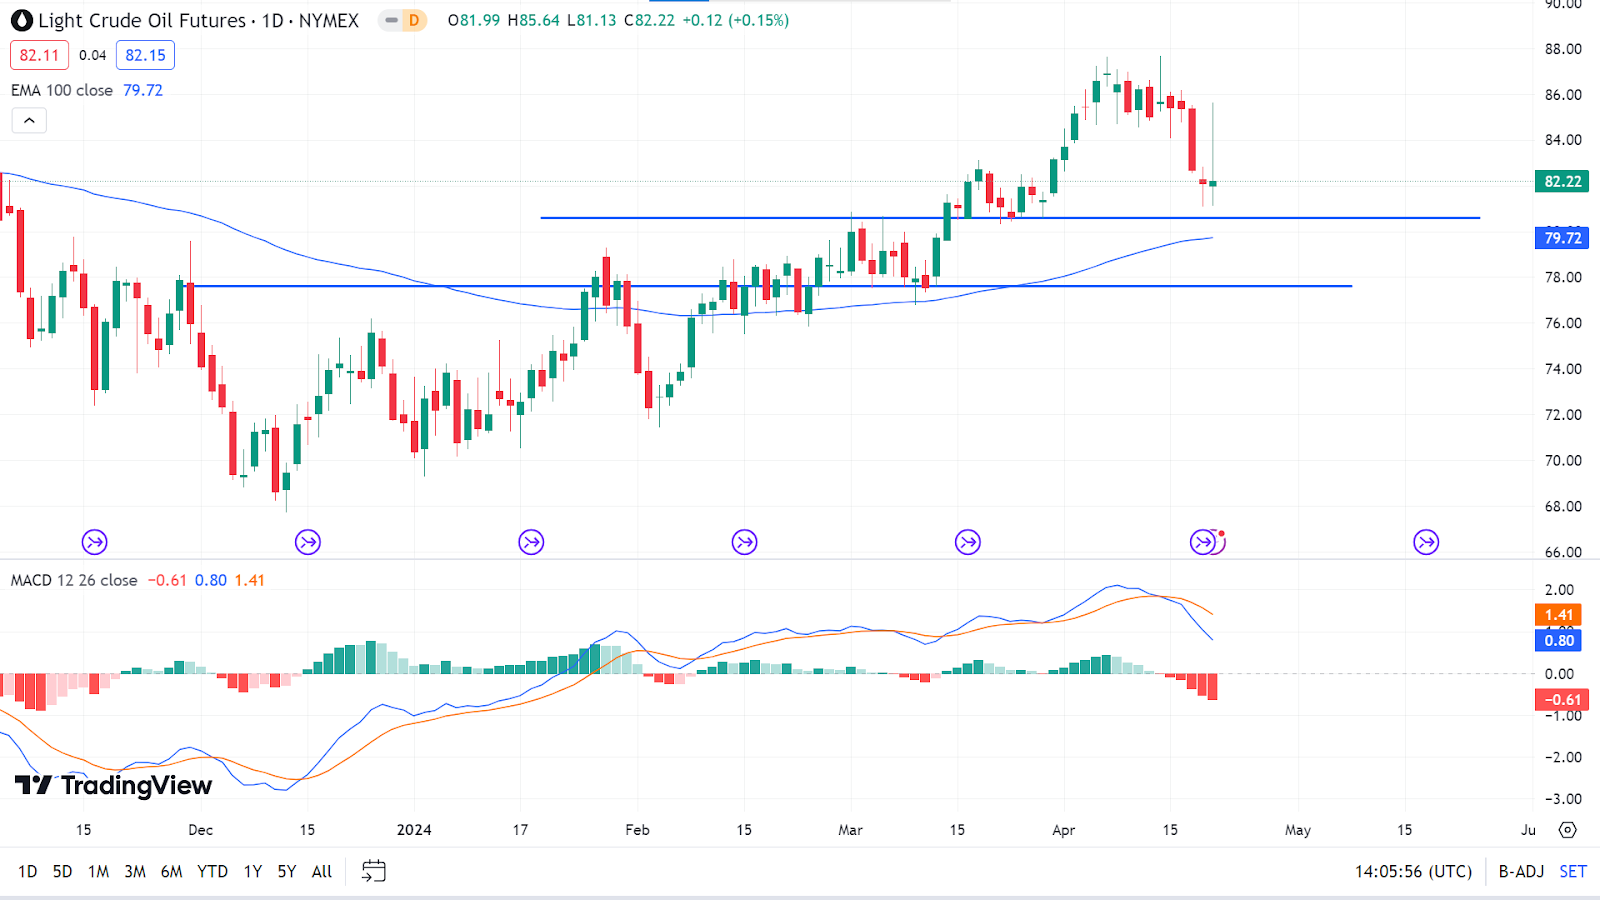
Several technical indicators, including EMA 50, EMA 100, EMA 200, and MACD reading on the D1 chart, suggests the price remains in a buy zone and may regain to the current peak of $87.67 and break above toward $90.00 per barrel on upcoming days.
However, the price remains just above a former support level of $80.60. Any break below that level, as many technical indicators, including EMA 20, Stochastic, and CCI readings suggest to sell, can trigger the price to reach the next support near $77.60.


