


The latest data from Glassnode indicates a resurgence in activity within the stablecoin industry. An expansion in this sector has been discernible for more than eighteen months, as evidenced by Tether's reaching an all-time high in market capitalization of $89 billion.
Tron Market Cap is Remarkable For Bulls
Last month, the aggregate market capitalization of prominent stablecoins increased by nearly $5 billion, attaining a remarkable $124 billion at present. As a result, the lack of selling pressure since May 2022 represents a noteworthy indication of bullishness for the cryptocurrency market. Analysts interpret this upward trend as a positive sign of increased liquidity, and Tether is a major contributor to this expansion.
According to the blockchain investigator Lookonchain, Tether Treasury has issued an additional one billion USDT on the Tron network. Since November 3, a cumulative sum of 6 billion USDT tokens have been minted on the Tron and Ethereum networks as part of this expansion.
What To Expect From Tron AMA Session
Tron is distinguished by its three-layer architecture, which consists of the application layer, main protocol layer, and storage layer. This architectural design provides programmers with adaptability and the capacity to develop intricate and operational software.
The principal asset of the Tron network, the TRX token enables fee payment and payment of expenses, participation in voting, and the accumulation of rewards via staking.
On December 21st, TRON is planning to participate in an Ask Me Anything (AMA) session. The focal point of the discourse will be the strategies and forecasts pertaining to the TRON Network in the calendar year 2024.
Tron (TRXUSD) Technical Analysis
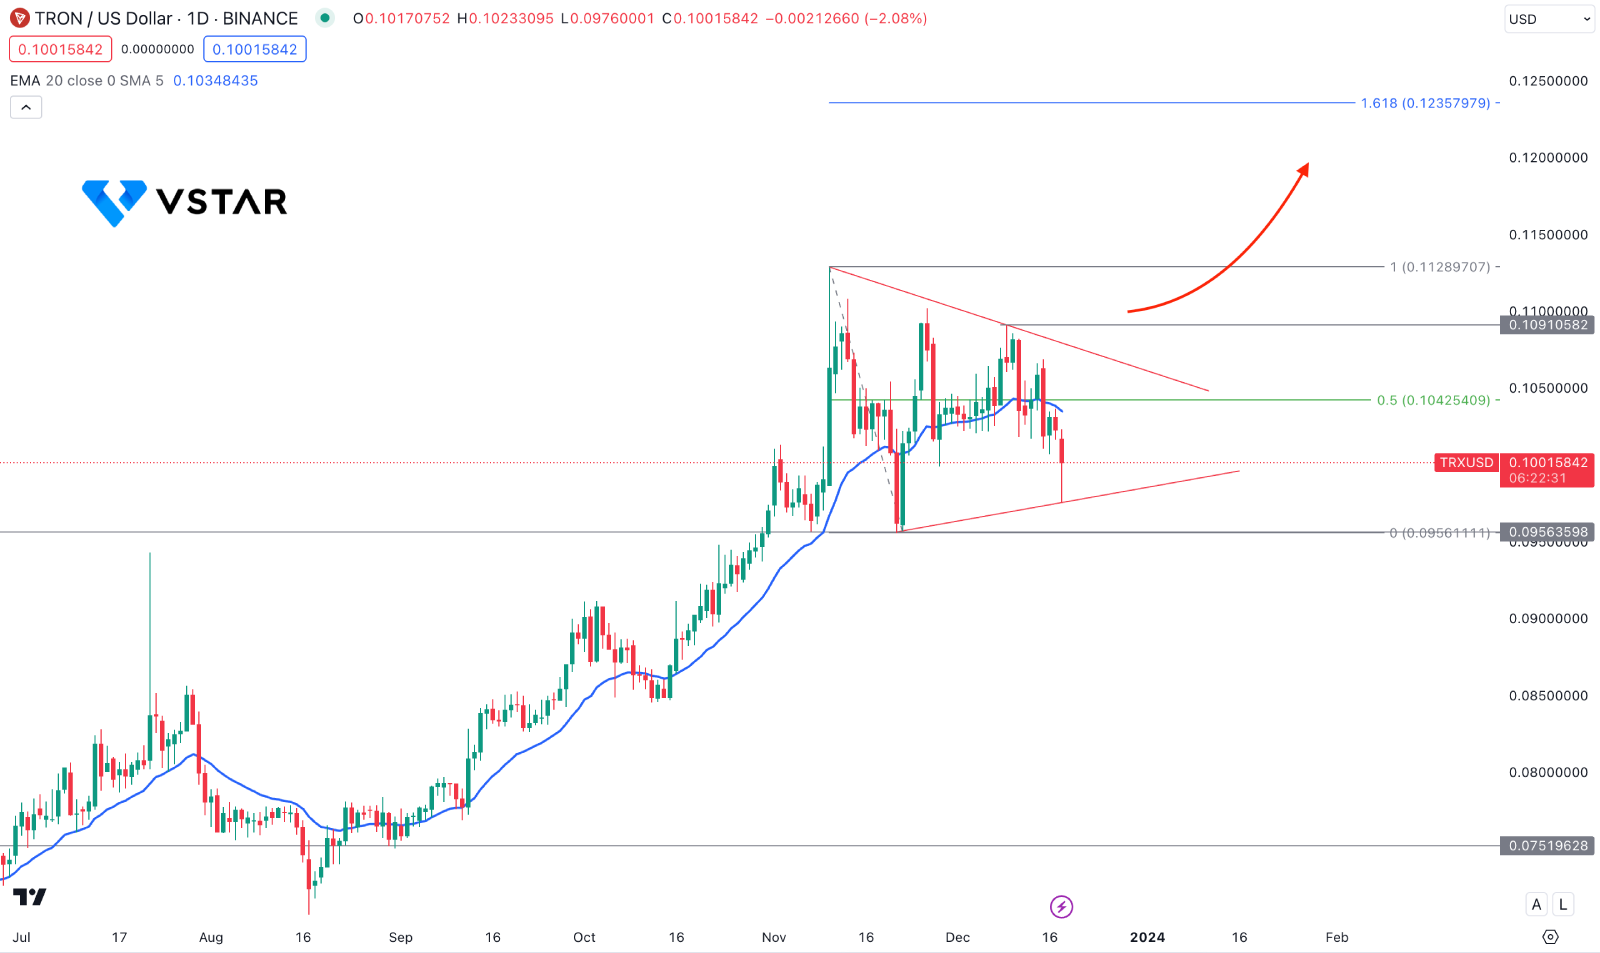
In the daily chart of TRXUSD, the broader market direction is bullish, where the recent price shows a corrective pressure within the symmetrical triangle. Therefore, as long as the price trades within the triangle support, investors might expect a trend continuation in the coming days.

In the main chart, the dynamic 20 EMA works as a barrier to bulls, as the current price is below this line. Moreover, the 100-day SMA still holds the position as a support, where the current RSI shows a downside momentum below the 50.00 line.
Based on the daily outlook of TRXUSD, a bullish daily candle above the 0.1091 level could extend the current trend toward the 1.2357 resistance level.
On the other hand, a bearish correction is possible, but a daily close below the 0.0956 level could lower the price towards the 0.0844 level.


