


On Tuesday, the Australian Dollar (AUD) removed early gains against the Canadian Dollar (CAD) as the latter attempted to recoup recent losses. The favorable economic indicators from Australia, most notably the Retail Sales for November surpassing expectations and a moderate surge in Building Permits, bolstered the Australian Dollar's (AUD) strength.
Australian CPI: What Do We Expect?
In the upcoming data, the Monthly Consumer Price Index data will be the subject of attention on Wednesday. However, the RBA is anticipated to postpone any rate reductions at its forthcoming February meeting.
On the other hand, WTI (West Texas Intermediate) oil prices hovered around $71.00 per barrel despite the Israel-Gaza conflict. As part of his preparations to meet with Arab leaders, US Secretary of State Antony Blinken's visit to Tel Aviv exacerbated these geopolitical tensions.
Canadian Trade Balance In Focus
The Canadian economy may gain insight into its performance through the forthcoming disclosures of the Canadian International Merchandise Trade Balance and Building Permits for November.
Predictions indicate a likelihood of the trade balance declining from $2.97 billion to $2.0 billion, indicating a reorientation in the imports and exports of Canadian products. Furthermore, a projected decline in Building Permits for November, from 2.3% to 2.0%, suggests the potential for a deceleration in construction operations.
These indicators hold significant importance as they mirror patterns in the housing and real estate industries, impacting corporate investments and introducing fluctuations to the CAD.
AUDCAD Technical Analysis
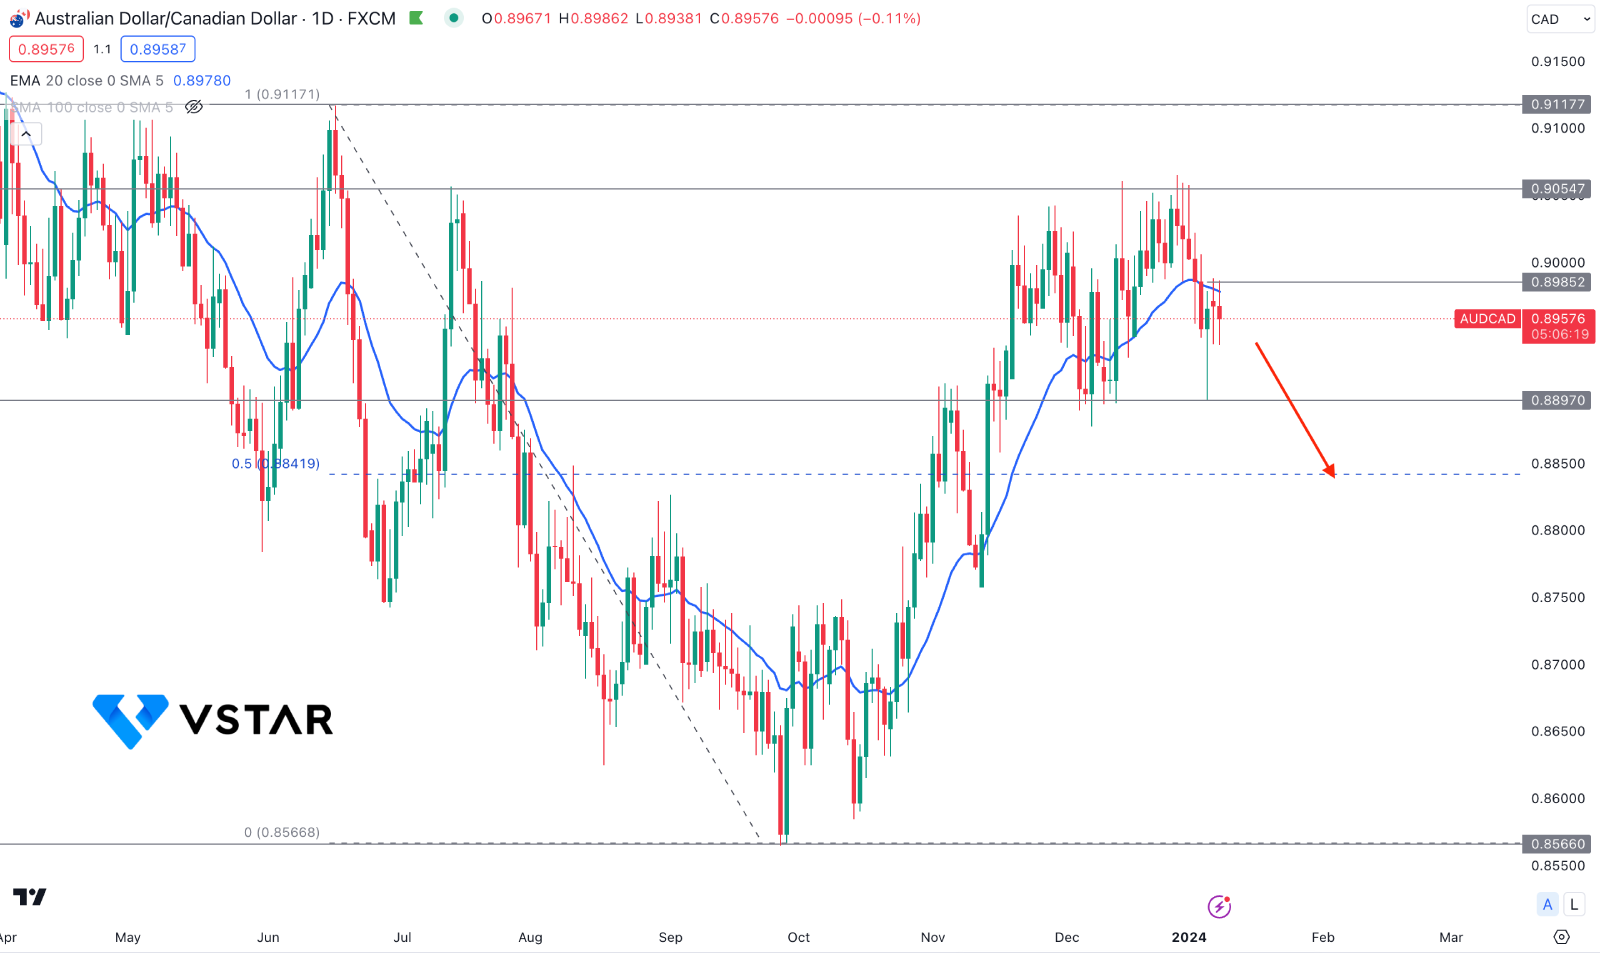
In the daily chart of AUDCAD price, the last 1 month’s price action shows higher volatility at the 0.9054 resistance area. Also, the price reached the premium zone, above the 50% Fibonacci Retracement level from the 0.9117 high to the 0.8567 low. As bulls have shown an impulse before the volatility, a considerable downside correction may happen from the current area.
The main chart shows selling pressure below the dynamic 20-day EMA, while the 100-day SMA is still bullish with upward traction. Meanwhile, the 14-day RSI moved below the 50.00 line, with a sell signal from the MACD Histogram.
Based on the daily outlook of AUDCAD, a downside continuation could come after having a daily close below the 0.8920 level. In that case, the 100 DMA support could be a barrier before reaching the 0.8600 psychological level.
On the bullish side, a strong rebound with a daily close above the 0.9000 psychological level could open room for reaching the 0.9117 resistance level.


