


During the fourth quarter of 2023, BYD Company (BYD) witnessed a notable increase in net profit, surpassing Tesla as the foremost worldwide vendor of electric vehicles during that specific time frame. Also, the technical chart is supportive to bulls, creating a confluence of long opportunities in this stock.
BYD Quarterly Earnings Overview
Tuesday, the Chinese EV manufacturer reported that its net profit for the final three months of the year increased by 19% compared to the same period last year, to 8.67 billion yuan ($1.20 billion). In addition, revenue increased substantially by 15% to CNY 180.04 billion from the previous year, propelled by a 38% increase in sales volume.
With a record-breaking number of sales exceeding 526,000 totally electric vehicles in the fourth quarter, BYD, surpassed Tesla and, for the first time, established itself as the leading quarterly seller of electric vehicles worldwide. However, heightened competition in the Chinese market caused a decline in quarterly profit to CNY10.41 billion compared to the previous quarter.
On a yearly basis, the profit at BYD increased by 81% to CNY30.04 billion, as sales volume surged by an astounding 62% to a record 3.0 million vehicles.
BYD Anticipated A Business Expansion
Notwithstanding recent indications of a deceleration in sales growth, BYD maintains a resolute path toward expansion. The company, supported by Warren Buffett, experienced a significant surge in exports in 2023, shipping more than 242,000 units globally.
As reported by The Wall Street Journal in February, BYD is considering Mexico as a potential site for its factories to expand into new markets, particularly in North America.
BYD Stock Forecast Technical Analysis
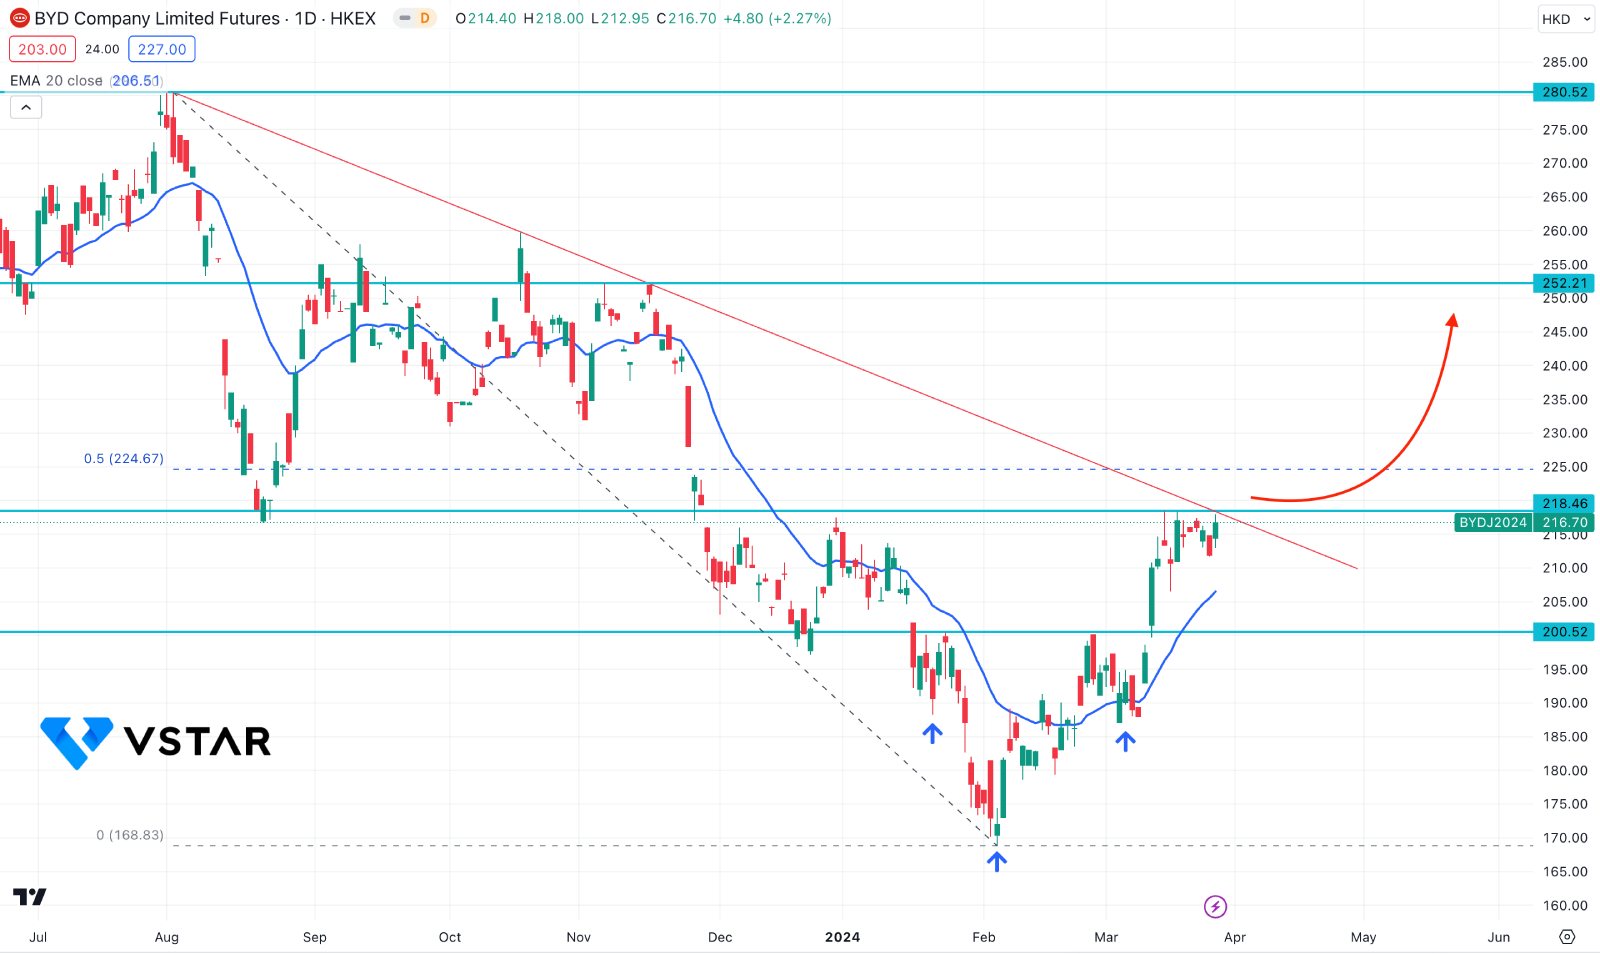
In the daily chart of BYD stock price, an immediate buying pressure is visible from the 168.83 low, suggesting a potential trend reversal. Moreover, a valid inverse Head and Shoulders pattern breakout provided a strong bullish signal, as it trades above the 200.52 neckline. Therefore, as long as the price trades above the 200.00 psychological line, it has a higher possibility of providing more upward pressures.
In the primary chart, the price remained bearish below the dynamic 20-day EMA for a considerable time. However, the shift in direction is seen as the recent price hovering above this area with multiple bullish daily candles.
On the other hand, the ongoing upward pressure is present from the discounted zone as the 50% Fibonacci Retracement level from the broader swing is at the 224.67 level.
Based on the daily outlook of BYD Company stock, investors should monitor how the price reacts to the 218.46 near-term resistance level. A valid breakout with a daily candle above this line could be a potential long opportunity, targeting the 280.52 resistance level.
The alternative approach is to form a bearish rejection from the current trendline resistance and have a daily close below the 200.00 line before reaching the 168.83 support level.


