Introduction
Citigroup Inc. (NYSE: C) is one of the largest and most diversified financial services companies in the world, with a history that dates back to the 19th century. The company has undergone several transformations over the years, facing challenges and opportunities along the way. Today, Citigroup is a global leader in banking, securities, and investment banking. The company operates in over 160 countries and territories, and serves more than 200 million clients.
In recent years, Citigroup has been focused on improving its capital strength and profitability. In 2023, the company has made several important developments in this area, including:
- Declaring a larger dividend than last year. The company's board of directors has approved a quarterly dividend of $0.53 per share, an increase of 5% from the previous year.
- Redeeming its Series B preferred stock. The company has redeemed all of its Series B preferred stock, which was worth $1.5 billion. This will free up capital for other uses.
Overall, Citigroup is a strong and well-managed company with a bright future. The company is well-positioned to benefit from the growth of the global economy, and it is making progress in its efforts to improve its capital strength and profitability.
Citigroup Inc's Overview

Source: HDR
Citigroup was founded in 1812 as the City Bank of New York and later became the First National City Bank of New York. The company expanded its operations globally and diversified its businesses through mergers and acquisitions. In 1998, Citicorp, the parent company of Citibank, merged with Travelers Group, a financial conglomerate that owned Salomon Brothers and Smith Barney. The resulting entity was named Citigroup, which became the largest financial services company in the world at the time.
Today, Citigroup is headquartered in New York City and operates in four major segments: Global Consumer Banking (GCB), Institutional Clients Group (ICG), Corporate/Other, and Citi Holdings. The GCB segment provides banking, credit card, wealth management, and other consumer services to individuals and small businesses in North America, Latin America, Asia, Europe, the Middle East, and Africa.
Citigroup's CEO, Jane Fraser, took office in February 2021, making her the first woman to lead a major U.S. bank. With over 15 years of experience at Citigroup, she held key roles in global consumer banking, Latin America CEO, and private banking head. Fraser played a pivotal role in the bank's digital transformation, simplifying its structure, and strengthening risk management.
Top shareholders of Citigroup include Vanguard Group Inc., BlackRock Inc., State Street Corp., Berkshire Hathaway Inc., and Dodge & Cox. These institutional investors collectively own over 30% of Citigroup's outstanding shares.
Some of the key milestones in Citigroup's history include:
- 2008-2009: Citigroup receives $45 billion in bailout funds from the U.S. government during the global financial crisis.
- 2012-2017: Citigroup sells or exits several non-core businesses and markets as part of its restructuring plan.
- 2021: Jane Fraser becomes the CEO of Citigroup.
- 2023: Citigroup launches a new brand identity and announces plans to invest $1 billion in its technology and infrastructure over the next three years.
Citigroup Inc's Business Model and Products/Services
How Citigroup makes money
Citigroup generates revenue from various sources such as interest income from loans and deposits; fees from card services; commissions from brokerage; income from trading activities; fees from investment banking; income from asset management; gains or losses from investments; and other income from miscellaneous sources.
In 2022 (the latest full-year data available), Citigroup reported total revenue of $74.3 billion (down 9% year-over-year), which was derived from:
- GCB segment: $30.5 billion (41% of total revenue), down 14% year-over-year
- ICG segment: $41.9 billion (56% of total revenue), up 1% year-over-year
- Corporate/Other segment: $1.9 billion (3% of total revenue), down 22% year-over-year
- Citi Holdings segment: $0.1 billion (0% of total revenue), down 86% year-over-year
Main Products and Services
Citigroup offers a wide range of products and services to its customers across the world. Some of the main products and services include:
- Banking: Citigroup provides checking and savings accounts, certificates of deposit, money market accounts, and other deposit products to individuals and businesses.
- Wealth Management: Citigroup provides wealth management services to high-net-worth individuals, families, and institutions through its Citi Private Bank and Citi Personal Wealth Management units.
- Card Services: Citigroup is one of the largest issuers of credit and debit cards in the world. It offers a variety of cards with different features, benefits, and rewards programs to suit different customer preferences.
Others include:
- Brokerage
- Investment Banking
- Trading
- Asset Management
Citigroup Inc's Financials, Growth, and Valuation Metrics
Source: Telegraph
Review of Citigroup Inc's financial statements
Citigroup's financial statements reflect its performance in terms of profitability, growth, efficiency, and liquidity. Here are some of the key highlights from Citigroup's financial statements for the year 2023 (the latest full-year data available):
Citigroup's market capitalization on July 23, 2023, was $91.6 billion, down 18% from December 31, 2022.
Citigroup Earnings
- Net income for 2023 was $11.6 billion, down 19% from 2022 due to lower revenues, higher credit losses, and operating expenses.
- Revenue in 2023 was $74.8 billion, slightly up from 2022, driven by increased ICG segment revenues.
- Profit margins decreased in 2023, with gross profit margin at 67.4% and operating profit margin at 25%. ROE for 2023 was 7.6%, down from 9.4% in 2022.
Citigroup's balance sheet as of July 31, 2023: total assets $1.9 trillion, total liabilities $1.7 trillion, total equity $152 billion. Assets mainly include loans, cash, deposits, securities, and other assets. Liabilities mainly consist of deposits, long-term debt, borrowed funds, and other liabilities. Balance sheet strength is assessed using liquidity and leverage ratios. The current ratio (0.9) indicates low liquidity, posing risk in case of increased outflows or decreased inflows. The debt-to-equity ratio (2.2) suggests high leverage, potentially increasing returns and default risk.
Key financial ratios and metrics
Citigroup's financial ratios and metrics can be compared to its peers and the industry to determine if the stock is undervalued, fairly valued, or overvalued. Here are some of the key valuation multiples for Citigroup and its competitors as of July 23, 2023:
|
Company |
P/E Ratio |
P/S Ratio |
P/B Ratio |
EV/EBITDA Ratio |
|
Citigroup Inc © |
7.5 |
1.2 |
0.6 |
6.4 |
|
JPMorgan Chase & Co (JPM) |
11.9 |
3.4 |
1.5 |
10.8 |
|
Bank of America Corp (BAC) |
10.8 |
2.7 |
1.2 |
9.4 |
|
Wells Fargo & Co (WFC) |
9.7 |
2.3 |
0.9 |
8.1 |
|
Industry Average |
10.5 |
2.6 |
1.1 |
8.7 |
Based on these valuation multiples, Citigroup's stock appeared to be undervalued compared to its competitors and the industry, suggesting that it had room for upside potential.
C Stock Performance Analysis
Source: Barchart
C Stock trading information
Citigroup's common stock trades on the New York Stock Exchange (NYSE) under the ticker symbol C. The stock is also listed on other exchanges such as London, Frankfurt, Tokyo, and Hong Kong.
Citigroup's stock trading information as of July 23, 2023, was as follows:
- IPO Time: Citigroup's initial public offering (IPO) took place on April 20, 1998, when it issued 3.8 billion shares at $9.50 per share, raising $36.1 billion in proceeds.
- Primary Exchange & Ticker: Citigroup's primary exchange is the NYSE and its ticker symbol is C.
- Country & Currency: Citigroup is based in the U.S. and its stock is denominated in U.S. dollars (USD).
- Trading Hours: Citigroup's stock trading hours on the NYSE are from 9:30 a.m. to 4:00 p.m. Eastern Time (ET) on weekdays, excluding U.S. market holidays. Citigroup's stock also trades in the pre-market session from 4:00 a.m. to 9:30 a.m. ET and in the after-market session from 4:00 p.m. to 8:00 p.m. ET on weekdays.
- C Stock Splits: Citigroup's stock has undergone four stock splits in its history: a 3-for-2 split on May 21, 1999; a 2-for-1 split on March 10, 2000; a 10-for-1 reverse split on May 9, 2011; and a 5-for-1 split on June 25, 2015.
- C Stock Dividend: Citigroup pays quarterly dividends to its shareholders. The most recent dividend was $0.53 per share, paid on May 28, 2023. The annualized dividend yield was 4.5% as of July 23, 2023.
C Stock Price Performance since its IPO
Citigroup's stock price performance since its IPO has been volatile, reflecting the ups and downs of the financial industry and the global economy. The stock reached its all-time high of $557.40 (adjusted for splits) on December 27, 2006, before plunging to its all-time low of $9.70 (adjusted for splits) on March 5, 2009, during the global financial crisis.
Since then, Citigroup stock price has recovered somewhat but has not regained its pre-crisis levels. The stock closed at $47.05 on July 23, 2023, which was 92% lower than its all-time high and 385% higher than its all-time low.
Citigroup's stock price volatility can be measured by its beta, which indicates how much the stock moves relative to the market. A beta of 1 means that the stock moves in sync with the market, while a beta greater than 1 means that the stock is more volatile than the market, and a beta less than 1 means that the stock is less volatile than the market.
Citigroup's beta as of July 23, 2023, was 1.6, which means that the stock was more volatile than the market by 60%. This implies that Citigroup stock price was more sensitive to market fluctuations and more prone to risk and reward.
Key Drivers of C Stock Price
Citigroup's stock price is influenced by various factors such as:
- Macroeconomic Conditions: Citigroup's business performance and outlook depend largely on the state of the global economy and financial markets.
- Industry Trends: Citigroup operates in a highly competitive and regulated industry that is constantly evolving due to technological innovation, customer preferences, and regulatory changes.
- Company Performance: Citigroup's stock price reflects its financial performance and outlook, as well as its strategic initiatives and corporate actions.
- Market Sentiment: Citigroup stock price is also influenced by the general mood and expectations of investors and analysts. Factors such as analyst ratings, price targets, earnings surprises, guidance revisions, news headlines, rumors, and market trends can affect Citigroup stock price and volatility.
C Stock Forecast
Citigroup's stock price forecast can be based on various methods such as trend analysis, technical analysis, and fundamental analysis. Here are some of the possible approaches:
C Stock Price Trend Analysis
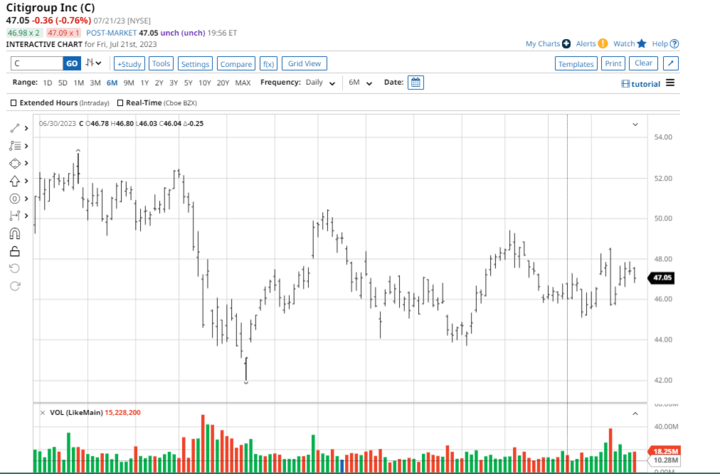
Trend analysis involves identifying the direction and strength of the stock price movement over time. One of the common tools for trend analysis is the moving average (MA), which is the average of the stock price over a certain period. The MA smooths out the short-term fluctuations and shows the underlying trend of the stock price. A common MA indicator is the 50-day MA, which is the average of the stock price over the past 50 trading days. Another common MA indicator is the 200-day MA, which is the average of the stock price over the past 200 trading days.
As of July 23, 2023, as seen in the chart below, Citigroup's stock price was below its 50-day moving average (MA) at $48.32 but above its 200-day MA at $46.87, indicating a short-term downtrend but a long-term uptrend. A golden cross (50-day MA crossing above 200-day MA) signals a bullish scenario, while a death cross (50-day MA crossing below 200-day MA) indicates a bearish scenario. Currently, there was no golden cross or death cross, with the 50-day MA being 1.2% below the 200-day MA, suggesting the stock's trend was not likely to change significantly in the near future.
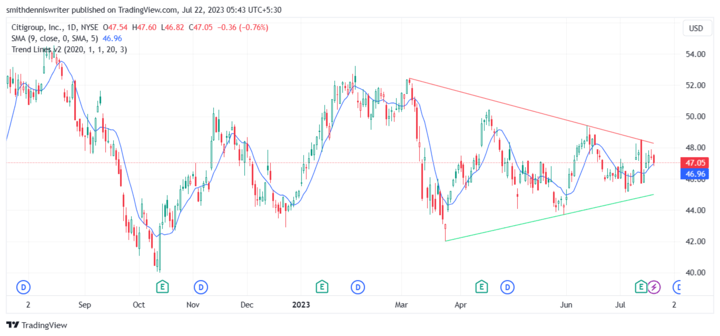
Source: TradingView
Key Resistance and Support Levels of C Stock
Resistance and support levels are the price levels where the stock price tends to bounce back or breakthrough. Resistance levels are the price levels where the stock price tends to find sellers and retreat downward. Support levels are the price levels where the stock price tends to find buyers and rebound upward.
As of July 23, 2023, Citigroup's stock price was $47.05, near its support level of $46.81 and below its resistance level of $48.67. This indicated a narrow trading range, with limited potential for significant movement. There were no signs of a breakout or breakdown, as the stock traded within the support and resistance levels with low volume and momentum, suggesting no major changes soon.
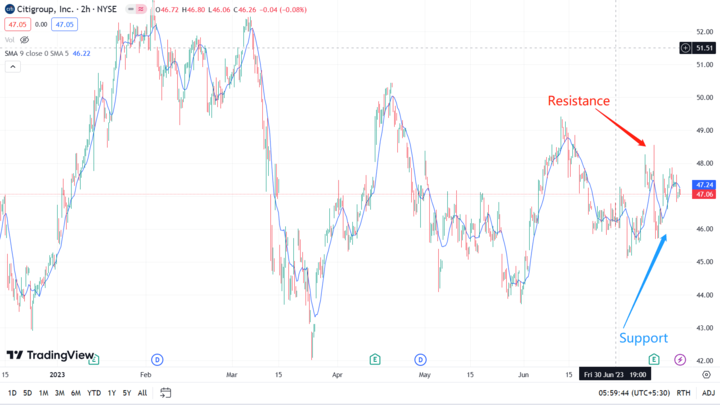
Source: TradingView
Analyst Recommendations and Price Targets
Analyst recommendations and price targets are the opinions and estimates of professional analysts who cover Citigroup stock. Analyst recommendations indicate whether analysts think that investors should buy, hold, or sell Citigroup stock. Price targets indicate what analysts think Citigroup's stock price will be in the next 12 months.
- As of July 23, 2023, Citigroup had 28 analyst ratings, with 19 buy ratings, 8 hold ratings, and 1 sell rating. The consensus analyst recommendation was buy, indicating that analysts were generally bullish on Citigroup stock.
- As of July 23, 2023, Citigroup had an average analyst price target of $55.32, with a high target of $65.00 and a low target of $45.00. The average analyst price target implied an upside potential of 17.6% from Citigroup's current stock price of $47.05. The high target implied an upside potential of 38.1%, while the low target implied a downside potential of 4.4%.
Challenges and Opportunities

Source: EconomicTimes
Citigroup faces various risks and challenges in its business environment, as well as opportunities and growth drivers for its future development. Here are some of the main factors to consider:
Competitive Risks
Citigroup operates in a highly competitive and regulated industry that is constantly evolving due to technological innovation, customer preferences, and regulatory changes. Some of Citigroup's main competitors include:
- JPMorgan Chase & Co (JPM): JPMorgan Chase is the largest U.S. bank by assets and one of the leading global financial services firms. It offers a wide range of products and services across consumer and community banking, corporate and investment banking, commercial banking, and asset and wealth management segments.
- Bank of America Corp (BAC): Bank of America is the second-largest U.S. bank by assets and one of the leading global financial services firms. It offers a comprehensive range of products and services across consumer banking, global wealth and investment management, global banking, and global markets segments.
JPMorgan Chase & Co (JPM) and Bank of America Corp (BAC) are two of Citigroup's main competitors in the financial services industry. Both companies have established competitive advantages that help them compete with Citigroup.
In terms of threats, JPMorgan and Bank of America's size, scale, diversified business models, and strong brands could potentially allow them to attract customers away from Citigroup. Their focus on technological innovation and customer service could also provide them with a competitive edge in terms of attracting and retaining customers.
However, it's important to note that Citigroup also has its own set of competitive advantages that help it compete effectively in the highly competitive financial services industry. These include a highly skilled workforce, a strong base of reliable suppliers, a successful track record of developing new products, a strong brand portfolio, a large ATM network, and recognition of diversity as one of its competitive advantages.
Other Risks
Besides competitive risks, Citigroup also faces other risks that could adversely affect its business performance and outlook. Some of these risks include:
- Operational Risks: Citigroup's operational risks are the risks of loss or harm resulting from inadequate or failed internal processes, systems, people, or external events. These include but are not limited to human errors, fraud, cyberattacks, data breaches, system failures, natural disasters, pandemics, terrorism, and litigation. For example:
In 2023, Citigroup faced a class-action lawsuit from its customers who claimed that they were overcharged for overdraft fees due to a system glitch.
Citigroup needs to implement effective policies, procedures, controls, and contingency plans to prevent, detect, mitigate, and recover from operational risks.
- Reputational Risks: Citigroup's reputational risks are the risks of damage to its brand, image, trust, and goodwill due to negative perceptions or actions by its stakeholders, such as customers, employees, investors, regulators, media, and the public.
- Strategic Risks: Citigroup's strategic risks are the risks of failure or underperformance in achieving its business objectives and goals due to internal or external factors.
Growth Opportunities
Citigroup also has various opportunities and growth drivers that could enhance its business performance and outlook. Some of these include:
- Global Presence: With operations in over 160 countries and jurisdictions worldwide, Citigroup benefits from a diverse customer base and revenue streams. Its broad global network allows the company to provide cross-border solutions and capture synergies across its businesses, contributing to a strong and resilient balance sheet.
- Digital Transformation: Citigroup is actively undergoing a digital transformation to improve customer experience and operational efficiency. Investments in digital platforms and innovative technologies like AI, data analytics, and blockchain enable the company to cater to changing customer preferences, boost risk management, and enhance security.
- Wealth Management: Citigroup's expansion in wealth management presents a significant growth opportunity. Targeting high-net-worth individuals and families, as well as affluent and emerging affluent customers in the U.S. and Asia Pacific, Citigroup aims to offer comprehensive financial services.

Source: Mint
Future Outlook and Expansion
Citigroup has an optimistic outlook for its future growth and development, as it pursues various strategic initiatives and expansion plans. Some of these include:
- Exiting Consumer Banking Operations in 13 Markets: Citigroup plans to exit its consumer banking operations in 13 markets across Asia, Europe, the Middle East, and Africa. This move is aimed at focusing on core strengths and optimizing the global network. The exit process is expected to be completed by the end of 2023.
- Expanding Wealth Management Business in Asia Pacific: Citigroup intends to invest $150 million to expand its wealth management business in the Asia Pacific region. It aims to hire over 1,100 wealth management professionals, enhance digital capabilities, and cater to the fast-growing affluent and emerging affluent customer segments. The goal is to increase wealth management revenue in the region by 20% by 2025.
- Launching New Digital Banking Platform in the U.S.: Citigroup plans to introduce a comprehensive digital banking platform in the United States. The platform will offer a wide range of products and services, including checking, savings, credit cards, investments, loans, and insurance.
Why Traders Should Consider C Stock
A. Reasons Why Traders Should Consider C Stock
Strong Balance Sheet: Citigroup's financial position, as reflected in its balance sheet, showcases its stability with substantial assets and manageable liabilities. This can instill confidence in traders seeking reliable investment opportunities.
Potential Market Capitalization Recovery: With C Stock experiencing an 18% decline in market capitalization from December 2022 to July 2023, there is potential for a rebound in value, presenting an attractive opportunity for traders to buy at a lower price with the anticipation of future growth.
Diversified Revenue Streams: Citigroup's diversified revenue streams, particularly its robust ICG segment, can act as a buffer against market fluctuations and provide traders with exposure to various sectors.
Historical Profitability: Despite a 19% decrease in net income from 2022 to 2023, Citigroup has historically shown profitability. Traders may view this track record as a positive sign for future earnings potential.
B. Trading Strategies for C Stock
Day Trading Strategy
Day trading strategy for Citigroup stock is to use a combination of trend following and momentum indicators to identify entry and exit points. For example, you can use a 20-period exponential moving average (EMA) to determine the direction of the trend, and a stochastic oscillator to measure the strength of the price movement. A buy signal is generated when the price is above the EMA and the stochastic crosses above 20 from below, indicating an oversold condition. A sell signal is generated when the price is below the EMA and the stochastic crosses below 80 from above, indicating an overbought condition. You can also use a stop-loss order to protect your position in case of a sudden price reversal.
Swing Trading Strategy
Also, a possible swing trading strategy for Citigroup stock is to use a breakout strategy based on support and resistance levels. Support and resistance are horizontal lines that indicate where buyers and sellers tend to enter and exit the market. A breakout occurs when the price moves beyond a support or resistance level with high volume, indicating a change in supply and demand. A buy signal is generated when the price breaks above a resistance level, and a sell signal is generated when the price breaks below a support level. You can also use a trailing stop order to lock in your profits as the price moves in your favor.
CFD Trading (Contract for Difference) Strategy
CFDs allow traders to speculate on the price movements of Citigroup stock without owning the underlying asset. Advantages of CFD trading include:
- Leveraged Positions: Traders can open larger positions with a fraction of the total trade value, potentially amplifying profits (but also increasing losses).
- Short Selling: CFDs enable traders to profit from both upward and downward price movements, as they can speculate on falling prices by taking short positions.
- Access to Diverse Markets: CFDs offer exposure to global markets, providing opportunities for traders to capitalize on various economic conditions.
Source: NewYork Times
Trade C Stock CFD with VSTAR
Advantages of VSTAR
- Reliable Trading Platform: VSTAR offers a user-friendly and technologically advanced trading platform, providing traders with real-time data, charting tools, and order execution efficiency.
- Extensive Asset Selection: VSTAR's wide range of available CFD assets, including C Stock, allows traders to diversify their portfolios and explore various trading opportunities.
- Risk Management Tools: VSTAR provides risk management features like stop-loss and take-profit orders, helping traders protect their investments and optimize trading strategies.
- Customer Support: VSTAR offers excellent customer support, ensuring traders have access to assistance and guidance whenever needed.
- Competitive Pricing: VSTAR offers competitive spreads and commissions, making it a cost-effective choice for CFD trading.


Conclusion
Considering Citigroup's strong balance sheet, potential market capitalization recovery, diversified revenue streams, and historical profitability, C Stock presents an attractive opportunity for traders. By employing appropriate trading strategies, such as CFD trading and long-term investments, traders can capitalize on C Stock's potential growth.
For those interested in CFD trading, partnering with VSTAR can further enhance the trading experience, benefiting from its reliable platform, diverse asset selection, risk management tools, excellent customer support, and competitive pricing. Overall, C Stock and VSTAR form a compelling proposition for traders seeking to make informed and strategic investment decisions.