


While technical indicators show bullish pressure in the BTCUSD price, on-chain metrics indicate a consolidation.
Bitcoin On-chain Metrics Analysis
According to the recent MVRV data, the most recent upward pressure in the Bitcoin price could be short-lived. As per the current reading, the 7-day data is at 3.5%, while the 30-day data is at 6.0%
The MVRV or Market Value to Realized Value is an on-chain metric that indicates the average profit or loss investors make within a period. Historically, when MVRV data reaches that level, Bitcoin showed a good correction. Moreover, the daily active wallet address declined after reaching the 1.23 million peak on 15 September 2023.
Institutions Await Bitcoin ETF Approval
Analysts have growing confidence that the SEC will approve the Bitcoin ETF soon. This validation could be important for mainstream and institutional adoption. However, it would be a good long signal for retail investors.
As per the decent data from Glassnodes, the broader crypto market showed a massive exchange to Bitcoin this week. Moreover, the recent high-profile trial of Sam Bankman-Fried could be another event to look at.
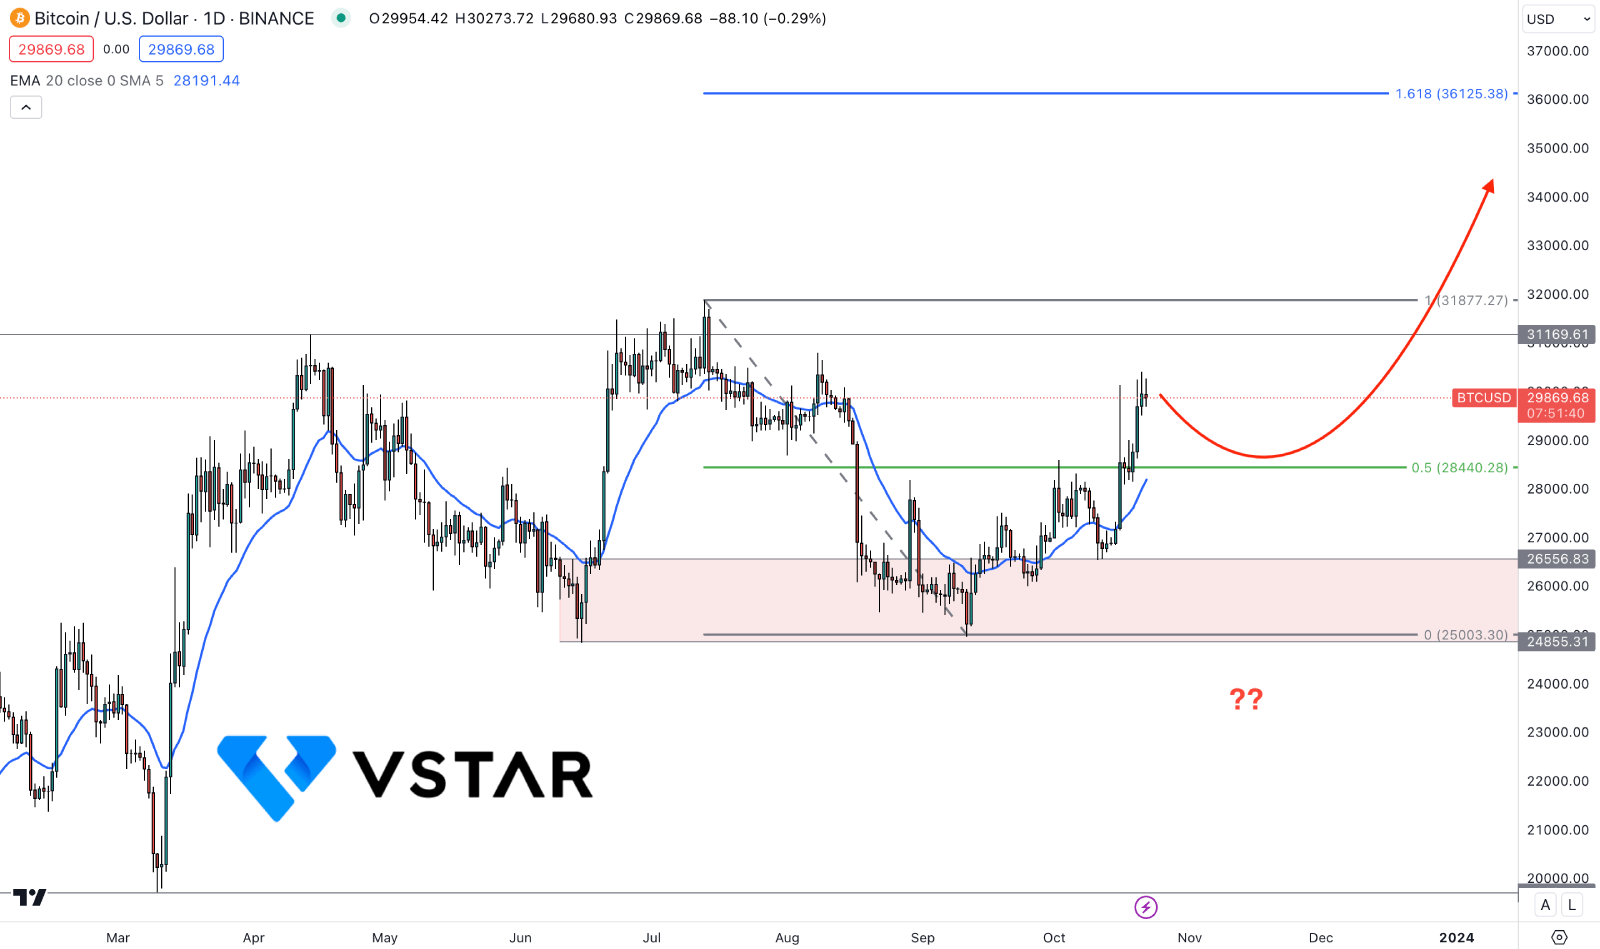
Bitcoin (BTCUSD) Technical Analysis

In the BTCUSD daily chart, the recent price formed a bullish structure break above the 31,169.61 swing high before reaching the 26,556.83 to 24,855.31 demand zone. As the current upward pressure from the demand zone came with an impulsive bullish pressure, investors might find it as a long signal after a considerable correction.
On the bearish side, an immediate downside correction could come towards the dynamic 20-day EMA. However, a sharp bearish pressure with a daily candle below the 24,500.00 level could be a strong bearish signal, targeting the 20,000.00 mark.
On the other hand, an immediate bullish pressure above the 31,000.00 level could extend the momentum towards the 36,125.38 Fibonacci Extension level. However, a minor downside correction and a bullish rejection from the 20 EMA or static 28,084.30 level could be another long signal.


