


Ethereum (ETH) has traded sideways in recent days, which could signal a possible trend trading opportunity after a breakout. Moreover, the recent on-chain data suggests support for bulls, but investors should keep a close eye on how the price reacts after the recent coin injection into the network.
What Does Ethereum (ETH) On-chain Metrics Say?
Ethereum (ETH), the second-largest cryptocurrency in the world, has been consolidating recently around the $2,300 mark, with an upward possibility from on-chain indicators. Moreover, the upcoming Ethereum Dencun enhancement would be a bullish factor for this instrument, which anticipates gains between 50 and 60% in the near future.
In the past three weeks, an estimated 510,000 Ethereum (ETH), valued at $1.22 billion was taken out from identifiable cryptocurrency exchange wallets, as shown by crypto analyst Ali Martinez. The substantial ETH outflow indicated a potential selling pressure in the ETH price. On the other hand, an inactive Ethereum wallet was reactivated recently after 9 years, containing 492 ETH, valued at $1.1 million.
Ethereum Whale Movement
The recent publication by Spot On Chain on the X suggests that 32,930 ETH was transferred to Binance. This conduct aligns with the whale's historical pattern of transferring substantial quantities of ETH to Binance before significant price declines.
The uncertainty regarding the near future of Ethereum is exacerbated by the potential for the behemoth to make additional efforts. Analysts recommend that the market prepare for possible fluctuations and emphasize the criticality of closely observing trading patterns and whale activities in the coming days.
Ethereum (ETHUSD) Technical Analysis

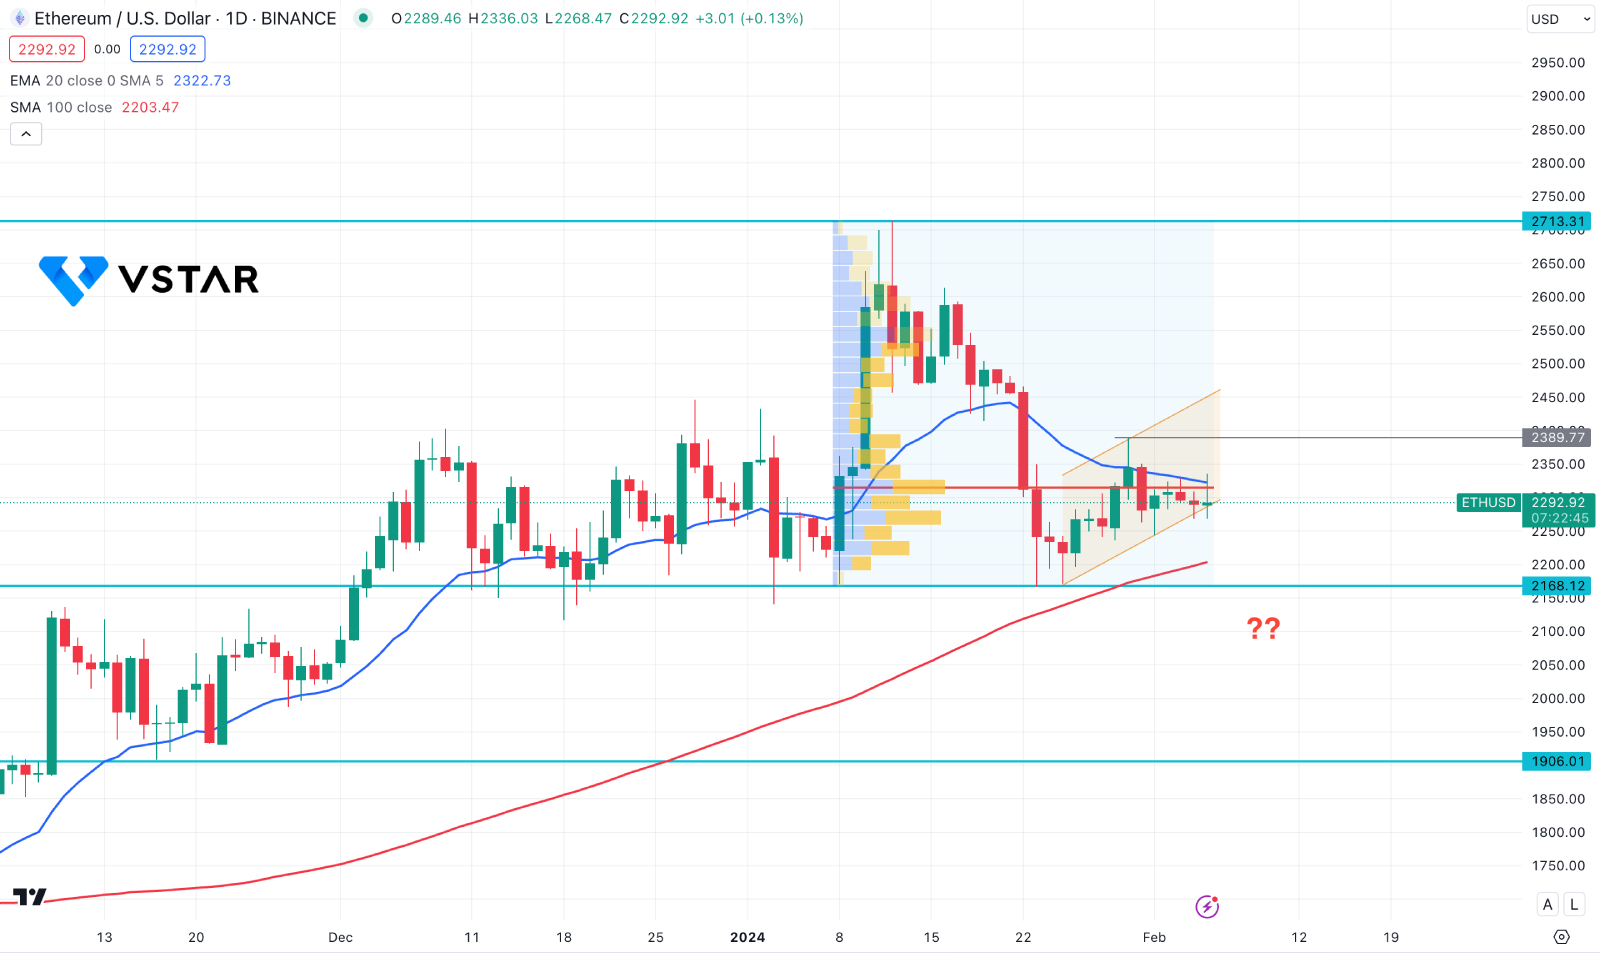
In the daily chart of ETHUSD, the overall market momentum is bullish, supported by the 100-day SMA line. In that case, the primary aim of this pair is to seek long trades only.
On the other hand, the recent Ethereum price struggled to overcome the 20-day EMA line and remained sideways below it. Meanwhile, the 14-day RSI shows a rebound from the overbought 70.00 level, while the MACD Histogram is neutral.
In the weekly chart, the recent ETH price shows downside pressure after forming a top at the 2713.31 level. Later on, a minor upward pressure came but closed the week as the bearish inside bar continuation opportunity.
Based on this outlook, a solid channel breakout with a daily candle below the 2168.12 level could create a bearish CHoCH breakout. In that case, the downside pressure might extend towards the 2000.00 psychological level.
On the bullish side, an immediate rebound is possible from the channel support, which might extend the range, targeting the 2550.00 level.


