


Palladium spot price fell below those of its sibling metal platinum for the first time since April 2018. As a result of mounting concerns regarding demand and anticipations of a stable supply, the metal's value has been placed under pressure to decline.
Palladium Reached The Historic Low
The substantial 39% decline in palladium's value in 2023 was primarily attributable to its preceding robust price increase from 2018 to 2022. The automotive industry, which accounts for 80% of palladium demand, began substituting it more frequently with platinum to reduce hazardous emissions.
The metal's prognosis was further dampened by the increasing market share of battery-powered electric vehicles, which do not necessitate emission control systems based on palladium.
Palladium Miners' Update
Jointly, South Africa and Russia account for 80% of the worldwide palladium production; the remaining 80% is extracted in North America. Although Nornickel, the principal miner of palladium in Russia, has anticipated a marginal decline in production for the ongoing year.
Amidst the gathering of numerous producers at the African Mining Indaba conference in Cape Town last week, there were no notable announcements regarding production reductions. However, South African miners did indicate a desire to reduce expenditures.
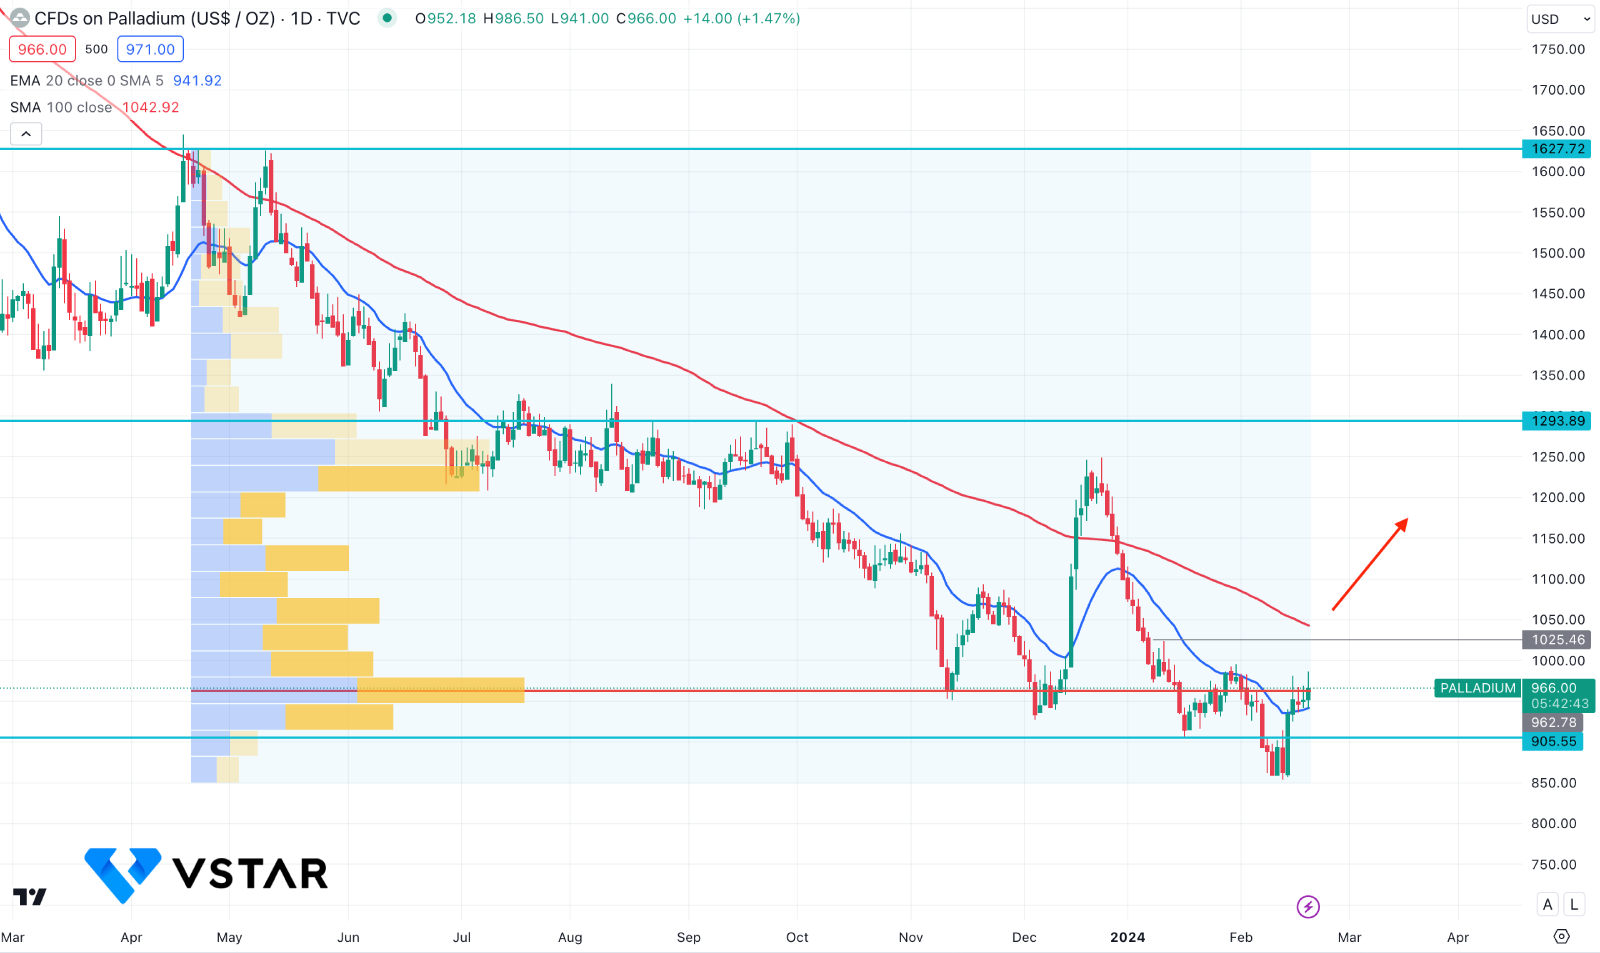
XPDUSD Technical Analysis

In the daily chart of XPDUSD, the recent Palladium price shows an impulsive bearish pressure with no sign of a significant bullish reversal.
In the higher timeframe, the current monthly candle trades bearish after a two-bar continuation pattern. Moreover, the weekly chart shows a bullish engulfing pattern and formed a bullish weekly close after making a significant low.
In the volume structure, the most active level since April 2023 is closer to the current price, which suggests higher traders' activity in the market.
Based on this outlook, a bullish reversal is possible after having a CHoCH breakout. A daily close above the 1025.40 level could be a conservative long opportunity, targeting the 1293.89 resistance level.
On the bearish side, the 100-day SMA would be a crucial resistance. A bearish daily close below the 20-day EMA could be a potential short opportunity, targeting the 800.00 level.


