


Cardano, a Layer-1 blockchain token, is positioned to sustain its recent upward pressure this week. A considerable price increase of approximately 20% was observed for the altcoin on the Binance exchange in the initial week of November. Moreover, several on-chain metrics provided indications of an optimistic future for this coin.
Cardano (ADA) Transaction Volume
![]()
As per the recent data, Cardano has experienced a steady ascent in transaction volume this quarter, culminating in its highest point in November. In particular, November 6 witnessed a remarkable transaction volume, climbing from 237.63 million to 332.08 million.
Before that, Cardano's transaction volume peaked at 332.08 million, which was the highest level in the last three months. This further strengthens the argument for a favorable trajectory in the price of ADA.
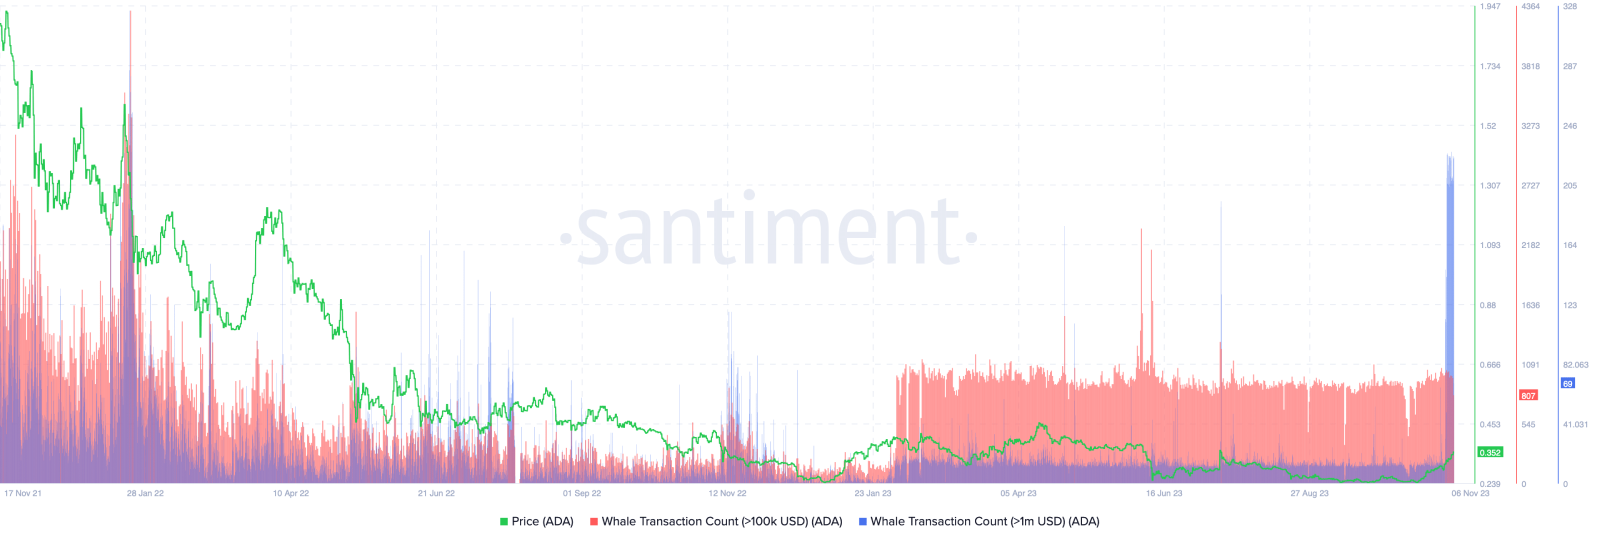
Cardano Whale Accumulation
The number of whale transactions, which have a value exceeding $1 million, is a metric to gauge the activities of substantial wallet investors. Whale activity is generally perceived positively when the asset's price experiences a downtrend.
As per the latest data, the number of whale transactions exceeding $1 million on Cardano exceeded 6,700 between November 2 and early Monday. In conclusion, traders' apparent active accumulation of Cardano supports the ongoing price increase of ADA.
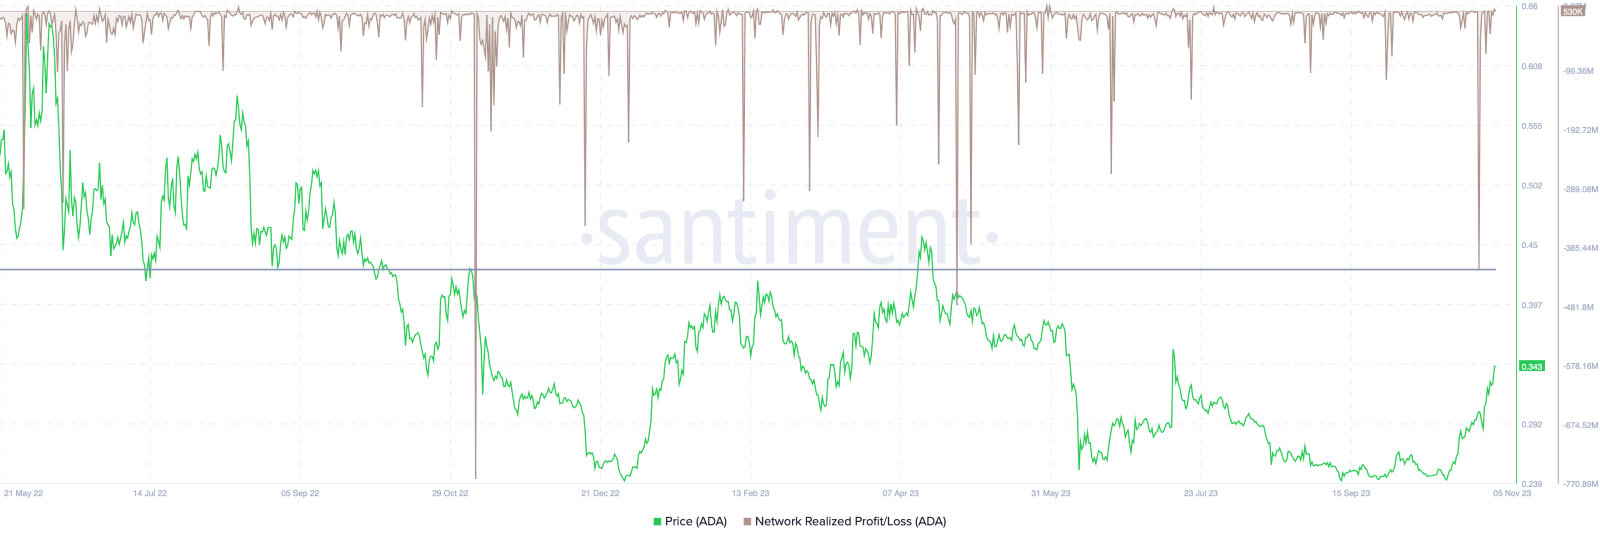
Cardano Network Realized Gain/Loss
The Net Realized Profit/Loss is a metric to compute the net profit or loss in US Dollar value for all ADA tokens expended during a half-yearly period. The recent data shows a noteworthy capitulation event on October 30, signifying Cardano's highest point in five months.
This metric indicates that the majority of tokens spent in November were involved in profitable transactions, which lends credence to the favorable outlook on Cardano's price.
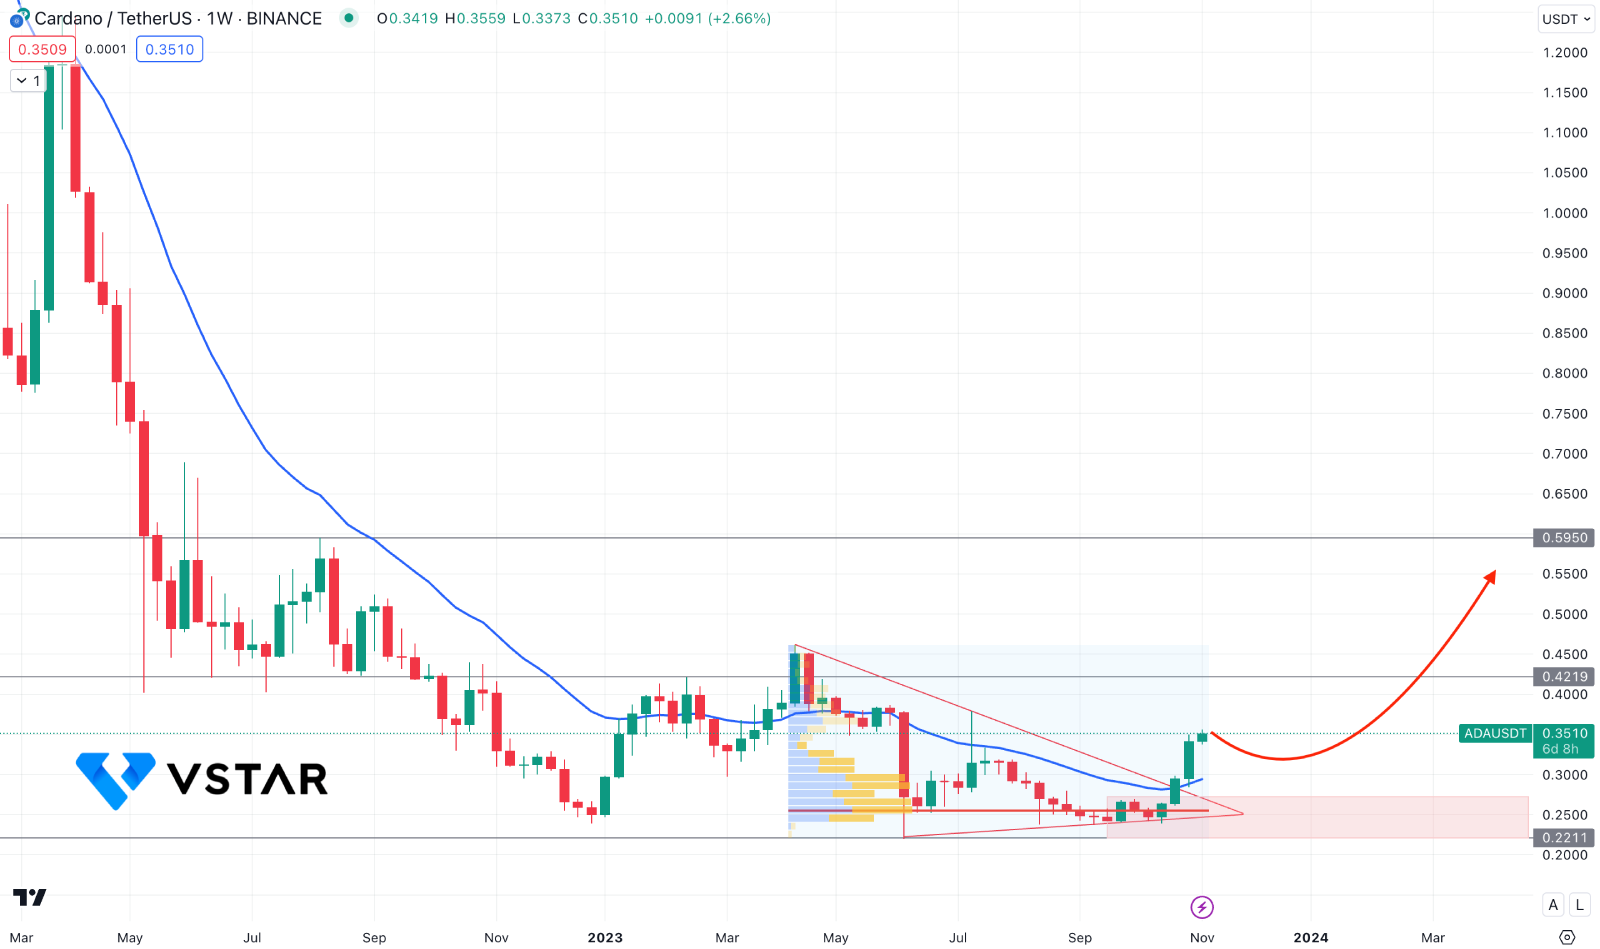
ADAUSD Technical Analysis
In the latest weekly price of ADAUSD, the overall market pressure was extremely corrective for an extensive period. However, the latest development on On-chain metrics suggests a bullish reversal, supported by a valid trendline breakout.

Moreover, the bullish breakout is visible with a 20 week EMA, which came with a valid candle close. Based on this structure, the upward pressure could extend towards the 0.4219 resistance level. Moreover, a stable market above the 0.4219 level could take the price towards the 0.5950 resistance level.
The conservative outlook is to wait for a valid bearish rejection from the 0.4000 to 0.4200 area could indicate a bearish possibility, targeting the 0.2211 support level.


