


This week, Cardano's ADAUSD, a prominent cryptocurrency, has increased its market capitalization by over $500 million. The recent surge in value can be attributed to the favorable reaction of financial markets, specifically the cryptocurrency community, towards the most recent publication of Consumer Price Index (CPI) data.
Cardano Market Cap Surged
Cardano's market capitalization increased from $15.4 billion to $16.29 billion during the current trading session, consolidating its position as the tenth-largest cryptocurrency by market capitalization, according to data from CoinMarketCap. With this surge, Cardano surpassed Shiba Inu (SHIBUSD) but fell behind Dogecoin (DOGEUSD), which is currently ranked ninth with a market capitalization of $22.24 billion.
The resurgence of ADA amid market volatility demonstrates the tenacity and potential of this widely adopted cryptocurrency. Analysts' keen monitoring of Cardano's development and the substantial surge in market capitalization indicate a revitalized outlook on ADA's investment potential.
Why did the ADA Surged Yesterday?
The principal catalyst for this upswing is the exceptional appreciation of the value of ADA, Cardano's native token, as incited by the CPI report. Following a significant downward trend spanning the previous five days, the price of ADA surged 4.2% in a single trading session.
The CPI report, which revealed an inflation rate marginally below expectations, incentivized traders to reinforce their projections regarding forthcoming interest rate reductions by the Federal Reserve. The sentiment above reinforced the upward trajectory of Cardano's market performance.
Cardano Price Prediction Technical Analysis
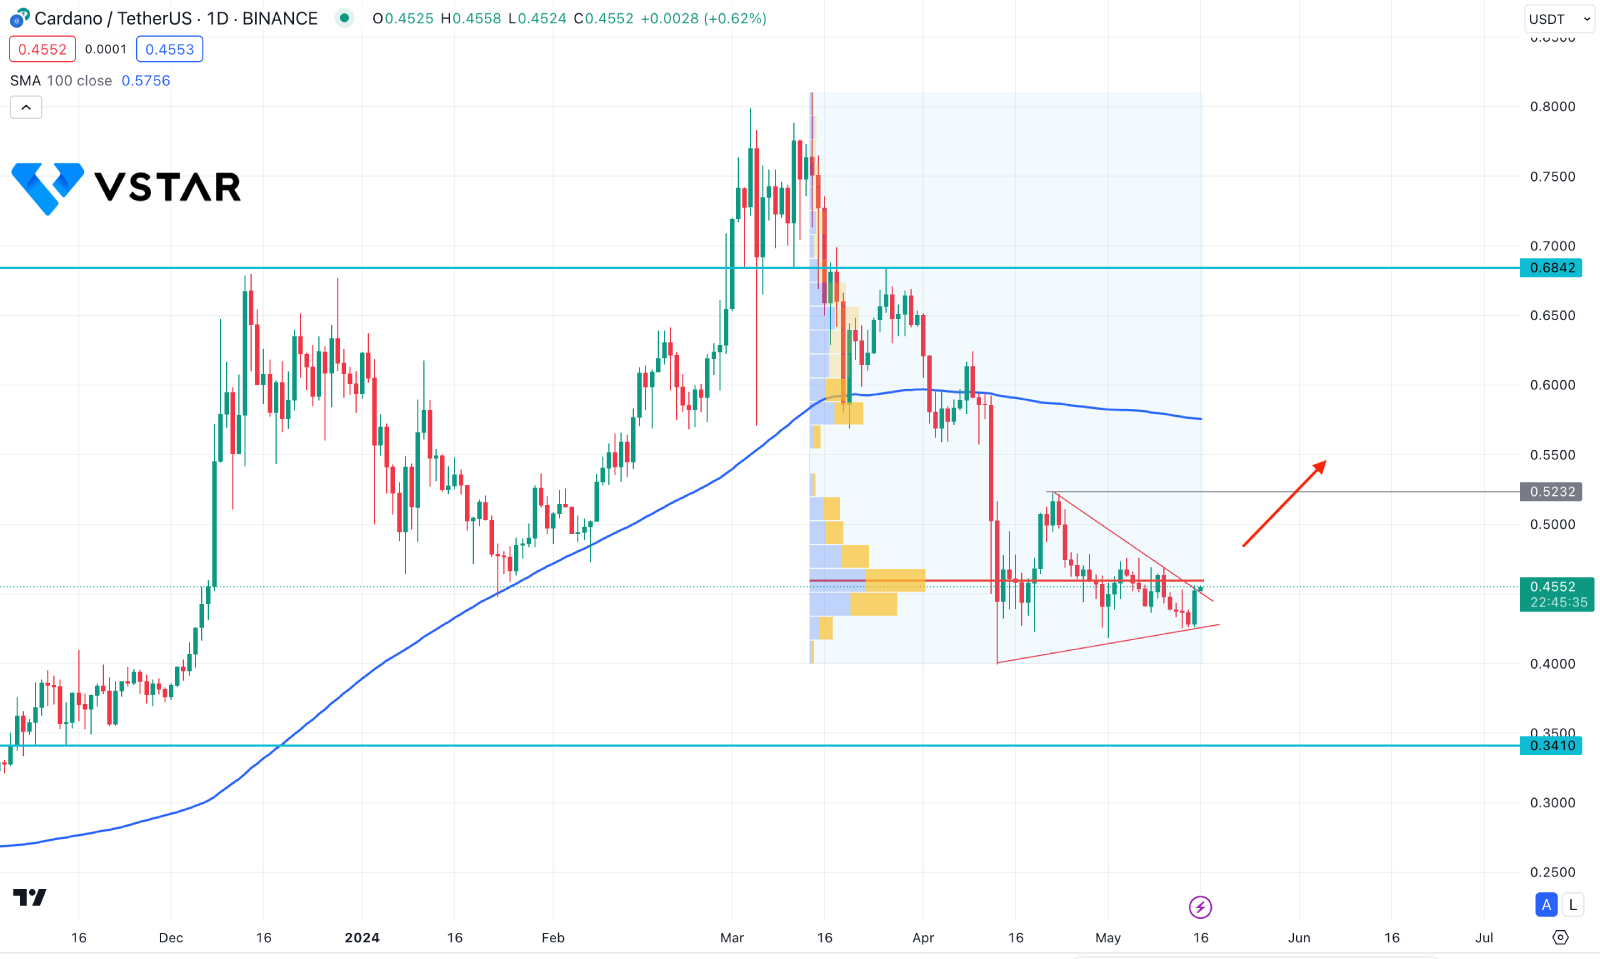
In the daily chart, the ADAUSD is trading sideways, where the most recent price trades within a symmetrical triangle.
In the main chart, the 100-day Simple Moving Average line is above the current price with a neutral momentum. It indicates less selling pressure in the market, creating an opportunity to perform an upward correction before continuing lower.
Moreover, the high volume level since 16 March 2024 is above the current price, working as an immediate resistance. As the current price hovers at the trendline resistance, a buy side pressure with a valid breakout above the high volume line could be a potential long signal.
On the other hand, a bullish liquidity sweep from the trendline resistance with an immediate bearish daily candle below the 0.4262 level could lower the price toward the 0.3410 support level.


