


Chainlink released the second iteration of its staking program for LINK holders on November 28. A considerable proportion of version 1 stakers promptly converted their assets to the upgraded iteration within 24 hours of the release. This led to a substantial outflow of LINK tokens from exchanges.
Chainlink Staking V.2 Supports LINK Bulls
Staking functions as an essential undertaking for Chainlink, fortifying the security of the blockchain network. By actively endorsing Chainlink's Oracle service, LINK holders can receive rewards. Chainlink staking v0.1 featured a staking pool of 25 million tokens, all allocated to bolster the security of the ETH/USD data flow on the Ethereum blockchain.
Version 2.0 has featured an increased pool size of 45 million LINK tokens. This revised iteration expands stakeholders' range to participate and streamlines the migrating priorities from the earlier version.
It would appear that the staking initiative has generated a bullish outlook among LINK holders. Santiment data indicates that LINK holdings on exchanges have decreased to 15.04% of Chainlink's total supply, the lowest level since February 2020.
The lower LINK supply indicates a positive price prediction for LINK, but a precious investment opportunity comes from the price analysis.
LINKUSD Technical Analysis
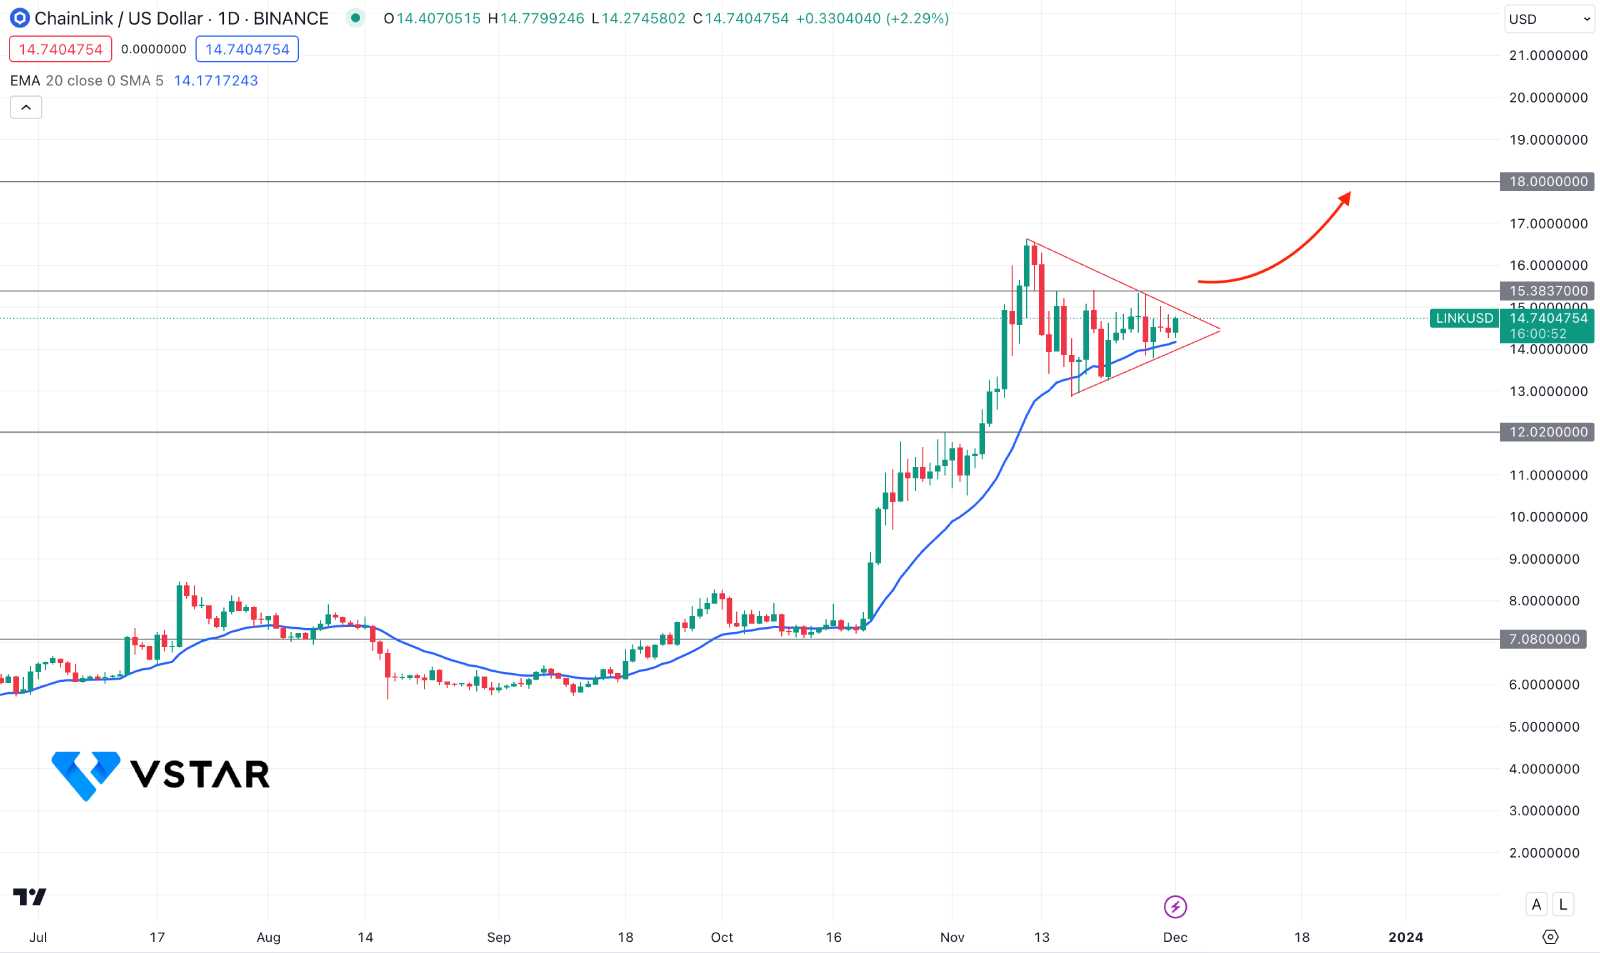
In the daily chart of LINKUSD, the market momentum is bullish, supported by a bullish pennant pattern formation. Primarily, a bullish breakout from the triangle resistance could be a potential long opportunity in this token.

The dynamic 20 EMA is acting as an immediate support by remaining below the triangle low. Moreover, the 14-day RSI is sideways above the 50.00 neutral line, which works as a confluence bullish signal.
Based on this outlook, a daily close above the 15.38 resistance level could be a potential long opportunity, where the main aim is to test the 18.00 psychological level.
On the other hand, a downside correction is possible, but a bearish daily close below the 12.02 low could initiate a consolidation before forming another buying setup.


