


Since September, an upward trend has been visible in the Chainlink price, culminating in an impressive 60% increase over the previous thirty days. The price has decreased by 2% daily, giving a chance of an imminent further decline.
In recent times, Santiment data indicates that the 200 largest wallets on Chainlink collectively possess 40.18 million LINK tokens calculated at the current price of $14.19 per token. Significantly, after the accumulation by these LINK whales, the asset underwent a considerable 125% surge in value over twenty-five days, ascending from $7.40 to $14.60.
Chainlink (LINK) On-Chain Metrics Analysis
Since October 17, the LINK token balance in these wallets has remained elevated consistently, which increases the possibility of a profit taking.
On the other hand, active Addresses and Network Realized Profit/Loss support this pessimistic outlook. Active addresses failed to increase proportionally with LINK's price growth, creating an underlying bearish divergence.
The Network Realized Profit/Loss metric further reinforces the bearish sentiment, which assesses whether market participants are incurring losses or gains. Profit-taking, as indicated by the chart surges, generally occurs before price corrections in the asset, indicating a decline.
The exchange flow balance offers valuable insights regarding possible selling pressure. Considerable inflows are identified every month, where the volume inflow exceeds outflows.
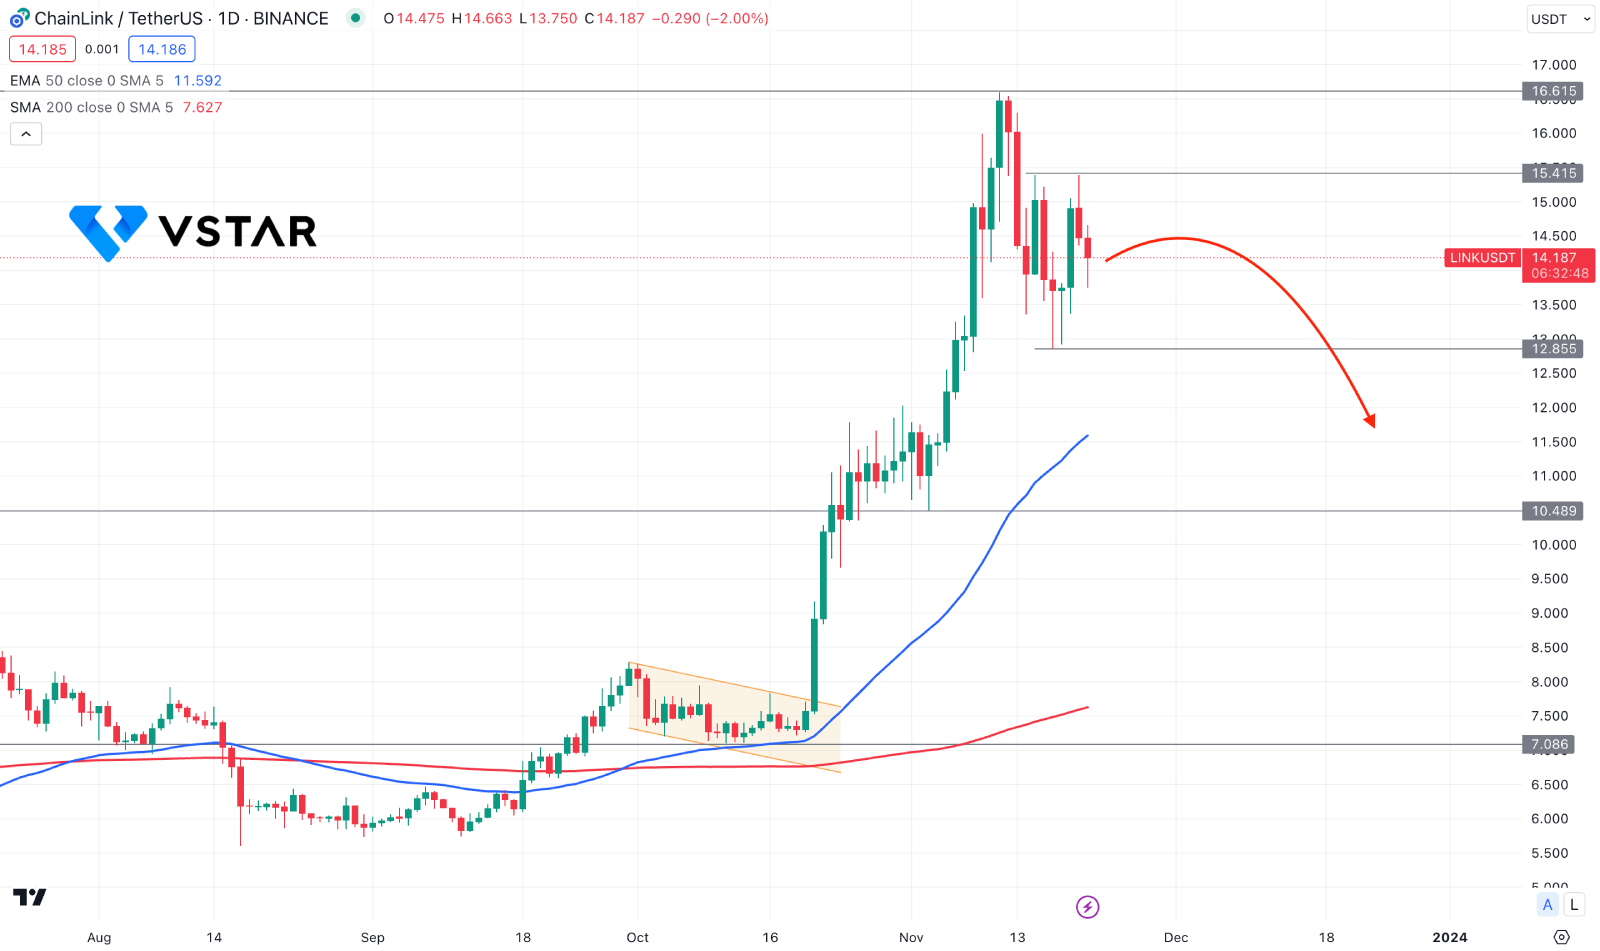
Chainlink Price (LINKUSD) Technical Analysis
In the daily chart of Chainlink price, a bullish range breakout is seen, followed by a Golden cross, which made a sharp upward pressure at the 16.61 level.

However, the recent price went sideways, where an existing downside pressure is present from the 15.41 static level. In that case, extensive downside pressure might be a correction to the broader bullish trend.
The 200-day Simple Moving Average level is at 7.62 level, which could work as the major support for this pair. Therefore, any rebound is possible as long as the price trades above this level.
Investors should monitor how the price trades at the 12.86 and 10.48 static levels as a bullish rebound is possible from these prices.
The alternative trading approach is to find an immediate bullish pressure from the 15.41 level and have a daily close above it, which could resume the broader bullish trend towards the 25.00 psychological area.


