


- Latest EIA Data indicates increased refinery inputs and decreased crude oil inventories, possibly signaling rising demand for crude oil.
- Fluctuating gasoline and distillate inventories hint at shifting consumer preferences, impacting CFD prices differently.
- Declines in WTI crude oil and retail fuel prices suggest short-term oversupply or subdued demand.
Understanding the recent EIA statistics for crude oil markets unveils fluctuations in inventories, refining activities, and price trends. For investors and traders eyeing CFDs on crude oil, interpreting these dynamics objectively becomes essential to gauge potential shifts in supply, demand, and their influence on market direction.
Analysis of EIA Data
Production and Imports:
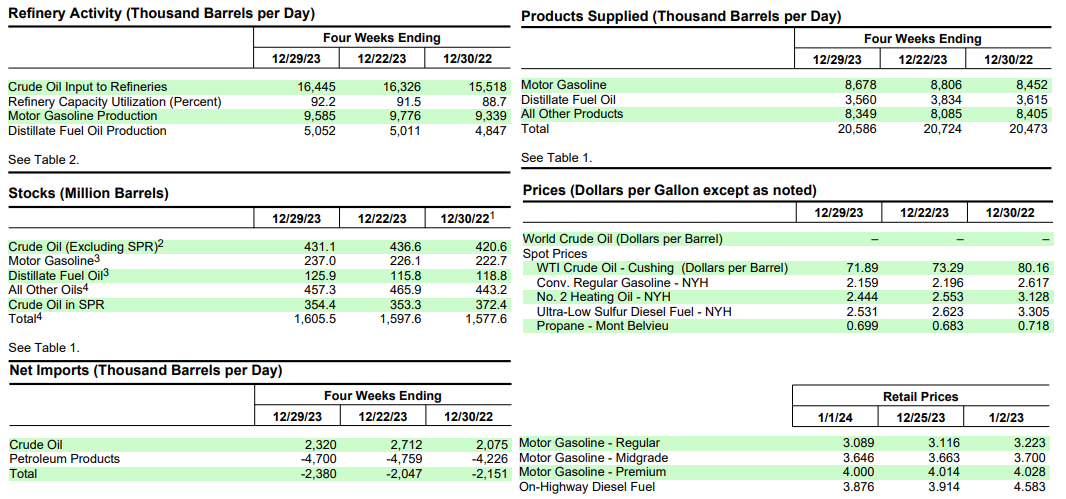
The average U.S. crude oil refinery inputs of 16.7 million barrels per day for the week ending December 29, 2023, signify a notable increase of 121 thousand barrels per day from the previous week. This surge in refinery activity points to a potential uptick in demand for crude oil to sustain heightened production levels. Refineries operated at 93.5% of their operable capacity, underscoring the robustness of the refining sector.
Gasoline production experienced a decrease, averaging 8.8 million barrels per day, while distillate fuel production increased to 5.2 million barrels per day. This contrasting trend in the production of two significant petroleum products suggests a dynamic shift in market demands, potentially impacting the price of CFDs on crude oil differently based on the individual demand for gasoline and distillate fuels.
U.S. crude oil imports saw a noteworthy rise, averaging 6.9 million barrels per day, reflecting an increase of 619 thousand barrels per day from the previous week. Over the past four weeks, crude oil imports averaged about 6.6 million barrels per day, registering a 7.0% growth compared to the same four-week period last year. This surge in imports implies either an increased demand for crude oil or a need to supplement domestic production, influencing the overall market dynamics.
Source: EIA.gov
Inventories:
U.S. commercial crude oil inventories, excluding those in the Strategic Petroleum Reserve, decreased by 5.5 million barrels from the previous week. At 431.1 million barrels, these inventories are approximately 2% below the five-year average for this time of year. The decline in crude oil inventories signals a potential tightening of supply, which can have a bullish effect on crude oil prices.
Total motor gasoline inventories, in contrast, increased by 10.9 million barrels from the previous week, slightly surpassing the five-year average for this time of year. The nuanced relationship between crude oil and gasoline inventories suggests a complex interaction between supply and demand for these related commodities. Finished gasoline inventories decreased, while blending components inventories increased, adding layers of complexity to the market dynamics.
Distillate fuel inventories increased by 10.1 million barrels last week, positioning them about 6% below the five-year average for this time of year. The decrease in distillate fuel inventories could be a response to shifting consumer demands or industrial requirements, potentially impacting the price of CFDs on crude oil, given the interconnectedness of these markets.
Consumption and Prices:
Total products supplied over the last four-week period averaged 20.6 million barrels a day, indicating a 0.6% increase from the same period last year. This marginal growth in total product supply suggests sustained demand, with motor gasoline product supplied averaging 8.7 million barrels a day, up by 2.7% from the same period last year. Distillate fuel product supplied, however, averaged 3.6 million barrels a day over the past four weeks, marking a 1.5% decrease from the same period last year. Jet fuel product supplied experienced a 2.1% increase compared to the same four-week period last year, adding further complexity to consumption trends.
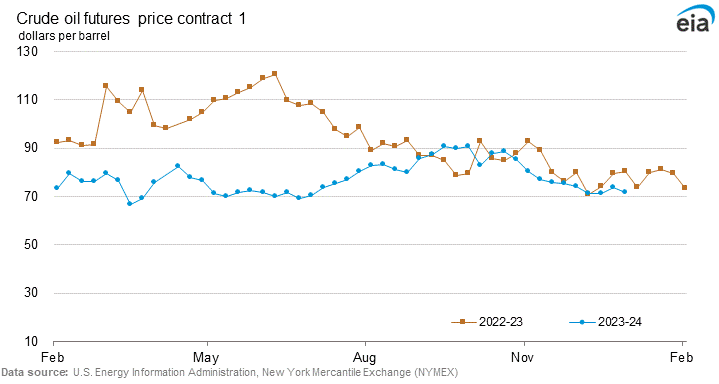
The West Texas Intermediate crude oil price stood at $71.89 per barrel on December 29, 2023, reflecting a $1.40 decrease from the previous week and an $8.27 decline from the year-ago price. The spot prices for conventional gasoline and No. 2 heating oil also witnessed declines, indicating a broader downward trend in energy prices.
The national average retail price for regular gasoline fell to $3.089 per gallon on January 1, 2023, registering a $0.027 decrease from the previous week and a $0.134 decrease from the price a year ago. The national average retail diesel fuel price dropped $0.038 to $3.876 per gallon, marking a $0.707 decrease from the year-ago price.
Finally, Crude Oil Futures prices may continue to experience seasonal weakness in coming days.
Source: EIA.gov
Possible Implications on Price of CFDs on Crude Oil
Supply-Demand Dynamics:
The decrease in U.S. crude oil inventories and the simultaneous increase in refinery inputs suggest a potential imbalance between supply and demand. The tightening of crude oil inventories, coupled with elevated refinery activity, may signal an increasing demand for crude oil. This could potentially drive the price of CFDs on crude oil higher as traders anticipate a more competitive market for the commodity.
The rise in crude oil imports, both on a weekly basis and over a four-week period, indicates either a robust demand scenario or a need to supplement domestic production. Investors in CFDs on crude oil need to closely monitor these import trends, as sustained high levels could put downward pressure on prices, considering the potential oversupply in the market.
Product-Specific Dynamics:
The mixed changes in inventories of gasoline and distillate fuels add layers of complexity to predicting the direction of CFD prices on crude oil. While gasoline inventories increased, potentially signaling stable or growing demand for gasoline, distillate fuel inventories decreased. This divergence suggests shifting consumer preferences or industrial requirements, impacting the price dynamics of CFDs on crude oil differently based on the specific products' demand.
Price Trends:
The decline in WTI crude oil prices to $71.89 per barrel, along with reductions in gasoline and heating oil spot prices, may indicate short-term oversupply or subdued demand conditions. Investors in CFDs on crude oil should closely monitor these trends, as sustained decreases could signal a bearish market sentiment, influencing trading strategies.
Retail fuel prices, reflective of consumer-facing costs, also experienced declines. The national average retail price for regular gasoline and diesel fuel dropping below previous levels and the year-ago prices might influence consumer behavior and impact overall demand for these products.
Market Response:
Traders and investors are likely to react to the decrease in crude oil inventories and the increase in refinery inputs as potential indicators of rising demand. However, sustained or increased imports, coupled with fluctuations in specific product inventories, could balance these expectations. As a result, predicting the future price movements of CFDs on crude oil requires a comprehensive understanding of the market dynamics.
The overall market response will depend on how traders interpret the intricate relationships between production, inventories, consumption, and prices. Market sentiment can shift based on the perceived strength or weakness of these factors, influencing trading decisions on CFDs on crude oil.
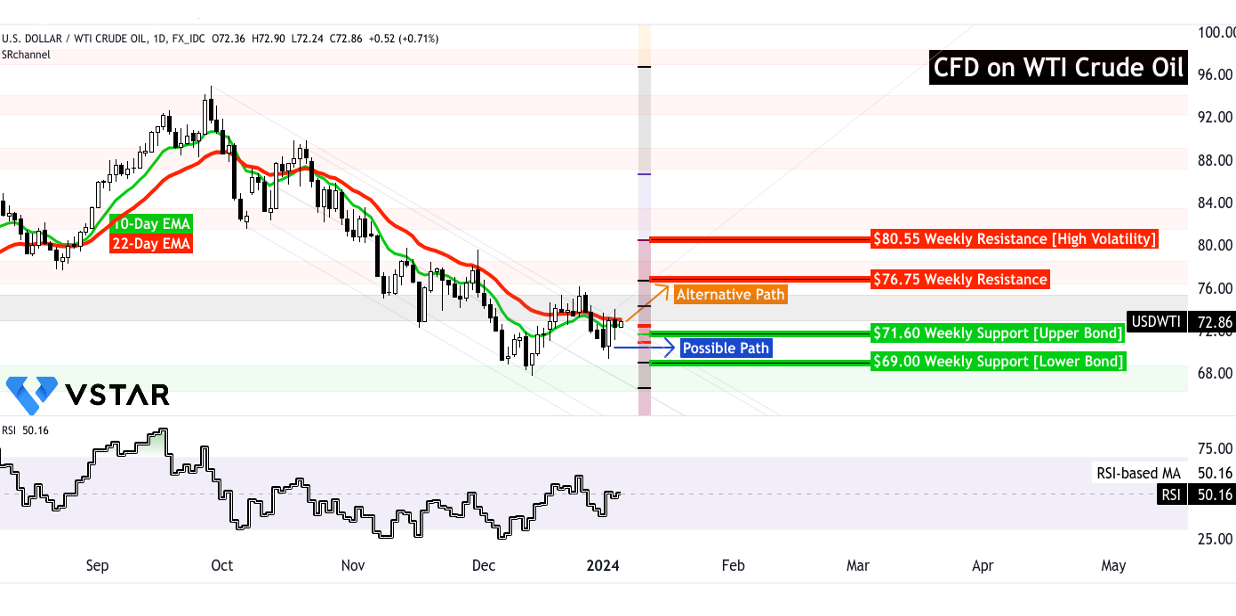
CFDs on Crude Oil (USOUSD): Technical Take
The price of CFDs on crude oil may remain stable in the coming days, as marked by the blue arrow. If this materializes, then $71.60-$69 may serve as a critical support range to establish long-term positions. The 10-day exponential moving average (EMA) and 22-day EMA are still signaling a downtrend. The crossover of the moving averages may serve as a critical trend identifier in the coming days.
On the upside, if the price rises (say based on reduced inventory), such as in the case of $76.75, it may hold the price from going up through strong resistance. In cases of heightened volatility, $80.55 can be considered a major resistance.
The Relative Strength Index is in a neutral state but may proceed towards an overbought level. Overall upward price movements can be expected (less likely) in the coming days, but technically, price is still in a downtrend and may continue to move sideways in the support zone.

Source: tradingview.com
In conclusion, While indications of rising demand from increased refinery inputs and reduced inventories suggest a potential upward price trajectory for CFDs on crude oil, the market's uncertainty, marked by fluctuating product inventories and declining prices, leaves the direction ambiguous.


