


- Mixed Indicators: EIA weekly data reveals varying trends in refinery inputs, production, and inventories, creating uncertainty in crude oil price direction.
- Demand Shifts: Fluctuations in gasoline vs. distillate fuel production hint at changing consumer demands, impacting crude oil market dynamics.
- Inventory Insights: Increased crude oil inventories and decreased product supply may pressure prices downward in the short term.
- Consumer Influence: Lower retail fuel prices reflect subdued demand, potentially impacting CFD prices for crude oil.
Amidst shifting refinery outputs, supply fluctuations, and changing consumer behaviors, the trajectory of crude oil prices remains enigmatic. Analyzing Energy Information Administration (EIA) Weekly Petroleum Status Report) unveils a complex narrative of supply-demand dynamics, inventory shifts, and consumer sentiments shaping the turbulent landscape of CFDs on crude oil.
1. Refinery Inputs and Capacity
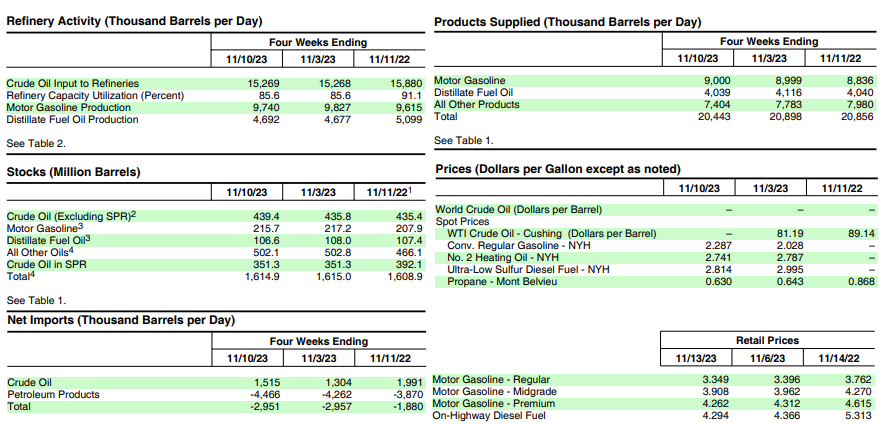
The EIA data indicates that U.S. crude oil refinery inputs averaged 15.4 million barrels per day, showing a slight increase of 164 thousand barrels per day from the previous week. Refineries operated at 86.1% of their operable capacity.
Implications:
Increased Demand for Processing: The uptick in refinery inputs suggests a marginal rise in demand for crude oil processing. Refineries operating at over 80% capacity indicates healthy utilization but not at maximum capacity.
Potential for Increased Crude Oil Consumption: Higher refinery inputs might indicate an underlying demand for refined petroleum products. This could imply a positive outlook for crude oil consumption, possibly impacting CFD prices upward as demand for crude rises.
Source: eia.gov
2. Gasoline and Distillate Fuel Production
Gasoline production decreased to an average of 9.4 million barrels per day, while distillate fuel production increased to 4.8 million barrels per day.
Implications:
- Changing Demand Trends: Decreased gasoline production coupled with increased distillate fuel production may signal a shift in demand patterns. This shift could be influenced by factors like changes in consumer preferences, economic activities, or seasonal variations.
- Potential Impact on Price: While gasoline production decreased, an increase in distillate fuel production might impact the prices of crude oil differently. If there's increased demand for distillate fuels, it could support crude oil prices due to higher demand in refining.
3. Crude Oil Imports
U.S. crude oil imports averaged 6.4 million barrels per day, decreased by 21 thousand barrels per day from the previous week. Over the past four weeks, imports averaged about 6.3 million barrels per day, 3.3% more than the same period last year.
Implications:
- Slight Decline in Weekly Imports: The marginal decrease in weekly crude oil imports might indicate short-term fluctuations in demand or supply dynamics. However, the increase over the four-week period compared to the previous year suggests a slightly higher long-term demand for imported crude.
- Potential Price Impact: The weekly decrease in imports might not significantly affect prices immediately, but the overall higher average imports over a more extended period might contribute to stabilizing or slightly lowering crude oil prices due to sustained supply.
4. Crude Oil Inventories
U.S. commercial crude oil inventories increased by 3.6 million barrels from the previous week, totaling 439.4 million barrels, approximately 2% below the five-year average. Gasoline and distillate fuel inventories decreased while propane/propylene inventories increased notably.
Implications:
- Inventory Levels: The increase in crude oil inventories suggests a surplus in the market, albeit slightly below the five-year average. Decreases in gasoline and distillate fuel inventories may imply ongoing consumption.
- Market Stability and Price Influence: The surplus in crude oil inventories, coupled with slight deficits in gasoline and distillate fuel inventories, might not exert immediate pressure on prices. However, sustained increases in crude oil inventories beyond the five-year average could potentially lead to downward price pressure.
5. Product Supply and Demand
Total products supplied over the last four weeks averaged 20.4 million barrels per day, down by 2.0% from the same period last year. Motor gasoline product supplied increased slightly, while distillate fuel product supplied remained relatively unchanged. Notably, jet fuel product supplied increased by 14.0% compared to the same period last year.
Implications:
- Changing Consumption Patterns: The overall decrease in total products supplied might suggest a minor decline in overall consumption compared to the previous year. However, the significant increase in jet fuel demand might reflect specific sectoral changes.
- Price Impacts: While the slight increase in gasoline supply may support crude oil prices to some extent, the overall decrease in total products supplied could create downward pressure on crude oil prices due to reduced overall demand.
6. Retail Prices
The national average retail price for regular gasoline decreased to $3.349 per gallon on November 13, 2023, $0.047 less than a week ago, and $0.366 less than the year-ago price. The national average retail diesel fuel price declined to $4.294 per gallon, $0.072 less than the previous week and notably lower compared to the price last year.
Implications:
- Consumer Demand and Market Sentiment: Decreases in retail prices for gasoline and diesel fuel compared to both the previous week and the previous year might reflect subdued consumer demand or market sentiment favoring lower fuel prices.
- Price Direction Influence: Lower retail fuel prices can indicate reduced demand for crude oil in the short term, potentially exerting downward pressure on CFD prices for crude oil.
Overall Price Direction Analysis
- Supply-Demand Balance: The mixed signals in the EIA data present an ambiguous outlook for crude oil prices. While increased refinery inputs and potential shifts in demand for refined products might support prices, higher inventories and lower overall product supply could exert downward pressure.
- Market Sentiment: Consumer behaviors indicated by retail prices might suggest a subdued demand scenario, contributing to a downward trend in crude oil prices.
- Longer-Term Trends vs. Weekly Fluctuations: Longer-term trends like increased imports compared to the previous year and refinery utilization rates may have a more substantial impact on price trends compared to weekly fluctuations in inventories or production.
- External Factors: Geopolitical events, global economic conditions, and environmental policies could significantly influence crude oil prices beyond the scope of the provided EIA data, contributing to price volatility.
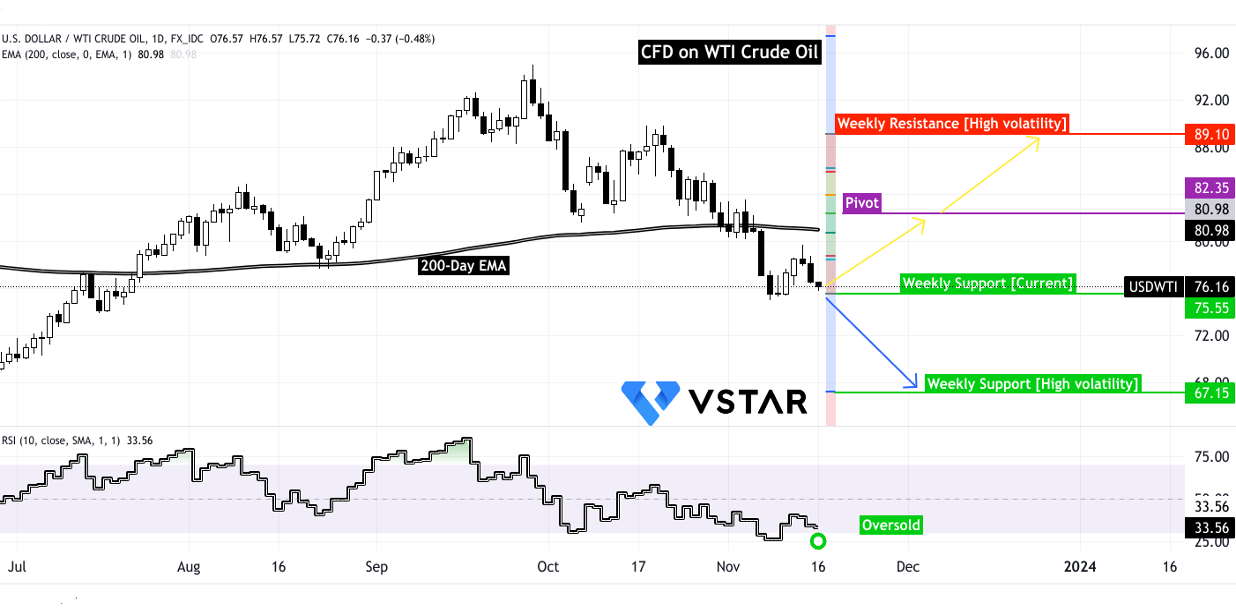
Crude Oil (WTI) Technical Take
From a technical standpoint, crude oil CFD prices have reached a crucial support level. Two potential weekly projections have emerged:

Source: tradingview.com
The first scenario (yellow) suggests a sideways movement between the pivot and the current weekly support. The RSI indicates oversold prices, while the 200-day EMA near the pivot signals potential limited upside. However, given ongoing geopolitical turbulence, prices could surge to $89.10 due to heightened volatility.
Contrarily, the second scenario (blue) predicts that the prices may follow a downward movement towards $67.15, attributed to demand-supply dynamics influenced by warmer-than-average winter.
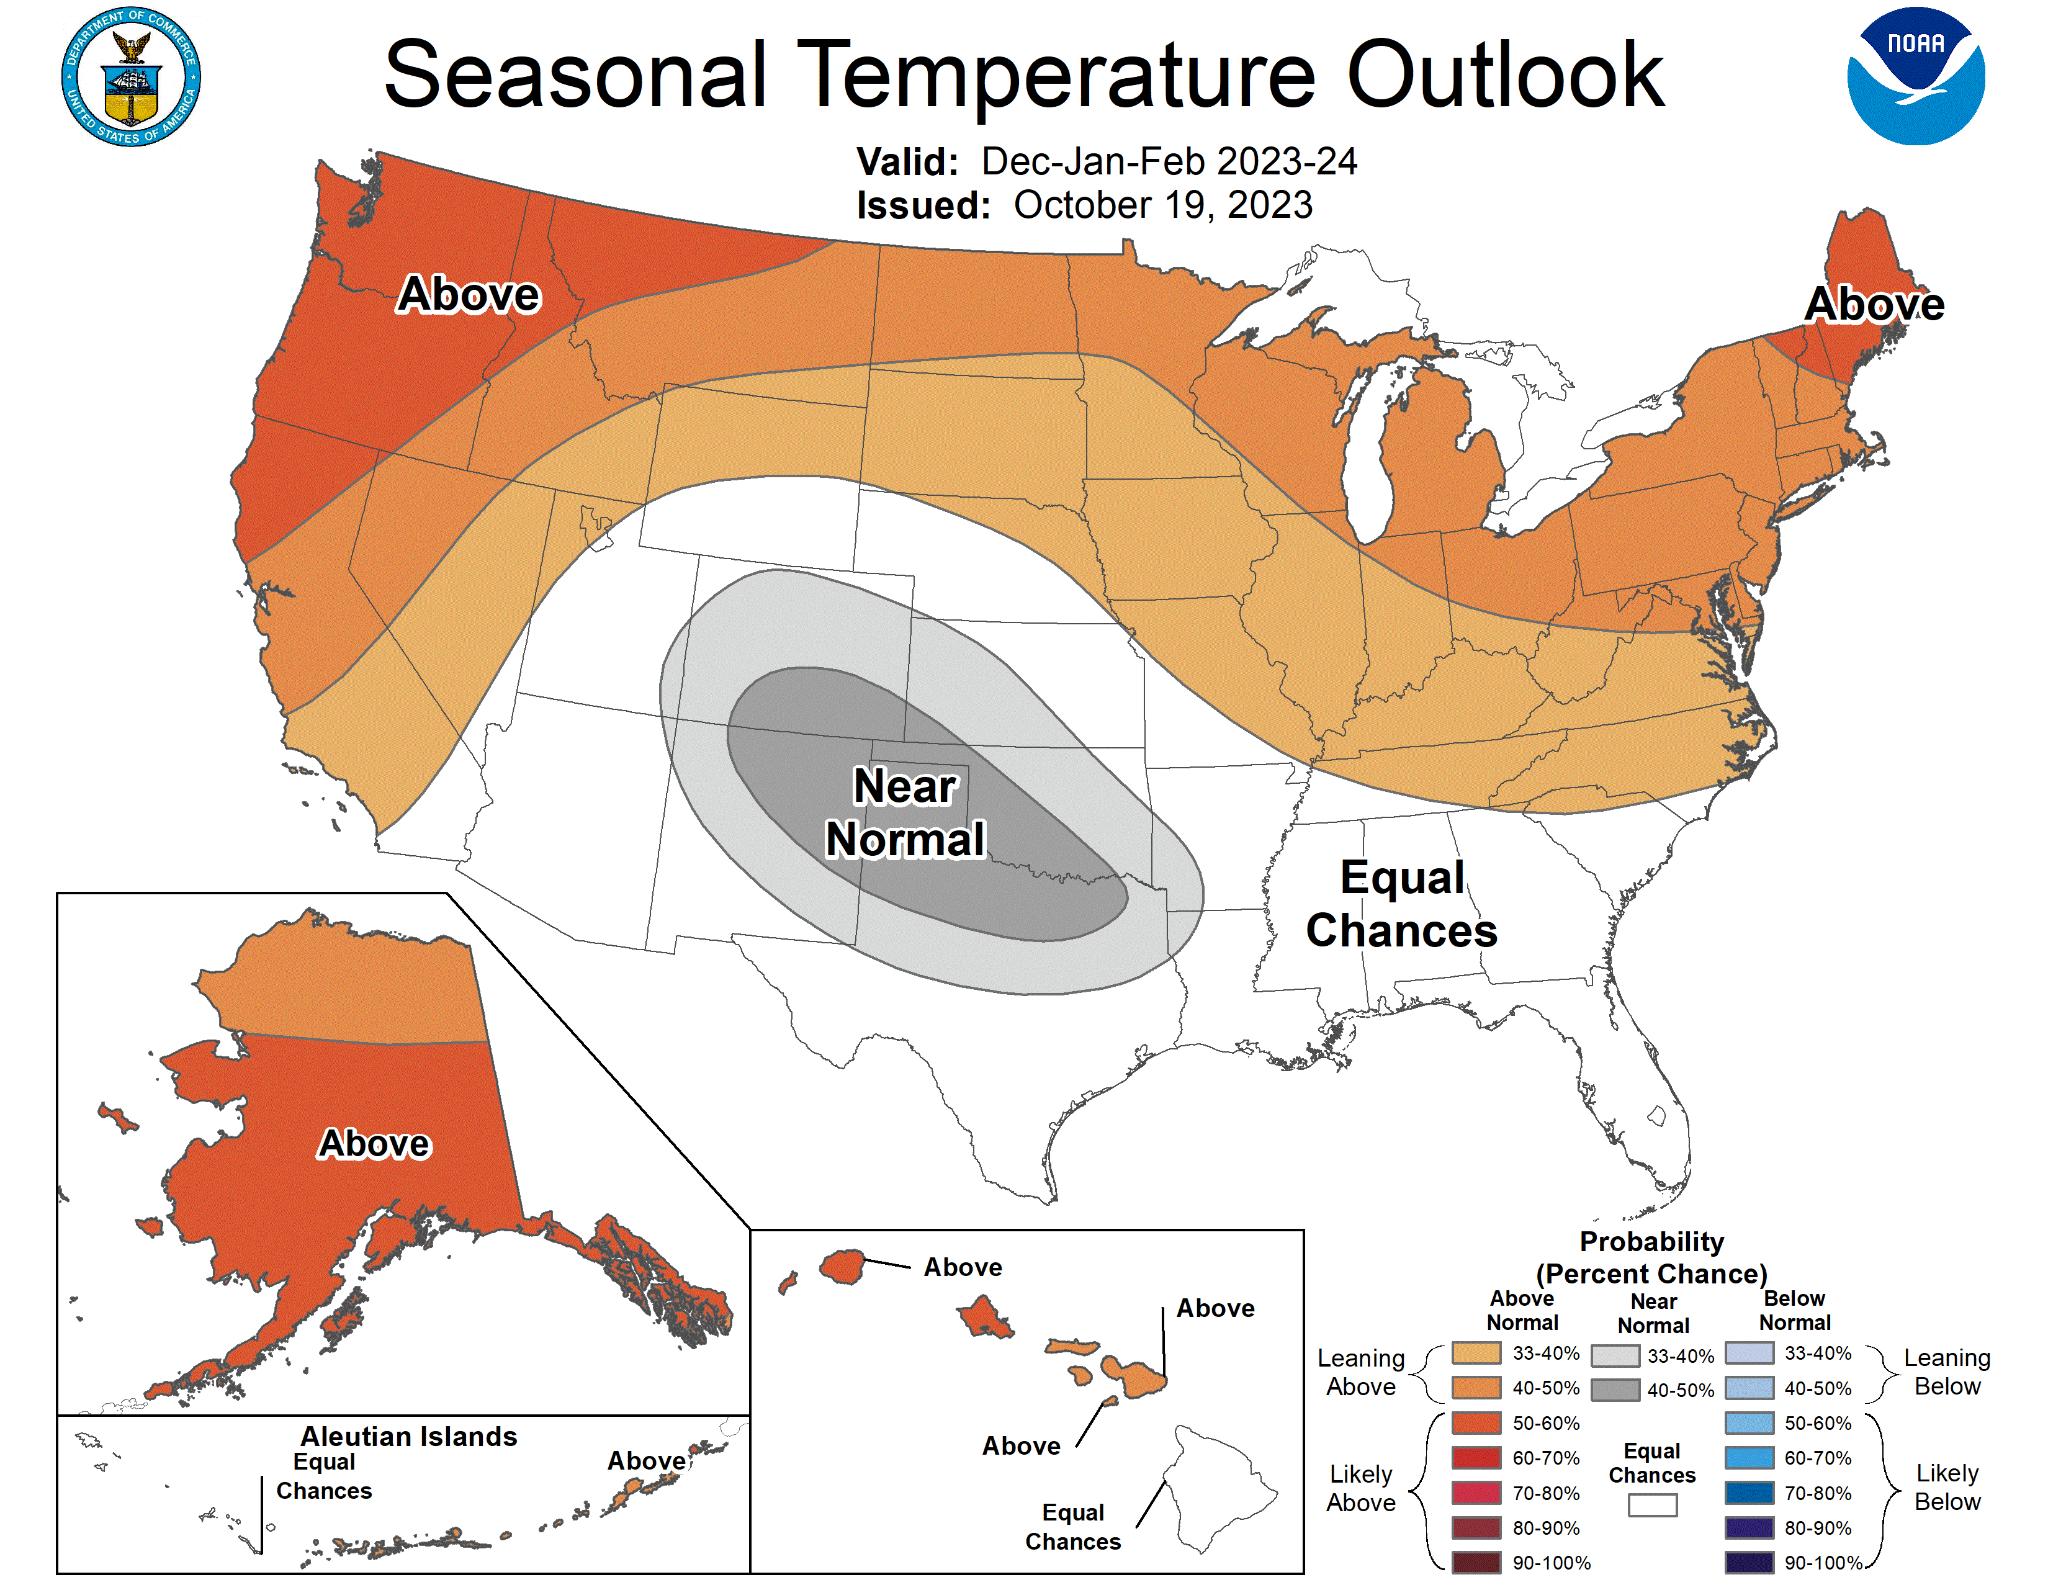
Source: noaa.gov
In conclusion, the analysis of the EIA data on crude oil fundamentals reveals a complex interplay of various factors impacting the price direction of CFDs on crude oil. While increased refinery inputs and potential shifts in demand for refined products might support prices, higher inventories, decreased total product supply, and lower retail fuel prices could exert downward pressure on crude oil prices in the near term. The overall outlook remains uncertain due to conflicting signals in supply, demand, inventory levels, and consumer behaviors.


