


As supply concerns related to escalating tensions in the Middle East, oil prices declined by more than 2% on Friday. Employment data fueled anticipations that the U.S. Federal Reserve might halt interest rate increases in the largest oil-consuming economy.
US Employment Might Have Peaked
In October, official data indicated that wage inflation and U.S. employment growth both decelerated, contrary to initial projections. These figures suggest that labor market conditions have eased. This further strengthened the perception that the Federal Reserve might not be required to increase interest rates.
Last week, both the Federal Reserve and the Bank of England maintained interest rates at a 15-year high, which bolstered oil prices as a measure of risk tolerance returned to the markets.
Nevertheless, according to a survey conducted by the private sector on Friday, China's services sector expanded marginally more rapidly in October than sales growth. Moreover, employment remained stagnant as business confidence declined. The National Bureau of Statistics released this information on Wednesday, revealing an unforeseen decline in manufacturing activity in October.
Can Middle-East Tension Boost The Oil Price?
Regarding the supply side, analyst forecasts indicate that Saudi Arabia will reaffirm its voluntary decision to reduce oil production by one million barrels daily through December.
Strong bipartisan support through the bill in the U.S. House of Representatives to strengthen sanctions on Iranian oil. However, the legislation's potential effectiveness through the law is still uncertain. In addition, China might maintain its oil imports despite the imposition of fresh sanctions.
Moreover, according to energy services firm Baker Hughes, the number of operational oil and natural gas platforms by U.S. energy companies decreased this week to its lowest level since February 2022.
Crude Oil (WTI) Technical Analysis
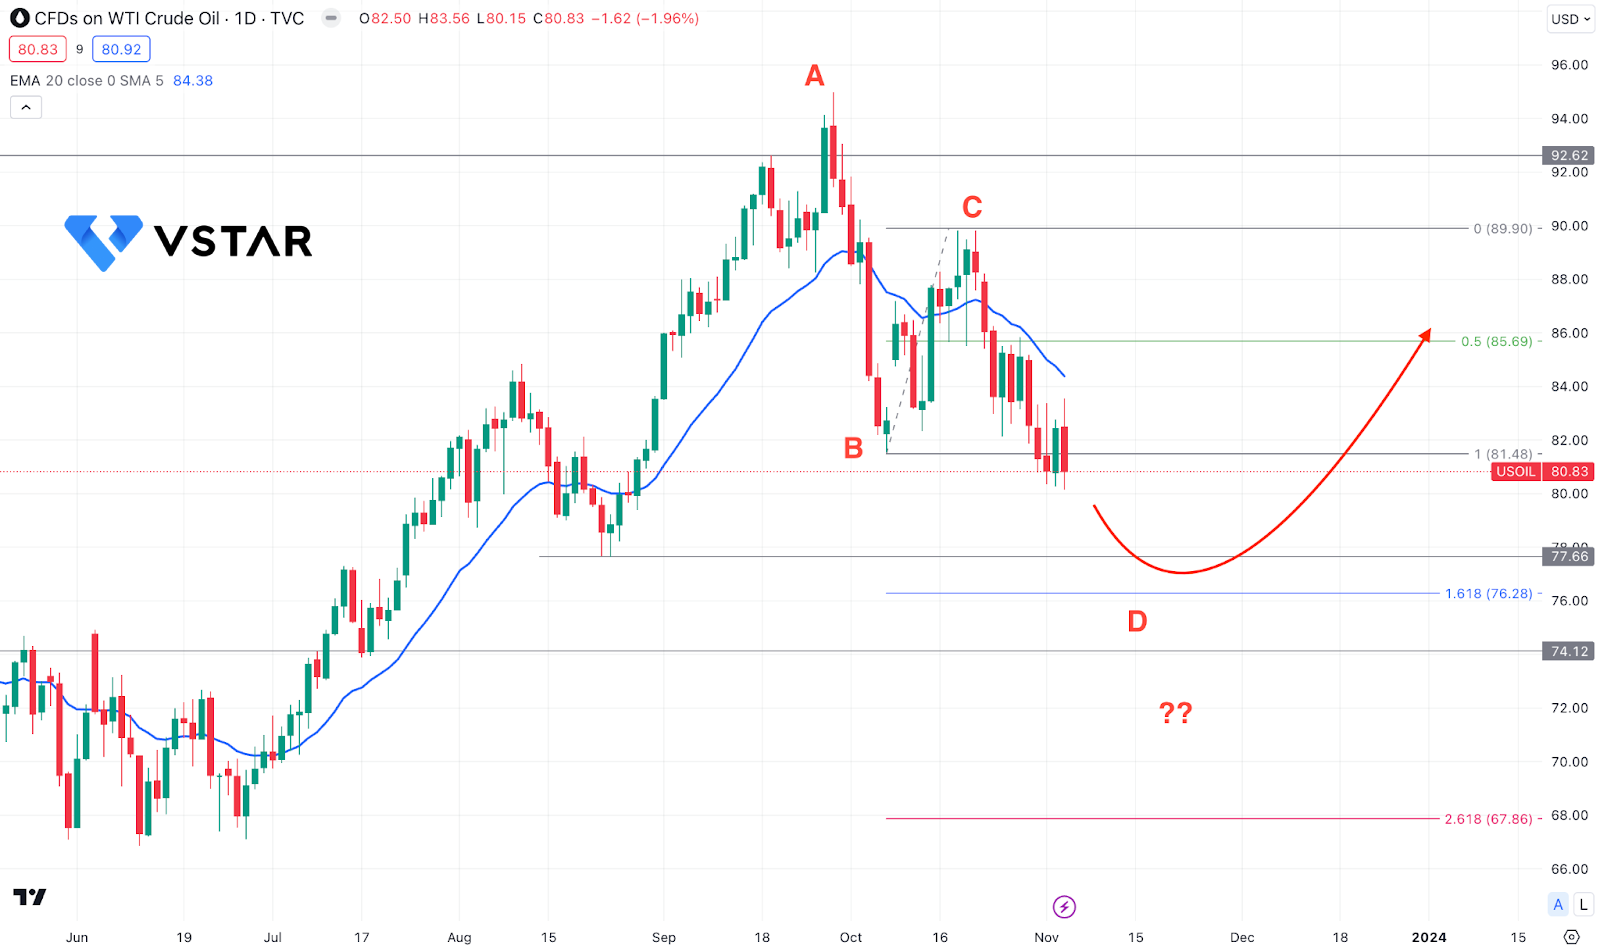
In the daily chart of crude oil price, the overall market trend is bullish, where a higher highs above 92.62 with immediate selling pressure indicates sellers' presence at the top.
However, the 77.66 is a crucial bottom of an existing rally-base-rally formation, which is still intact. In that case, the upward pressure is possible until the price moves down below this level with a bearish pressure.
On the other hand, the potential ABCD pattern could work as an important trend continuation opportunity, which needs proper validation by tapping at the 76.28 level with a bullish trendline breakout.
Based on this outlook, the downside pressure is still valid, which can extend towards the 77.66 to 76.20 area. However, a solid bottom formation and a stable price above the dynamic 20-day EMA could offer a long-term bullish trend continuation opportunity.


