
欧元兑美元
基本面视角
即将到来的本周经济日历充斥着可能对美元产生重大影响的重大事件。其中,可能影响其短期走势的最关键因素是周二上午发布的美国 11 月消费者价格指数报告以及定于周三下午发布的美联储货币政策公告。
过去一个月,美联储的利率前景明显转向更加温和的立场。市场目前预计未来 12 个月将实施约 100 个基点的宽松政策。尽管上个月的就业数据等强劲数据并不表明经济迫切需要央行的支持,但交易员仍坚信大幅降息即将到来。
技术视角
来源:TradingView
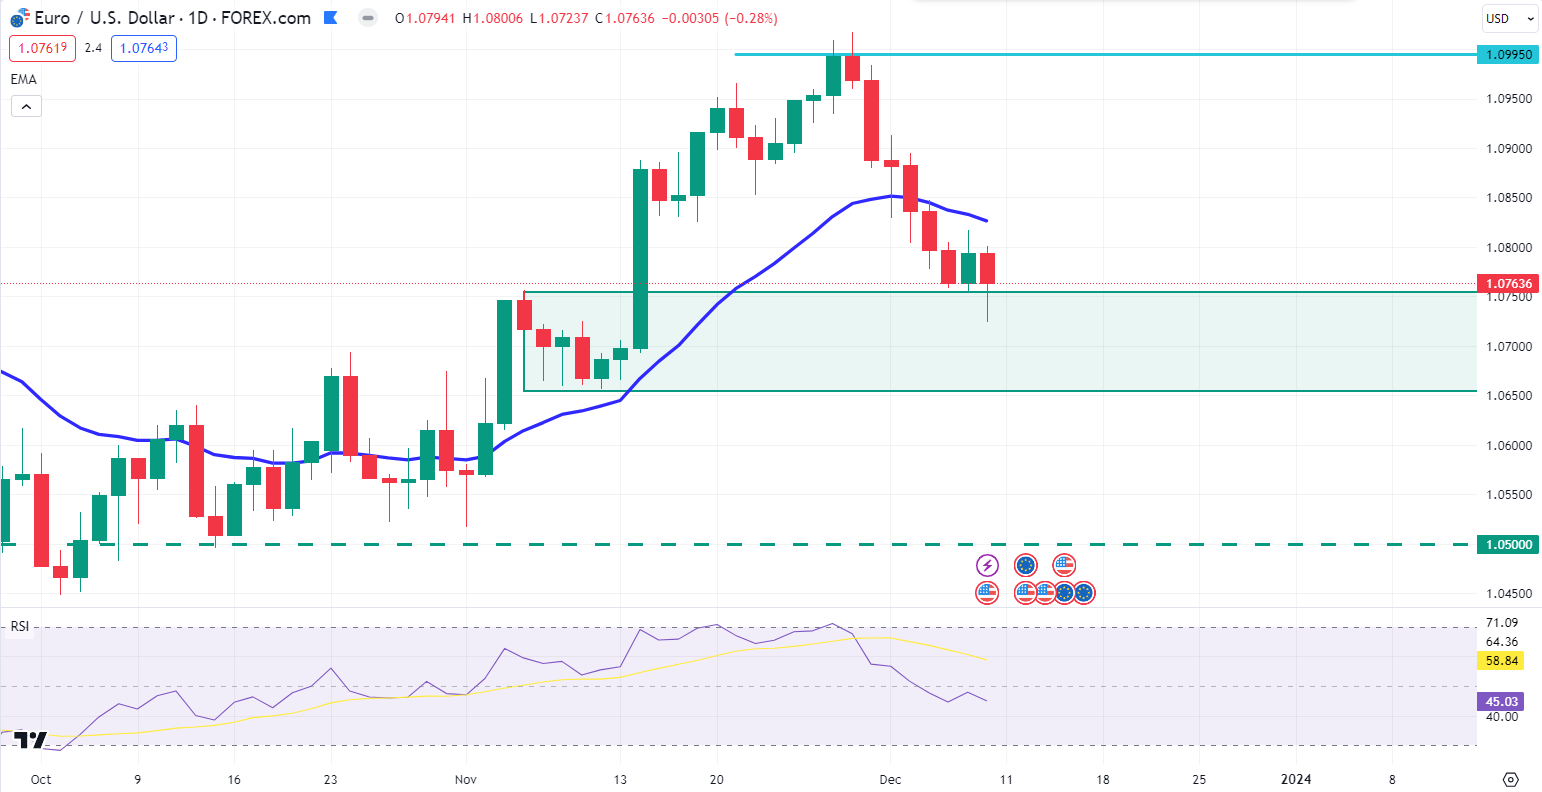
根据周线图,欧元兑美元目前位于 1.0755 - 1.0655 需求区域之上。在经历了冲动的看跌压力之后,价格在周需求区区域找到了支撑,并且周收盘价高于该区域。
在每日时间范围内,欧元兑美元在周需求区域上方面临抛售压力,在从即将发布的基本面数据中获得足够动力后,该压力可能会创下新低。从目前的情况来看,如果价格能够反弹至20 EMA动态水平上方并以看涨蜡烛收盘,多头可能会重拾动力,并在未来几天继续走高至1.0995颈线区域。
在看跌方面,如果价格能够突破需求区域并以日线看跌蜡烛收盘,空头可能会继续走低至 1.0500 支撑区域。此外,RSI指标仍位于50.00一线下方,这也表明看跌仍在继续。
英镑日元
基本面视角
日本第三季度最终数据已被下调,表明通胀对该地区的支出产生负面影响。尽管通胀率一年多来一直高于日本央行 (BoJ) 2% 的目标,但官员们仍持谨慎态度,希望在结束多年的刺激措施(包括负利率)之前获得更多证据。
日本央行行长上田一夫不断提到考虑改变的先决条件,强调通胀需要稳定且持续高于2%的目标,并预计这一趋势将持续下去。另一个条件涉及工资增长,这也需要表现出持久性。最初,上田相信,到今年年底,将有足够的数据来决定取消负利率的可能性。
然而,最近的评论表明,这一决定可能会推迟到工资谈判结束后的明年第一季度。
技术视角
来源:TradingView
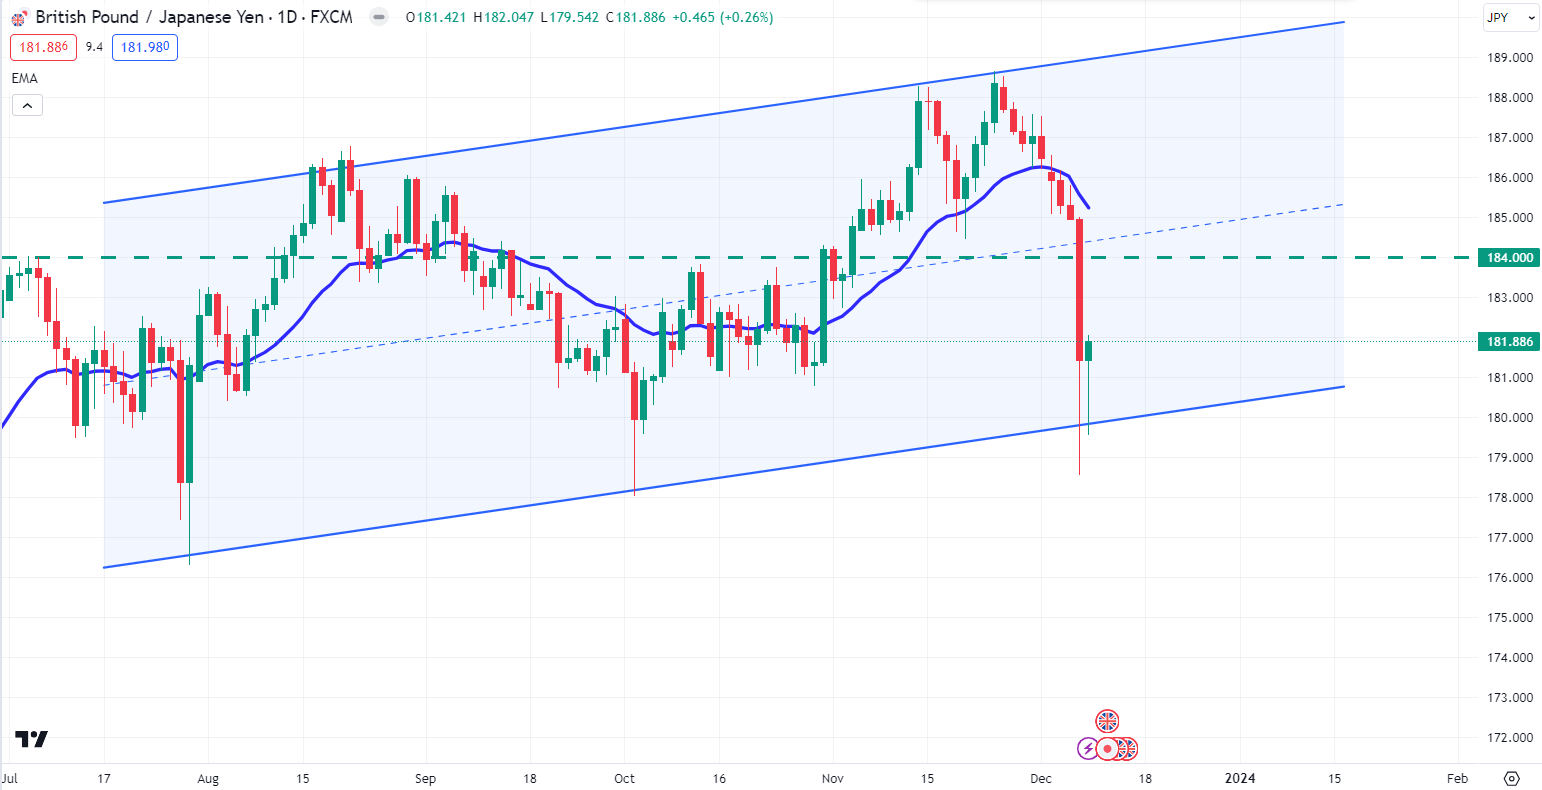
在周线图中,英镑兑日元以看跌蜡烛收盘,随后出现看跌两柱反转。在被每周看涨通道的阻力位拒绝后,空头相当冲动地压低价格并触及看涨通道的支撑位。
在日线图上,英镑兑日元在通道支撑位处出现了强烈的疲惫,这可能会减轻未来几天的一些损失。根据当前的价格走势背景,价格可能会继续走高至 184.00 价格区域。
在看跌方面,看跌日蜡烛收盘价低于通道支撑位可能会将价格推低至 178.00 水平。
纳斯达克 100 指数 (NAS100)
基本面视角
即将召开的美联储货币政策会议以及未来几天将发布的美国通胀报告可能会对股市涨势构成挑战,一些人认为股市在连续几周上涨后已经延续了涨势。
人们相信美联储可能会比预期更早开始降息,这推动了美国股市的飙升,而美国国债收益率迅速下降。标准普尔 500 指数在 2023 年上涨了近 20%,其中 11 月份创下了年度最大月度涨幅。
不过,一些投资者持谨慎态度,他们认为,如果消费者价格不继续降温,或者美联储的鸽派态度不如预期,近期股市上涨将使其更容易出现逆转。
技术视角
来源:TradingView
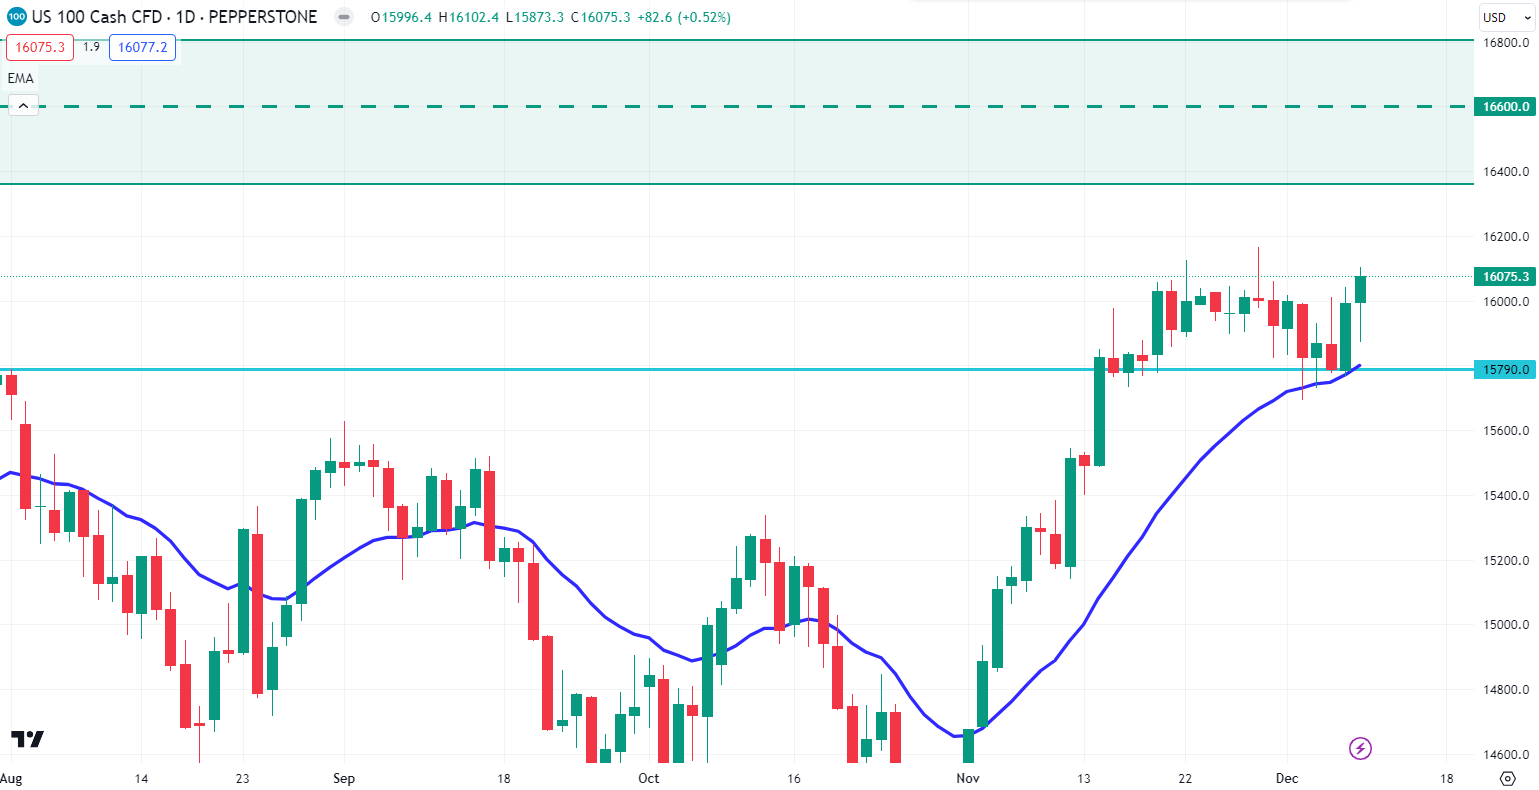
在周线图中,NAS100 以看涨的 fakey 形态收盘。此外,多头仍然乐观,并在上个月突破 15790.0 美元颈线区域后将价格保持在该区域之上。
在每日时间范围内,价格从 20 EMA 的动态水平反弹后,以日线看涨蜡烛收盘。根据目前的情况,未来几天价格可能会维持向 16600.0 美元心理关键区域的看涨压力。
在看跌方面,如果价格继续走高至 16600.0 美元阻力区域,并拒绝每日冲动看跌收盘,空头可能会在未来几天重新获得动力,并将价格推低至 15790.0 美元颈线区域。
SP500(SPX500)
基本面视角
美国股市本周收盘高位,标普 500 指数和纳斯达克指数双双创下 2022 年初以来的最高收盘水平。美国就业报告强劲,引发投资者对经济温和着陆的乐观情绪。
在劳工部报告显示11月非农就业岗位增加19.9万个(超过预期的18万个)后,投资者缩减了对美联储3月降息的预期。失业率也降至3.7%,平均收入月度增长0.4%,超过预期的0.3%增长。
芝商所 FedWatch 工具表明,利率期货反映了人们普遍预期美联储将在即将召开的会议上维持当前利率。然而,期货价格现在表明,交易员倾向于预期美联储将在 5 月降息,这与许多投资者最近几天押注的 3 月降息预期有所转变。
技术视角
来源:TradingView
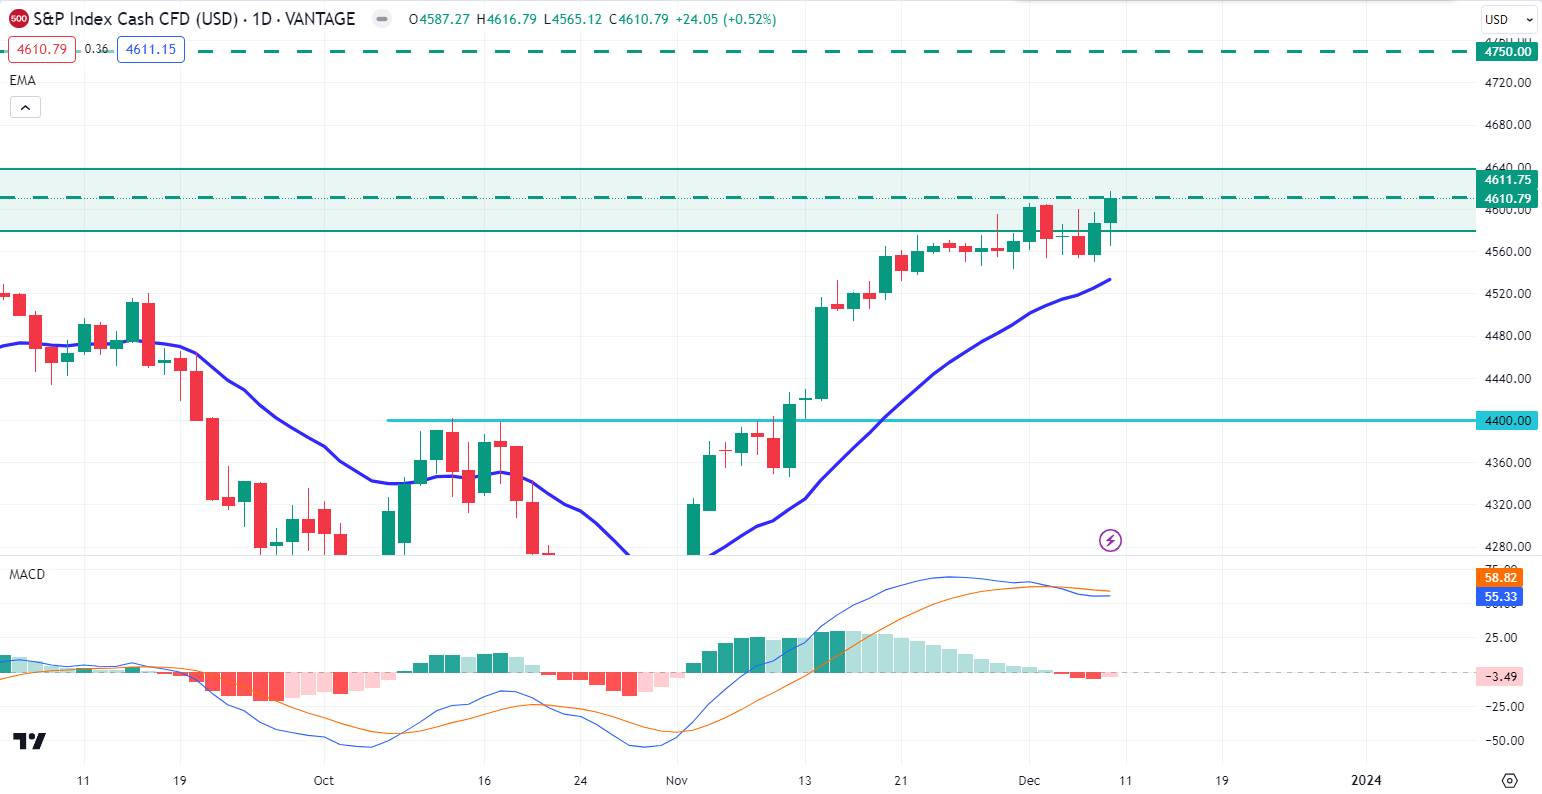
在周线图中,SP500 以看涨蜡烛结束了非农就业数据密集的一周,但未能突破 4611.75 美元的心理阻力位。然而,4611.75 美元是一个非常强的阻力位,因为价格在不久的过去多次拒绝这个价格区域。
在日线图中,如果价格突破 4611.75 美元的心理阻力区域,并且日线看涨蜡烛收盘,多头可能会在未来几天维持向 4750.00 美元价格区域的看涨压力。
在看跌方面,如果价格拒绝 4611.75 美元的价格区域且每日看跌蜡烛收盘,空头可能会重新获得动力并将价格推低至 4400.00 美元的支撑区域。此外,MACD 线在 0.00 线上方出现看跌交叉,这表明空头可能在未来几天重新获得动力。
恒生指数 (HK50)
基本面视角
由于中国不太乐观的经济数据给企业盈利前景蒙上阴影,周五香港股市下跌,主要指数徘徊在13个月低位附近。由于担心大股东追加抛售,腾讯股价早盘下跌。
截至收市,恒生指数下跌 0.1%,报 16,334.37 点,全周跌幅为 3%。恒生科技指数也下跌 0.4%,而上证综合指数小幅上涨 0.1%。
Prosus 周四出售 513,500 股腾讯股票,引发更多抛售的担忧,导致该公司股价下跌 0.7% 至 305.60 港元。中国房地产开发商华润置地下跌4.6%,至25.70港元,中国海外发展下跌3.9%,至12.96港元。
技术视角
来源:TradingView
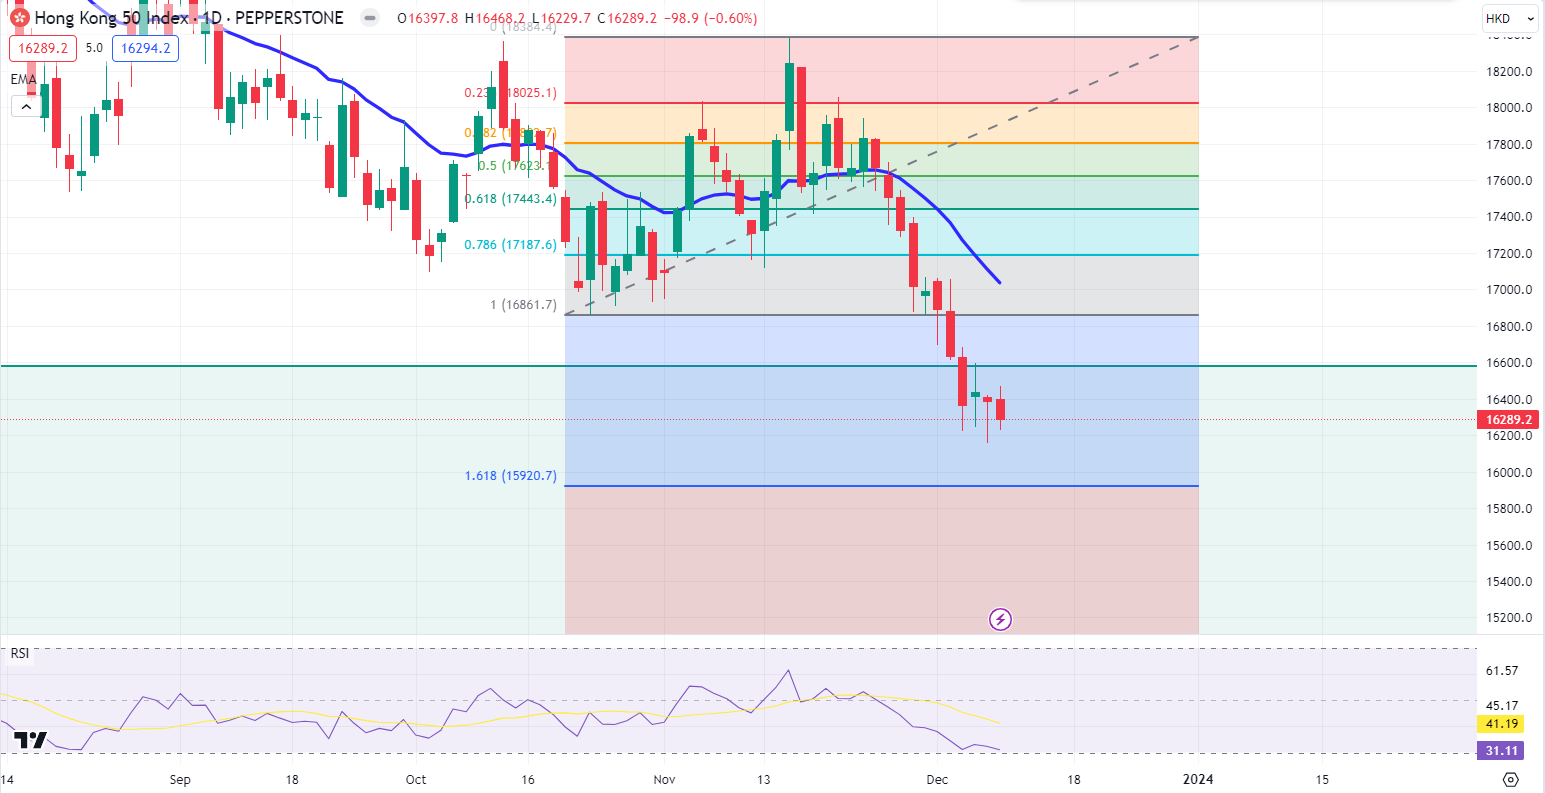
HK50 上周触及周需求区域,即 16565.0 美元 - 14755.0 美元价格区域。然而,周线图上价格仍低于 20 EMA 动态水平。
日线来看,HK50 可能会维持看跌压力至 1.618 斐波那契水平。因此,如果价格继续向 1.618 斐波那契水平迈进,并且每日看涨蜡烛收盘,多头可能会重新获得动力,并在未来几天将价格推向 17200.0 美元的价格区域。此外,RSI 指标表明市场出现超卖情况。
在看跌方面,如果价格回撤至 0.786 至 0.618 斐波那契水平,并且每日看跌蜡烛收盘,空头可能会维持看跌压力至 1.618 斐波那契水平,该水平位于 15920.0 美元的价格区域附近。
比特币(BTC美元)
基本面视角
比特币最近的连续上涨是自 5 月份以来最长的一次,将加密货币推升至 44,000 美元以上,引发了人们的猜测,即这种飙升是否表明人们越来越相信美联储可能会采取更宽松的货币政策。
领先的数字资产连续六天上涨,涨幅约为 16%,并且在周三亚洲早盘交易中正在巩固这些涨幅。继前一年的加密货币低迷之后,加密货币将在 2023 年复苏,目前已达到令人印象深刻的 165%。
技术视角
来源:TradingView
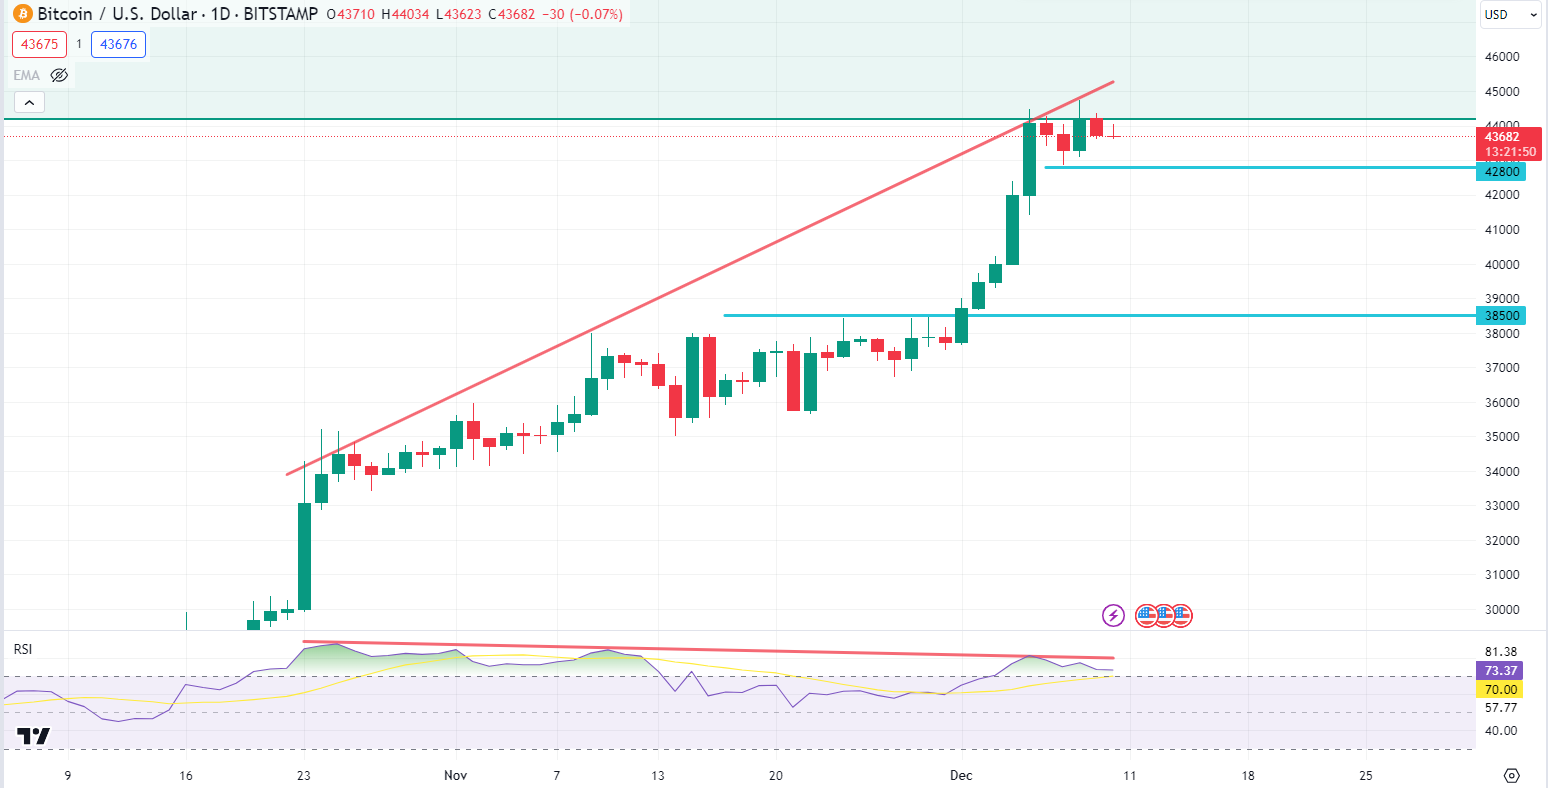
在周线图中,BTC价格触及周供应区域,即44000-48200美元价格区域。然而,最后一周的蜡烛收盘显示供应区拒绝的迹象。
在每日时间范围内,比特币上周周五以每日看跌蜡烛收于每周供应区域。因此,如果价格能够突破 42800 美元的波动水平区域并以每日看跌蜡烛收盘,空头可能会重新获得动力并将价格推低至 38500 美元的价格区域。此外,RSI 指标表明市场出现看跌背离形态。
从看涨的角度来看,如果价格跌至 38500 美元的支撑位,并且日线看涨蜡烛收于该支撑位之上,多头可能会在未来几天内维持看涨倾向,进一步向 46000 美元的价格区域上行。
以太坊(ETHUSD)
基本面视角
以太坊巨鲸的交易历史揭示了一系列经过深思熟虑的互换和流动性操作,通常涉及大量以太坊 (ETH)、USDC 等稳定币以及各种其他代币。例如,在多笔交易中,可以看到投资者将大量 ETH 兑换为 USDC,反之亦然,这可能是利用了市场涨跌的机会。
这种掉期模式表明了一种与市场变化同步建仓和离仓的策略——价格较低时买入,价格较高时卖出。
技术视角
来源:TradingView
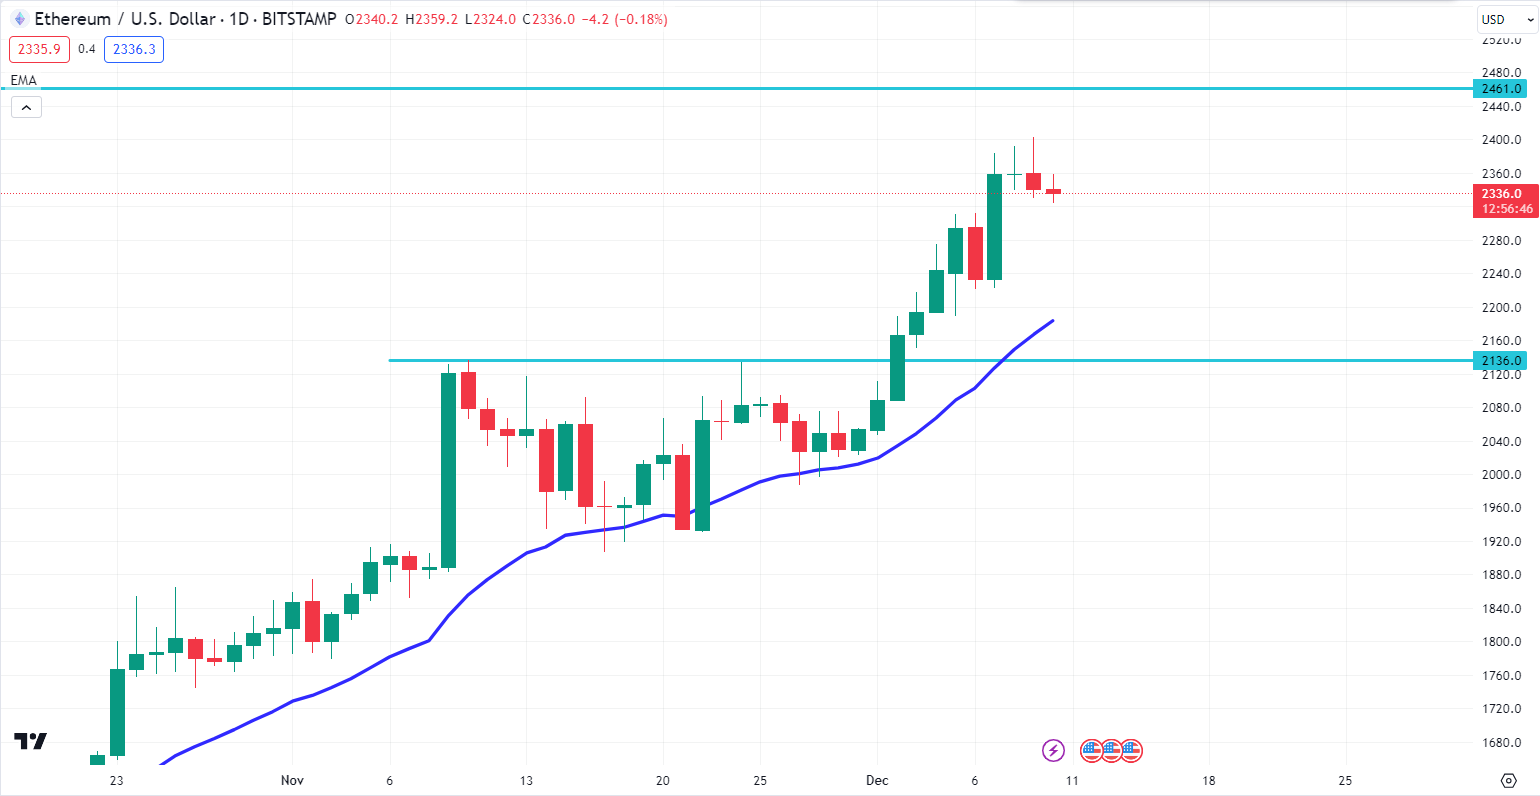
在周线图中,ETH 价格在经历了自 2022 年 4 月开始的长期看跌势头后,最终回落至 0.50 斐波那契水平。不过,价格仍位于 2461.0 美元的周颈线下方。
日线图上,ETH 价格可能回撤至 20 EMA 的动态水平。因此,如果价格回撤至 20 EMA 的动态水平,并且日线看涨蜡烛收盘于其上方,则未来几天价格可能会继续走高至 2461.0 美元的价格区域。
从看跌的角度来看,如果价格继续走高至 2461.0 美元的价格区域,并拒绝以每日看跌蜡烛收盘,空头可能会在未来几天重新获得动力,并将价格推低至 2136.0 美元的支撑位。
特斯拉股票 (TSLA)
基本面视角
特斯拉(纳斯达克股票代码:TSLA)公司为其驾驶辅助功能使用“自动驾驶仪”和“自动驾驶”等术语进行了辩护。作为对加州监管行动的回应,该公司辩称,该州机构在之前的调查中没有采取行动,从而暗示批准了这些条款。
去年,加州机动车辆管理局指控这家由亿万富翁埃隆·马斯克领导的电动汽车公司虚假宣传其自动驾驶仪和全自动驾驶功能,称其提供自动驾驶车辆控制。
美国机动车辆管理局目前正在寻求潜在的补救措施,其中可能包括暂停特斯拉在加州(特斯拉美国最大市场)销售车辆的许可证,并要求该公司向司机提供赔偿。
技术视角
来源:TradingView
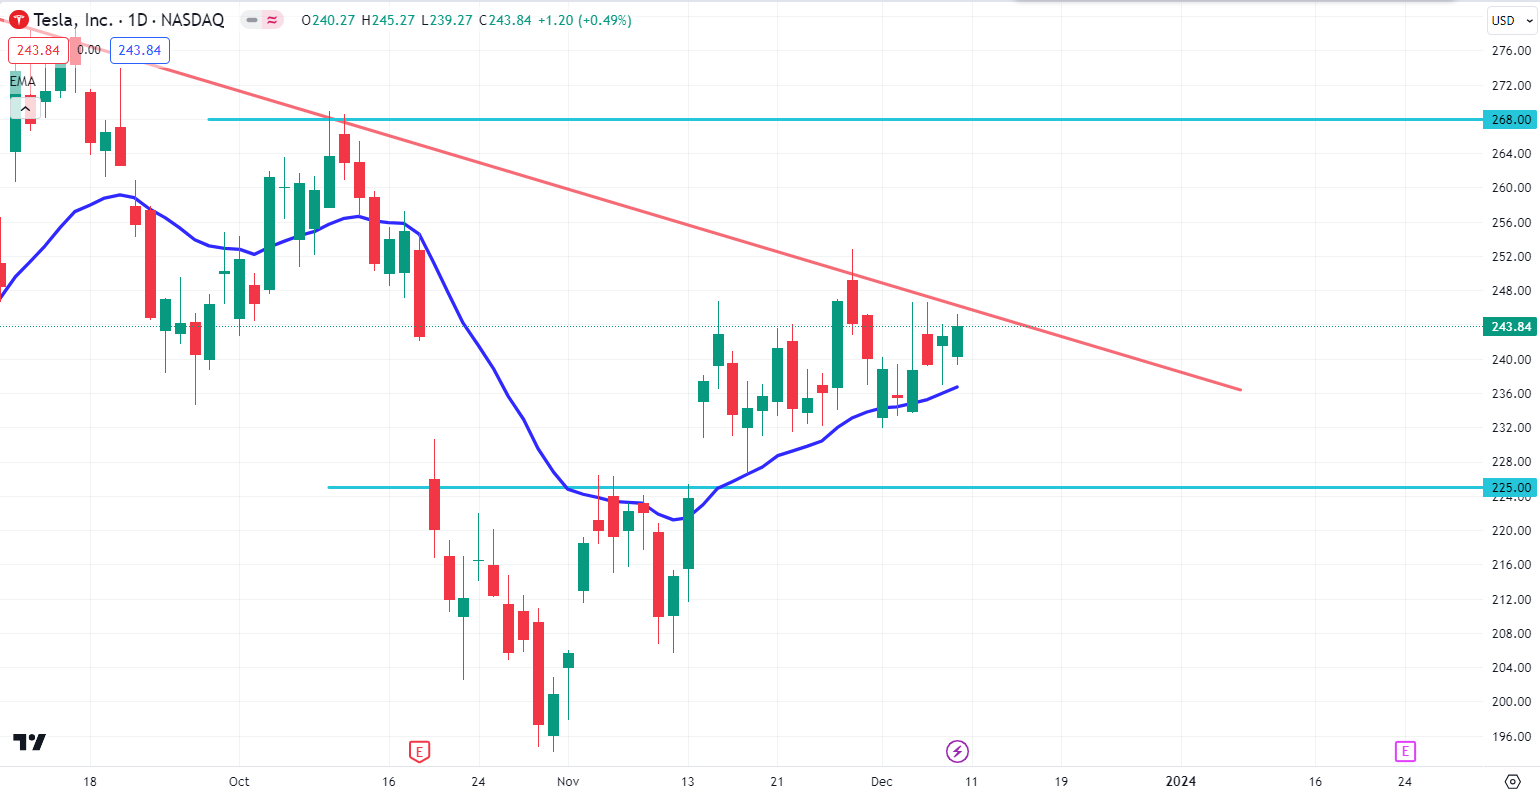
在 TSLA 股票的周线图中,多头仍将价格维持在 20 周均线动态水平之上,并且周蜡烛收盘强劲。然而,下降趋势线仍然是强阻力,需要克服才能形成看涨趋势延续。
在日线图中,如果价格能够突破每周看跌趋势线并以每日看涨蜡烛收盘,多头可能会在未来几天将价格推向 268.00 美元的价格区域。此外,20 EMA 的动态水平为价格提供了强有力的支撑,这可能会成为汇合看涨因素。
在看跌方面,如果价格能够突破 20 EMA 的动态水平并以每日看跌蜡烛收盘,空头可能会重新获得动力并将价格推低至 225.00 美元的价格区域。
黄金 (XAUUSD)
基本面视角
尽管美元遭到抛售,但金价并未出现任何上涨。这是因为美国国债收益率从数月低点强劲反弹,使得无息黄金的吸引力下降。
市场目前正在调整其对美国政府债券和美元的头寸,因为交易员预期美联储下周将作出利率决定,旨在确保利润。
技术视角
来源:TradingView
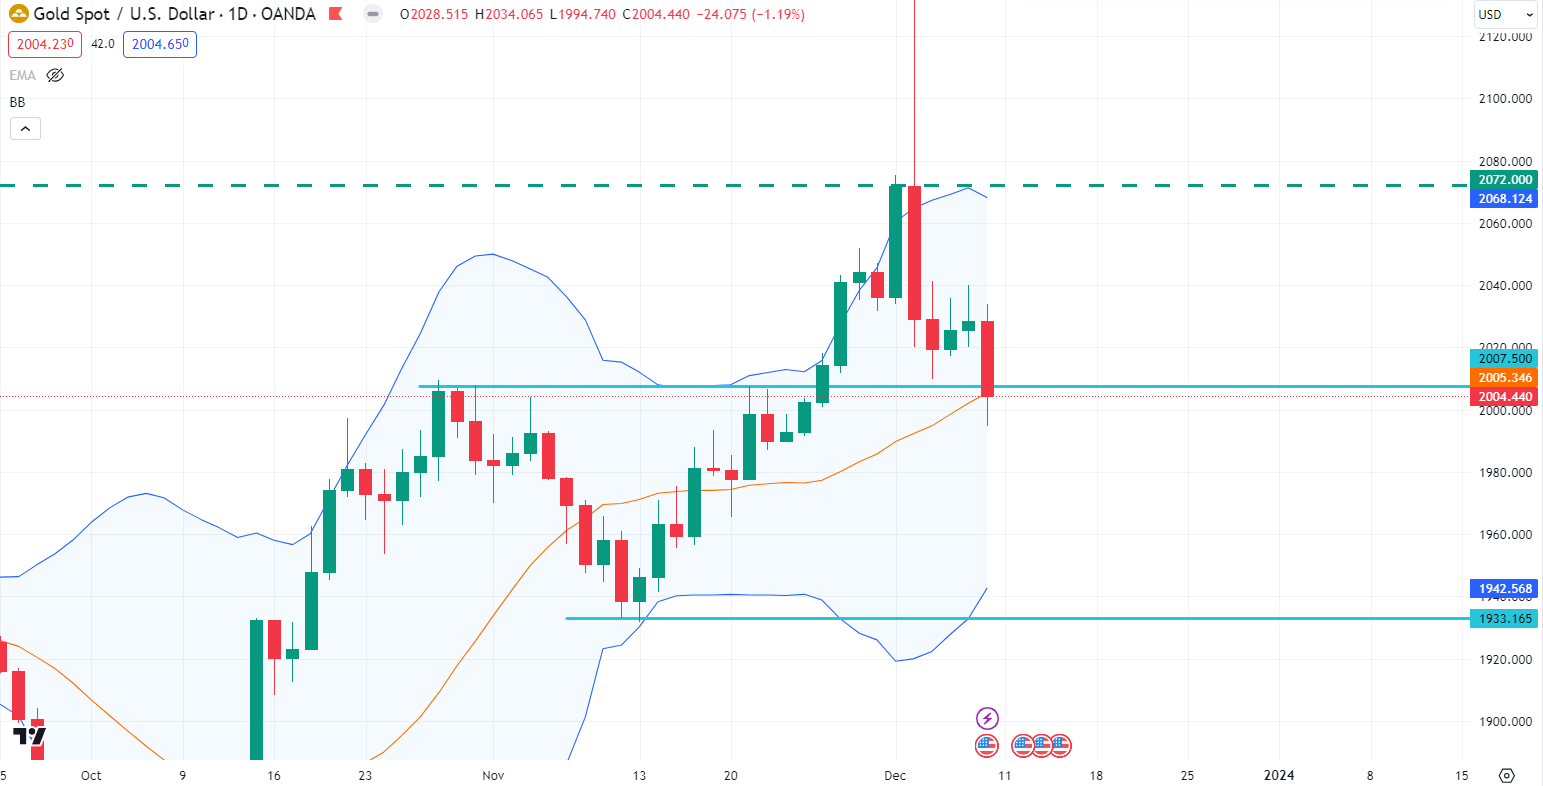
黄金在触及历史高点 2150.00 美元价格区域后,以强劲的每周看跌蜡烛收盘。在突破 2007.50 美元颈线后,上周价格再次回到该水平。
日线图上,价格目前位于布林带中轨。因此,如果价格从布林带中轨反弹走高,并且每日看涨蜡烛收于 2007.50 美元价格区域上方,那么金价可能会上涨至 2072.00 美元价格区域。
日线图上,如果价格能跌破布林带中带且日线看跌蜡烛收盘,空头可能会在未来几天维持看跌压力至 1933.20 美元价格区域。
原油 (WTI)
基本面视角
周五,美国数据支持需求增加预期,油价上涨超过 2%。然而,由于对供应过剩的持续担忧,这两个基准指数均连续第七周下跌,创下五年来最长的周跌幅。
布伦特原油期货收于每桶75.84美元,上涨1.79美元或2.4%;美国西德克萨斯中质原油期货收于每桶71.23美元,上涨1.89美元或2.7%。
本周,两个基准指数均下跌 3.8%,周四触及 6 月底以来的最低水平。这表明许多交易者认为市场供应过剩。
技术视角
在周线图中,油价目前位于需求区域内,并于上周以拒绝蜡烛收盘。
来源:TradingView
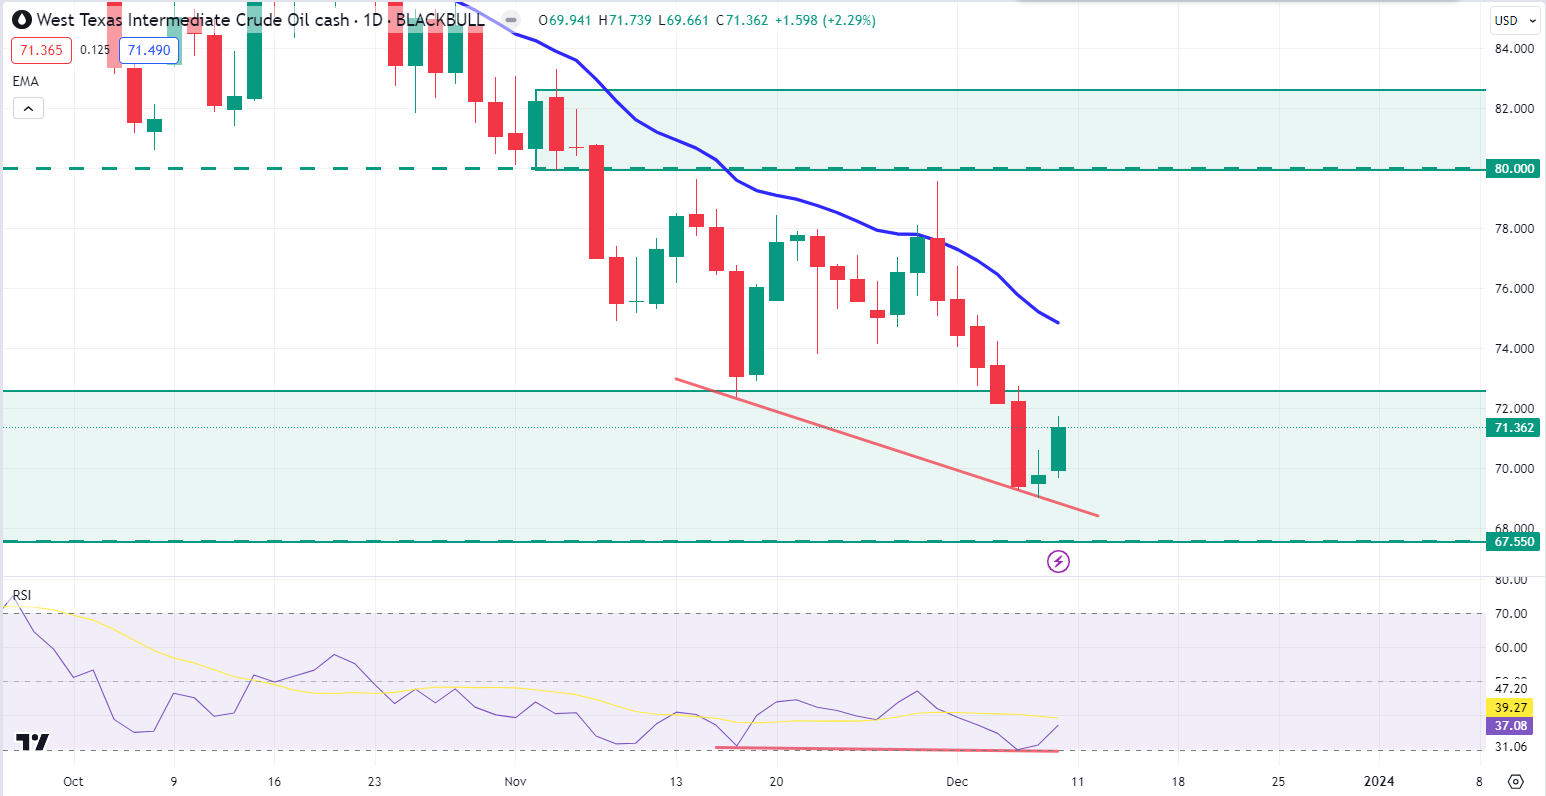
日线图中,RSI 指标形成看涨背离,这表明价格可能在未来几天回升至 80.00 美元的供应区域。然而,EMA 的动态水平可能会成为强阻力。
在看跌方面,如果价格拒绝 20 EMA 的动态水平并以脉冲看跌蜡烛收盘,空头可能会重新获得动力,并在未来几天内将价格推低至 67.55 美元的心理事件区域。