


High transaction fees have been a persistent issue for Ethereum, leading to the creation of Layer 2 protocols and scaling solutions to provide users with more economical alternatives.
Recent data, however, indicates a change, as the average fee per network transaction for Ethereum has fallen to $1.12, its lowest level since October 18.
Ethereum Circulating Supply Has Increased
According to data from Ultrasound Money, the circulating supply of Ether has increased to its greatest level since March, surpassing 120 million Ether at present. The observed rise in quantity can be ascribed to a steady reduction in the combustion rate for the previous fortnight.
Ultrasound.money reports that gas prices have increased from a minimum of 4.48 Gwei to a maximum of 7.19 Gwei, whereas YCharts displays gas prices at $0.62, a decrease from their apex of $3.788 in May 2023.
After a period of consistent deflation lasting five months, ETH holders were taken aback when the Ethereum supply chart revealed inflation. This abrupt increase in supply is illustrated in the following ETH supply chart.
Notwithstanding these occurrences, the price of Ether has maintained a comparatively steady level above $3,200, exhibiting only minor variations since the halving of Bitcoin. The potential catalyst for Ethereum's future trajectory is the Securities and Exchange Commission's (SEC) judgment regarding a Spot Ether ETF, which is eagerly anticipated by investors.
Ethereum Price Prediction Technical Analysis
In the daily chart of ETHUSD, the broader market direction is bullish, where the current price hovers within a descending channel pattern. Therefore the primary aim for this pair is to look for long trades after making a valid channel breakout.
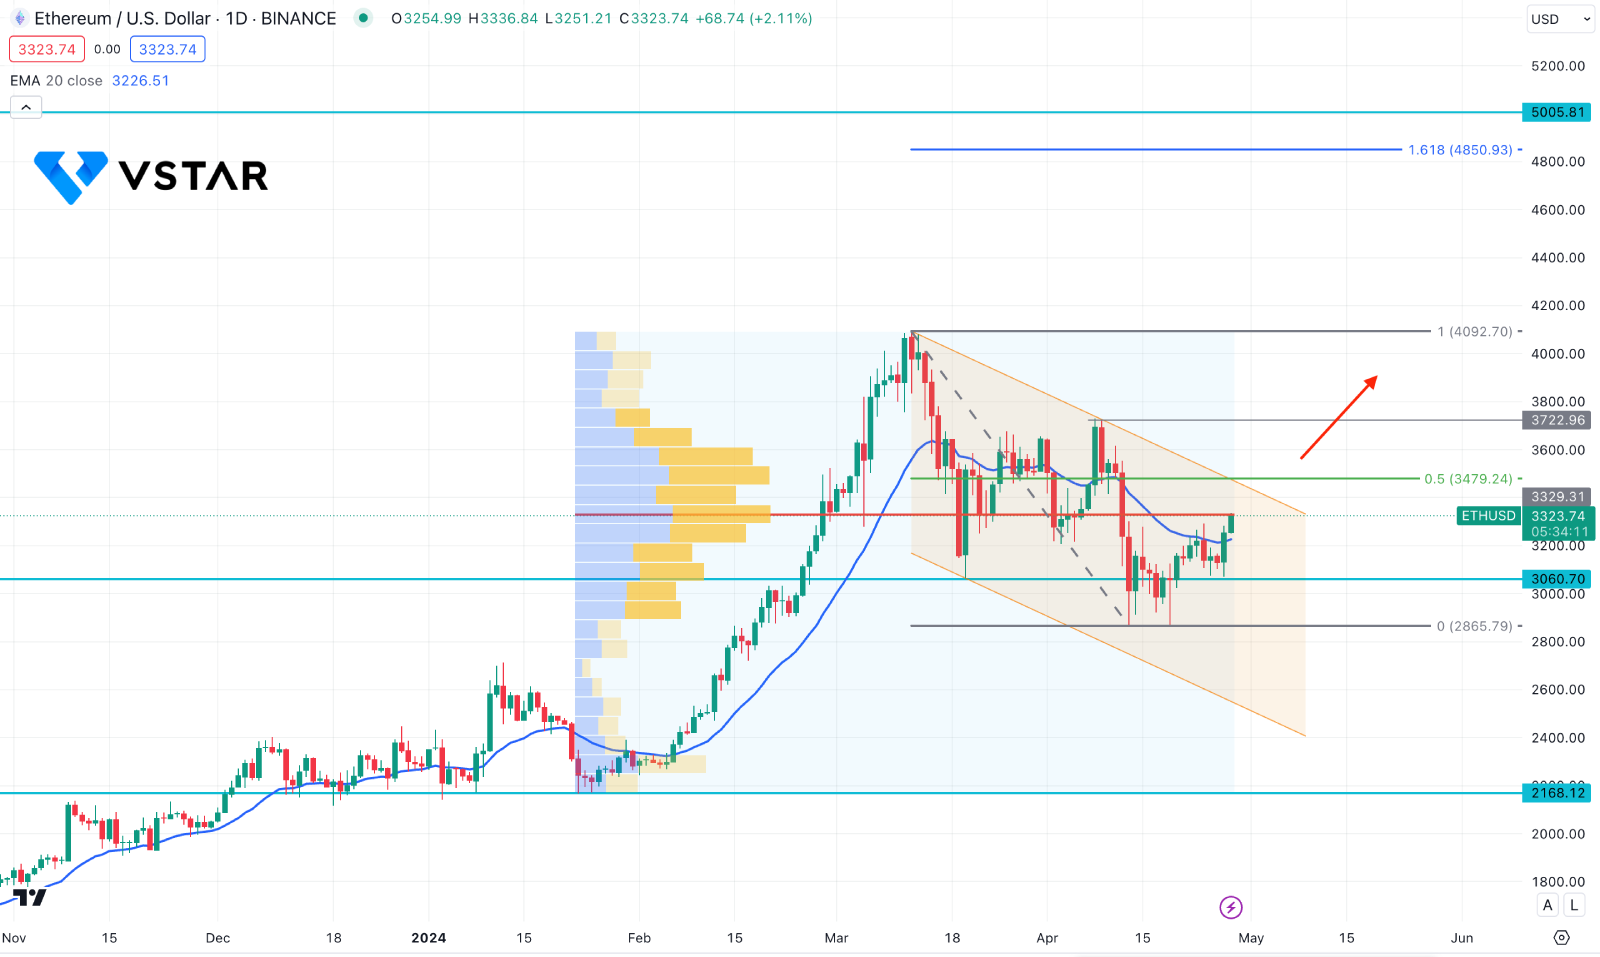
On the volume structure, the most active level since January 2024 is at 3229.36 level, which is at the current price. As the current price hovers near the high volume level, we may expect a strong trend continuation after having a solid range breakout.
Based on the daily market outlook of ETHUISD, a descending channel breakout with a daily candle above the 3722.35 swing high could be a high probable long opportunity targeting the 4850.30 Fibonacci Extension level.


