Introduction
Ford Motor Company is one of the oldest and largest automakers in the world. The company was founded in 1903 by Henry Ford and is headquartered in Dearborn, Michigan. Ford operates in four segments: Automotive, Mobility, Ford Credit, and Corporate and Other. The company's current CEO is Jim Farley, who took over from Jim Hackett in October 2020. Some of the top shareholders of Ford include Vanguard Group, BlackRock, State Street, Berkshire Hathaway, and Geode Capital Management.
Ford has a long history of innovation and leadership in the automotive industry. The company introduced the first mass-produced car, the Model T, in 1908. It also pioneered the assembly line, the moving conveyor belt, and the V8 engine. Ford has been involved in various fields such as aviation, aerospace, defense, and transportation services. The company has also acquired or invested in several brands such as Lincoln, Mercury, Jaguar, Land Rover, Volvo, Mazda, and Aston Martin.
However, Ford has also faced many challenges and crises throughout its history. The company has struggled with labor disputes, quality issues, environmental concerns, safety scandals, financial losses, and competitive pressures. Ford has undergone several restructuring and turnaround plans to adapt to changing market conditions and consumer preferences. The company has also divested or discontinued some of its brands such as Mercury, Jaguar, Land Rover, Volvo, and Aston Martin.
Source: Investopedia
Ford's Business Model and Products/Services
Ford generates revenue primarily through vehicle sales and financing services. The automotive segment contributes around 90% of total revenue, encompassing design, manufacture, marketing, and servicing of vehicles under the Ford and Lincoln brands, sold through dealerships, distributors, and online platforms across regions like North America, Europe, China, South America, Middle East, and Africa.

Source: NBC
The mobility segment constitutes about 2% of revenue and focuses on solutions like autonomous vehicles, connectivity services, ride-hailing, e-scooters, e-bikes, micro-transit, and software platforms through subsidiaries like Argo AI, Spin, TransLoc, Autonomic, and Ford Smart Mobility.
The Ford Credit segment contributes approximately 8% of revenue, providing financing products and services to dealers and customers, including retail installment sale contracts, leases, wholesale financing, commercial fleet financing, and insurance products. Lastly, the corporate and other segment accounts for less than 1% of total revenue, handling treasury operations, equity investments, research and development, corporate costs, and miscellaneous items.
Ford's main products and services include:
- Cars: Fiesta, Focus, Fusion, Mustang, Taurus, etc.
- Trucks: F-Series (F-150, F-250, F-350, etc.), Ranger, Transit, etc.
- SUVs: EcoSport, Escape, Edge, Explorer, Expedition, Bronco, etc.
- Crossovers: C-Max, Flex, etc.
- Electric Vehicles: Mustang Mach-E, F-150 Lightning, E-Transit, etc.
- Hybrids: Fusion Hybrid, Escape Hybrid, Explorer Hybrid, etc.
- Lincoln: Continental, MKZ, Nautilus, Corsair, Aviator, Navigator, etc.
- Mobility Services: Argo AI (AV technology), Spin (e-scooters), TransLoc (micro-transit), Autonomic (cloud platform), Ford Smart Mobility (mobility unit), etc.
- Financing Services: Ford Credit (financing products), Ford Protect (insurance products), FordPass (connectivity services), etc.

Source: EastMojo
Ford's Financials, Growth, and Valuation Metrics
Ford's financial performance has been affected by various factors such as the COVID-19 pandemic, the global semiconductor shortage, the rising competition in the EV market, the changing consumer preferences, and the regulatory environment. The company has reported mixed results in its recent quarters, showing signs of recovery and growth as well as challenges and risks.
Review of Ford's Financial Statements
Ford's market capitalization was $59.8 billion as of July 23, 2023. The company's net income for the full year 2022 was $2.8 billion, compared to a net loss of $1.3 billion in 2021. The company's revenue for the full year 2022 was $127.1 billion, down 6.1% from $135.4 billion in 2021. The company's revenue for the first quarter of 2023 was $36.2 billion, up 6.4% from $34 billion in the first quarter of 2022. The company's net income for the first quarter of 2023 was $3.3 billion, up from a net loss of $2 billion in the first quarter of 2022.
Ford's profit margins have improved in recent quarters, mainly due to cost-cutting measures, higher average selling prices, favorable product mix, and strong demand for its trucks and SUVs. The company's operating margin for the first quarter of 2023 was 13.3%, up from -7% in the first quarter of 2022. The company's net margin for the first quarter of 2023 was 9%, up from -5.9% in the first quarter of 2022.
Ford's return on equity (ROE) has also improved in recent quarters, reflecting its higher profitability and lower debt levels. The company's ROE for the full year 2022 was 9%, up from -4% in 2021. The company's ROE for the first quarter of 2023 was 29%, up from -18% in the first quarter of 2022.
Ford's vehicle deliveries and sales have been impacted by various factors such as the COVID-19 pandemic, the global semiconductor shortages, supply chain disruptions, production capacity constraints, and competitive pressures. The company's total vehicle deliveries for the first quarter of 2023 were 1.11 million units, up 1% from 1.09 million units in the first quarter of 2022.
Ford's balance sheet strength and implications have been influenced by its cash flows, debt levels, liquidity position, and capital allocation strategy. The company's cash flow from operations for the full year 2022 was $7 billion, up from $6 billion in 2021. The company's cash flow from operations for the first quarter of 2023 was $4 billion, up from -$0.7 billion in the first quarter of 2022.

Source: Ford
Key Financial Ratios and Metrics
Ford's valuation multiples can be compared to its peers and the industry to determine if the stock is undervalued, fairly valued, or overvalued. The following table shows some of the key valuation ratios and metrics for Ford and its competitors as of July 23, 2023:
|
Company |
P/E |
P/S |
P/B |
EV/EBITDA |
|
Ford |
21.4 |
0.5 |
1.6 |
9.8 |
|
Tesla |
118.9 |
15.7 |
24.4 |
54.7 |
|
GM |
9.2 |
0.6 |
1.5 |
6.4 |
|
Toyota |
12.4 |
0.8 |
1.1 |
7.8 |
|
Industry Average |
15.2 |
0.9 |
1.7 |
8.9 |
Based on these ratios and metrics, Ford appears to be undervalued relative to Tesla, fairly valued relative to GM and Toyota, and slightly overvalued relative to the industry average. However, these ratios and metrics do not capture the future growth potential, competitive advantages, and risks of each company. Therefore, they should be used with caution and supplemented with other factors such as earnings growth, market share, innovation, and customer loyalty.
Ford Stock Performance Analysis
Ford stock has been trading on the New York Stock Exchange (NYSE) under the ticker symbol F since its initial public offering (IPO) in 1956. The stock is also traded on other exchanges such as the London Stock Exchange (LSE), the Frankfurt Stock Exchange (FSE), and the Tokyo Stock Exchange (TSE). The stock is denominated in US dollars (USD) and can be traded during regular trading hours from 9:30 a.m. to 4:00 p.m. Eastern Time (ET) on weekdays, as well as during pre-market and after-market hours.
Ford Stock Splits
Ford stock has undergone several stock splits in its history, most recently a reverse split of 1-for-10 in June 2020.
Ford Dividend
The stock has also paid dividends to its shareholders since its IPO, except for a brief suspension from March 2009 to December 2011 due to the financial crisis. The current annual dividend yield on Ford Motor Company stock is about 2%.
Ford's stock price performance since its IPO has been volatile and cyclical, reflecting the ups and downs of the automotive industry and the global economy. The stock has reached several historical highs and lows over the years, such as:
- A high of $42.45 in May 1999, driven by strong sales of SUVs and trucks in the US market.
- A low of $1.01 in November 2008, amid the global financial crisis and the near-collapse of the US auto industry.
- A high of $18.97 in January 2011, boosted by a successful turnaround plan and a return to profitability.
- A low of $3.96 in March 2020, due to the COVID-19 pandemic and its impact on vehicle demand and production.
- A high of $16.45 in June 2021, fueled by optimism about Ford's EV strategy and new product launches.
The current stock price for Ford as of July 23, 2023, was $14.12, down 14% from its recent high in June 2021. The stock price volatility for Ford has been high, as the stock has experienced significant swings in both directions due to various factors such as earnings reports, product announcements, industry news, analyst ratings, and market sentiment. The stock has a beta of 1.2, meaning that it tends to move more than the market average.
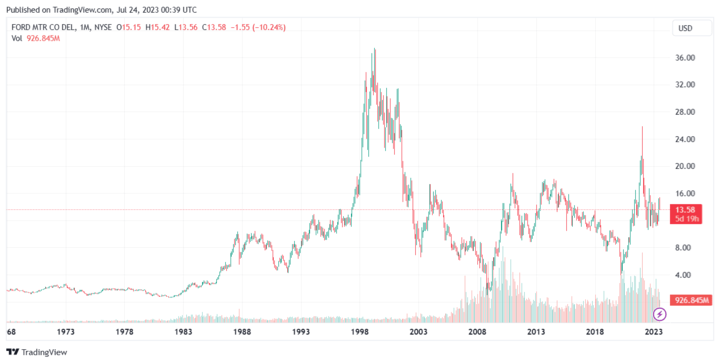
Source: TradingVeiw
Some of the key drivers of Ford's stock price include:
- EV market progress and performance - Ford heavily invested in EV strategy, partnering with companies like Rivian, Volkswagen, and SK Innovation. Aims to achieve 40% global sales from EVs by 2030.
- Coping with semiconductor shortage - Estimated chip shortage to reduce vehicle output by 1.1 million units in 2023, leading to a $2.5 billion loss in EBIT. Prioritizing profitable models and leveraging the global supply chain to mitigate the impact.
- Innovation in the competitive automotive industry - Investments in R&D for autonomous driving, connectivity services, and advanced materials. Diversifying product portfolio for various segments and markets.
- Financial strength and flexibility - Improved cash flow, profitability margins, debt-to-equity ratio, and credit rating. Increased 2023 capital expenditure budget to $11 billion to support EV strategy.
Ford Stock Forecast
The Ford stock price trend analysis shows that the stock has been in an uptrend since March 2020, when it hit a multi-year low of $3.96. The stock has broken above several resistance levels and formed higher highs and higher lows, indicating bullish momentum. The stock has also stayed above its 50-day and 200-day moving averages, which act as dynamic support levels. The stock has recently pulled back from its 52-week high of $16.45, which was reached in June 2021, after facing some selling pressure and profit-taking. The stock is currently trading near its 50-day moving average, which could provide a bounce-back opportunity for the bulls.
The following chart shows the daily price action of Ford stock from January 2020 to July 2023, along with some technical indicators such as the moving averages, the relative strength index (RSI), and the Bollinger bands.
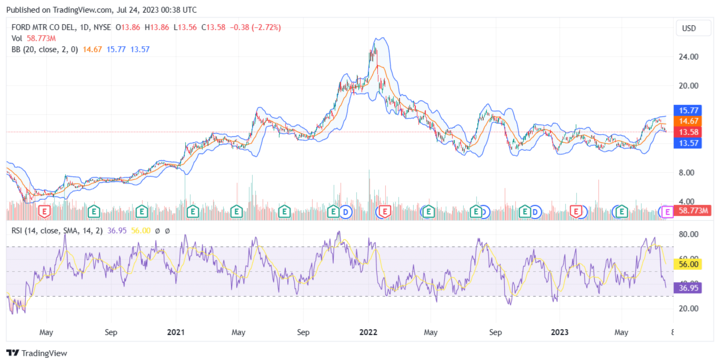
Source: TradingView
Some of the key resistance and support levels for F stock price are as follows:
- Resistance 1: $16.45, the 52-week high and a psychological level.
- Resistance 2: $18.97, the multi-year high reached in January 2011.
- Resistance 3: $21.76, the 61.8% Fibonacci retracement level of the downtrend from May 1999 to November 2008.
- Support 1: $13.65, the 50-day moving average and a previous resistance turned support level.
- Support 2: $11.82, the 200-day moving average, and a previous support level.
- Support 3: $9.45, the 38.2% Fibonacci retracement level of the uptrend from March 2020 to June 2021.
According to MarketBeat, as of July 23, 2023, 23 analysts were covering F stock, with 13 of them giving a buy rating, 7 giving a hold rating, and 3 giving a sell rating. The consensus among analysts is that Ford is a moderate buy, with an average price target of $15.87, implying an upside of 12% from the current price of $14.12. The highest price target for Ford is $20, while the lowest is $10.
Some of the recent analyst opinions and price targets for Ford are as follows:
- On July 21, 2023, Morgan Stanley analyst Adam Jonas reiterated an overweight rating and raised the price target from $17 to $18, citing Ford's strong execution and leadership in the EV market.
- On July 19, 2023, Deutsche Bank analyst Emmanuel Rosner upgraded Ford from hold to buy and increased the price target from $14 to $17, noting Ford's improved profitability and cash flow outlook.
- On July 16, 2023, JPMorgan analyst Ryan Brinkman maintained a neutral rating and lowered the price target from $16 to $15, reflecting the impact of the chip shortage and the production cuts on Ford's earnings.
- On July 14, 2023, Credit Suisse analyst Dan Levy reiterated an outperform rating and boosted the price target from $15 to $16, highlighting Ford's competitive edge in the EV truck segment with the F-150 Lightning.
- On July 12, 2023, Goldman Sachs analyst Mark Delaney downgraded Ford from buy to sell and slashed the price target from $16 to $10, expressing concerns about Ford's valuation and growth prospects.
Challenges and Opportunities
Ford faces several challenges and opportunities in the automotive industry, which is undergoing a major transformation due to technological innovation, environmental regulations, consumer behavior, and competitive dynamics. Some of these are:
Competitive Risks
Source: Greenbiz
Ford competes with many other automakers in the global market, both traditional and new entrants. Some of its main competitors include:
- Tesla: The leading EV maker in the world, with a market capitalization of over $600 billion as of July 23, 2023. Tesla has a loyal customer base, a strong brand image, a high innovation rate, and a dominant position in the premium EV segment.
- GM: The largest US automaker by revenue and market share, with a market capitalization of over $80 billion as of July 23, 2023. GM has a diversified product portfolio, covering various segments and markets such as cars, trucks, SUVs, crossovers, EVs, hybrids, luxury vehicles, and commercial vehicles. GM has also invested heavily in its EV strategy.
- Toyota: The largest automaker in the world by vehicle sales and production volume, with a market capitalization of over $250 billion as of July 23, 2023. Toyota has a reputation for quality, reliability, efficiency, and innovation in the automotive industry.
In terms of threats from these competitors to Ford's competitive position in the market:
- Tesla's strong brand image and dominant position in the premium EV segment could potentially attract customers away from Ford's EV offerings.
- GM's diversified product portfolio and heavy investment in its EV strategy could provide it with a competitive edge in terms of attracting and retaining customers.
- Toyota's reputation for quality, reliability, efficiency, and innovation could also potentially attract customers away from Ford.
However, it's important to note that Ford also has its own set of competitive advantages that help it compete effectively in the highly competitive automotive industry. These include stable and high sales, brand image, customer loyalty, innovation, technological innovation, wide product and services portfolio, HR management, production and distribution capabilities, global presence and supply chain management.
Other risks
- Regulatory risks: Ford has to comply with various environmental, safety, and emission standards and regulations in different countries and regions, which may increase its costs, limit its product offerings, and expose it to legal liabilities and penalties.
- Operational risks: Ford has to manage its complex and global operations and supply chain efficiently and effectively while facing challenges such as labor disputes, quality issues, product recalls, cyberattacks, natural disasters, pandemics, and geopolitical conflicts.
- Technological risks: Ford has to keep up with the rapid pace of technological innovation and disruption in the automotive industry, which requires significant investments in research and development, capital expenditure, and acquisitions. Ford also has to protect its intellectual property rights and avoid infringing on.
Growth Opportunities
Ford also has several growth opportunities in the automotive industry, which offer the potential for increasing its revenue, market share, profitability, and customer loyalty. Some of these are:
- EV market: Capturing a larger share of the fast-growing EV market with innovative models like Mustang Mach-E and F-150 Lightning. Plans to invest $22 billion in EV strategy by 2025.

Source: Electra
- New mobility trends: Leveraging the mobility segment with services like autonomous driving, e-scooters, and ride-hailing through partnerships with companies like Lyft and Uber.
- Global expansion: Focusing on emerging markets like China, India, Southeast Asia, Africa, and Latin America by tailoring models to meet customer preferences.
Future Outlook and Expansion
Ford has an optimistic outlook for its future growth and expansion in the automotive industry, as it pursues its vision of becoming the world's most trusted company, designing smart vehicles for a smart world. Ford has set several goals and targets for its future performance and progress, such as:
- Achieving an 8% adjusted EBIT margin by the end of 2023, up from 4.8% in 2022.
- Achieving a 40% of global sales from EVs by 2030, up from less than 5% in 2020.
- Achieving net zero greenhouse gas emissions from its operations by 2035, and from its products by 2050.
- Achieving a top quartile ranking in customer satisfaction and quality metrics by 2023, up from a bottom quartile ranking in 2020.
Ford also has several plans and initiatives to expand its presence and reach in new and existing markets and segments, such as:
Ford plans to launch 30+ new models in China (including 10+ EVs), 20+ in India (with the first made-in-India EV), 15+ in Southeast Asia (including the first made-in-Thailand EV), 10+ in Africa (including the first made-in-South Africa EV), and 5+ in Latin America (including the first made-in-Mexico EV).
Ford also plans to invest more than $30 billion in its global operations and facilities by 2025, up from $22 billion previously, to support its growth and expansion plans. The company also plans to create more than 10,000 new jobs globally by 2025, mainly in the areas of EVs, AVs, software, and mobility.
Why Traders Should Consider Ford Stock
Ford stock offers several benefits and advantages for traders who are interested in investing in the automotive industry. Some of these are:
- Strong fundamentals: Improved financial performance, growth, and resilience, with increased revenue, net income, cash flow, profitability margins, and dividend yield. Reduced debt levels and improved credit ratings.
- Attractive valuation: Trading at a relatively low valuation compared to peers and the industry average, with a favorable PEG ratio. High upside potential and low downside risk.
- Competitive edge: Strong brand recognition, loyal customer base, and expertise in truck and SUV segments. Demonstrated innovation through new products and strategic partnerships with companies like Rivian, Volkswagen, Lyft, and Uber.
Trading Strategies for Ford Stock
Ford stock offers various trading strategies for traders who want to capitalize on its price movements and volatility. Some of these strategies include:
- CFD trading: CFDs (contracts for difference) are derivatives that allow traders to speculate on the price movements of an underlying asset without owning it. CFDs offer several advantages, such as leverage, short selling, hedging, and diversification. Traders can use CFDs to trade Ford stock on various platforms, such as Vstar. Traders can also use CFDs to trade other assets related to Ford, such as indices, commodities, currencies, and ETFs.
- Swing trading: Swing trading is a medium-term trading strategy that involves holding a position for a few days to a few weeks, depending on the market trends and signals. Swing traders use technical analysis, fundamental analysis, and market sentiment to identify trading opportunities and entry and exit points.
- Day trading: Day trading is a short-term trading strategy that involves opening and closing positions within the same trading day, without holding any overnight positions.
Source: DC New
Trade Ford Stock CFD with VSTAR
If you are interested in trading Ford stock CFD, you may want to consider using VSTAR, a leading online trading platform that offers various advantages and features for traders of all levels. Some of the reasons why you should choose VSTAR are:
- VSTAR is a leading online trading platform offering competitive spreads, low commissions, and no hidden fees for Ford stock CFD trading.
- Access VSTAR's user-friendly and intuitive trading platform from any device for fast execution and reliability. Enjoy the convenience of trading Ford stock CFD anytime, anywhere.
- Utilize a wide range of trading tools, including technical indicators, charting tools, news feeds, economic calendars, and market signals to make informed trading decisions on Ford stock CFD.
- Benefit from VSTAR's 24/7 professional customer support and extensive educational resources like tutorials, podcasts and articles to enhance your Ford stock CFD trading knowledge and skills.


Conclusion
Ford Motor Company is one of the oldest and largest automakers in the world. The company is undergoing a major transformation to compete in the electric vehicle (EV) market. In this article, we have analyzed Ford's business model, financials, stock performance, challenges, opportunities, and trading strategies. We have found that Ford has improved its fundamentals and outlook in recent quarters, showing signs of recovery and growth. The company has also launched several new and innovative products and services, such as the Mustang Mach-. The company has also formed strategic partnerships and alliances with various companies and organizations, such as Rivian, and Volkswagen. Ford stock offers several benefits and advantages for traders who are interested in investing in the automotive industry. The stock has a high upside potential based on analysts' price targets and a low downside risk based on its support levels. Ford stock also offers various trading strategies for traders who want to capitalize on its price movements and volatility.