


The British Pound (GBP) maintained its upward trend against the US Dollar (USD) over the week, surpassing the 1.2600 level for the first time since mid-April. However, the weekly candle failed to close above this line, raising a question regarding the upward possibility.
GBP Got Beaten By The US Dollar
The Pound Sterling experienced persistent purchasing pressure about the US Dollar, which coincided with the Federal Reserve's (Fed) announcement of a less aggressive position during its midweek meeting and Chairman Jerome Powell's remarks at the subsequent press conference.
Although the United Kingdom did not release any substantial economic data, the focus was on the Federal Reserve's actions and the United States Nonfarm Payrolls (NFP) report for April, which unveiled a fewer-than-anticipated 175K job addition.
Geopolitical tensions, specifically in the Middle East, fostered a risk-on sentiment, bolstering the bullish momentum surrounding the British pound and other currencies associated with higher levels of risk.
What's On The Calendar?
With the Bank of England (BoE) meeting in the coming week, the pound is anticipated to be significantly impacted, as the institution is widely anticipated to uphold interest rates. Investor speculation indicates that the BoE may consider implementing a rate reduction later in the year.
Furthermore, the announcement of UK Gross Domestic Product (GDP) figures for the initial quarter on Friday may indicate a possible resurgence in the economy following the downturn in late 2023.
GBPUSD Forecast Technical Analysis
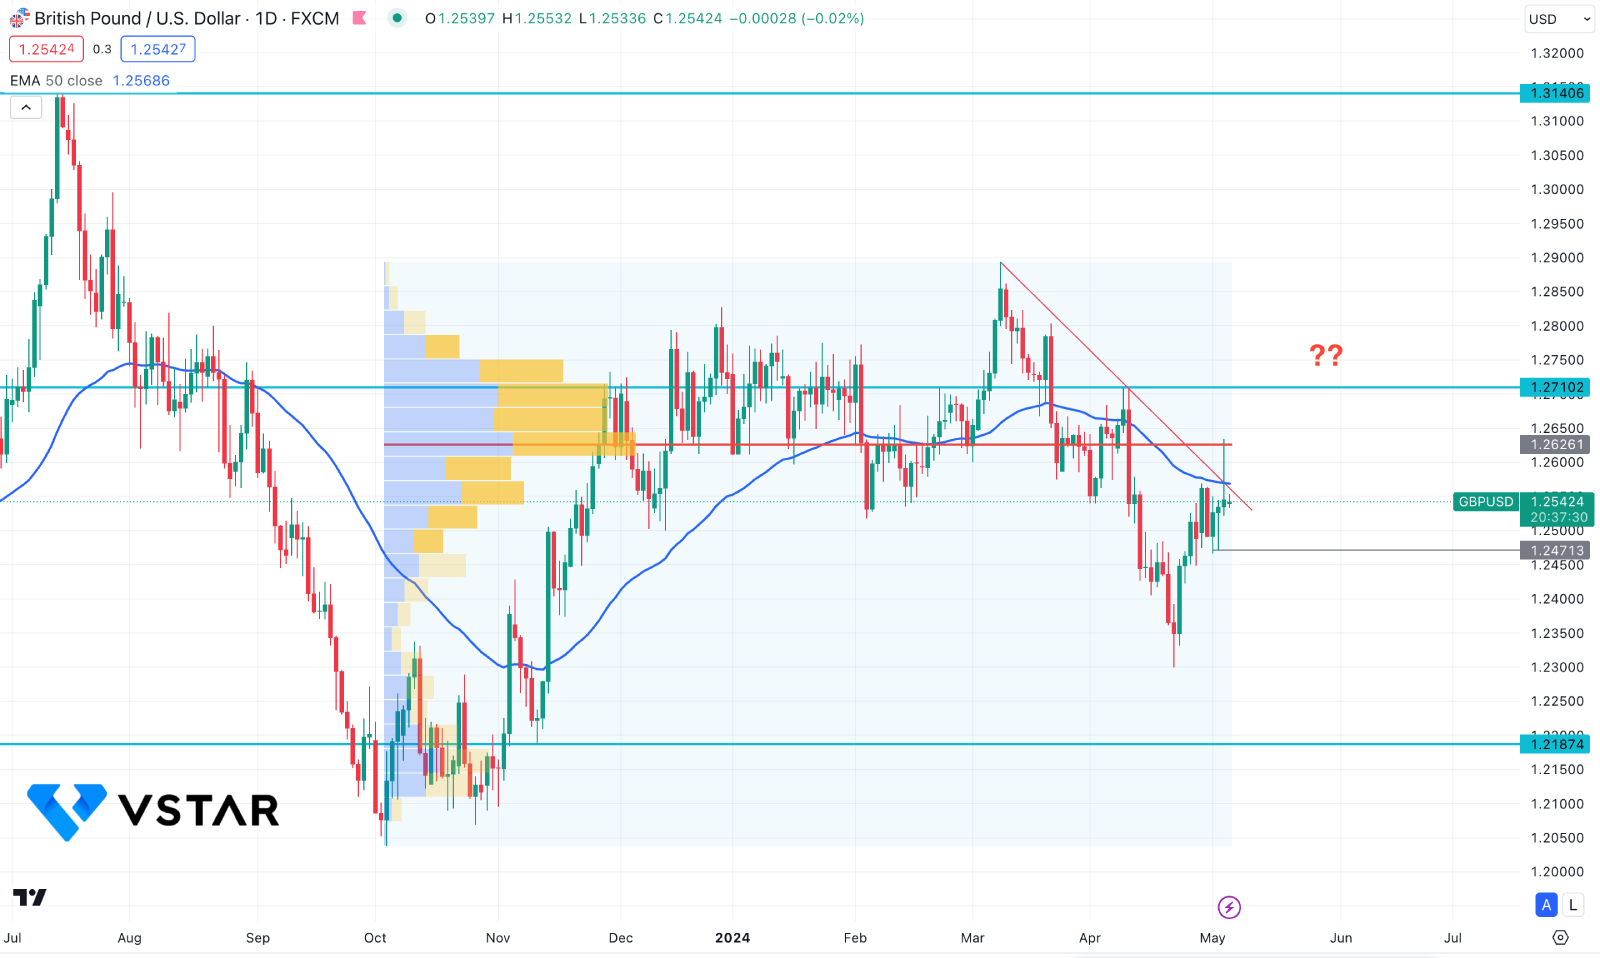
The daily price of GBPUSD has bullish overall momentum. The most recent price shows volatility above the 50-day Exponential Moving Average level.
In the volume structure, the price found the 1.2626 high volume level as resistance and formed a shooting star candlestick. It is a sign that bulls have failed to maintain the buying pressure.
Overall, GBPUSD encounters resistance at the 1.2626 level, with subsequent levels occurring at 1.2709 and 1.2803. Also, the buying pressure is supported by the rising RSI and positive MACD Histograms. In that case, a valid buying pressure with an intraday consolidation above the high volume line could validate the trend line breakout and take the price to the 1.2850 level.
The alternative trading approach is to seek bearish opportunities after having a failure to hold the price above the 50-day EMA line. In that case, a valid bearish daily close below the 1.2471 level could offer a conservative short opportunity, targeting the 1.2300 level.


