


Following a brief phase of relative stability, the US Dollar experienced a surge. As a result, the XAUUSD price fell to the 2,151.00 level, just above the weekly low of 2,150.50.
A Rate Cut Is Anticipated
The upward movement of the US Dollar was after the disclosure of unsatisfactory macroeconomic data from the US, which suggested that the Federal Reserve (Fed) might adopt a more prudent stance about forthcoming rate decisions.
At its December meeting, the central bank had initially projected three rate cuts for the year. Nonetheless, a shift in market sentiment towards greater conservatism is anticipated to be communicated at the March meeting. The outlook mentioned above is being impacted by persistent inflation, a labor market that is comparatively constrained, and sluggish growth.
Retail Sales and PPI Support The Rate Cut
The United States released its Retail Sales data for February, revealing a moderate increase of 0.6% for the month. While this figure improved over the -1.1% recorded in the previous month, it was not as substantial as the expected 0.8% increase.
Simultaneously, the Producer Price Index (PPI) spiked 1.6% annually during the corresponding time frame, exceeding initial projections. The annual core measurement, however, remained unchanged at 2%. An encouraging development was the lower Initial Jobless Claims to 209K for the week ending March 8, which exceeded expectations of 218K.
Data To Look At
Due to recent releases, operational expenses escalated on Wall Street while government bond yields increased. Currently, the yield on 10-year Treasury notes is recorded at 4.29%, reflecting a daily increase of approximately 10 basis points (bps).
The preliminary estimate of the March Michigan Consumer Sentiment Index, which is anticipated to remain unaffected at 76.9, and Industrial Production and Capacity, are scheduled to be released by the United States to conclude the week.
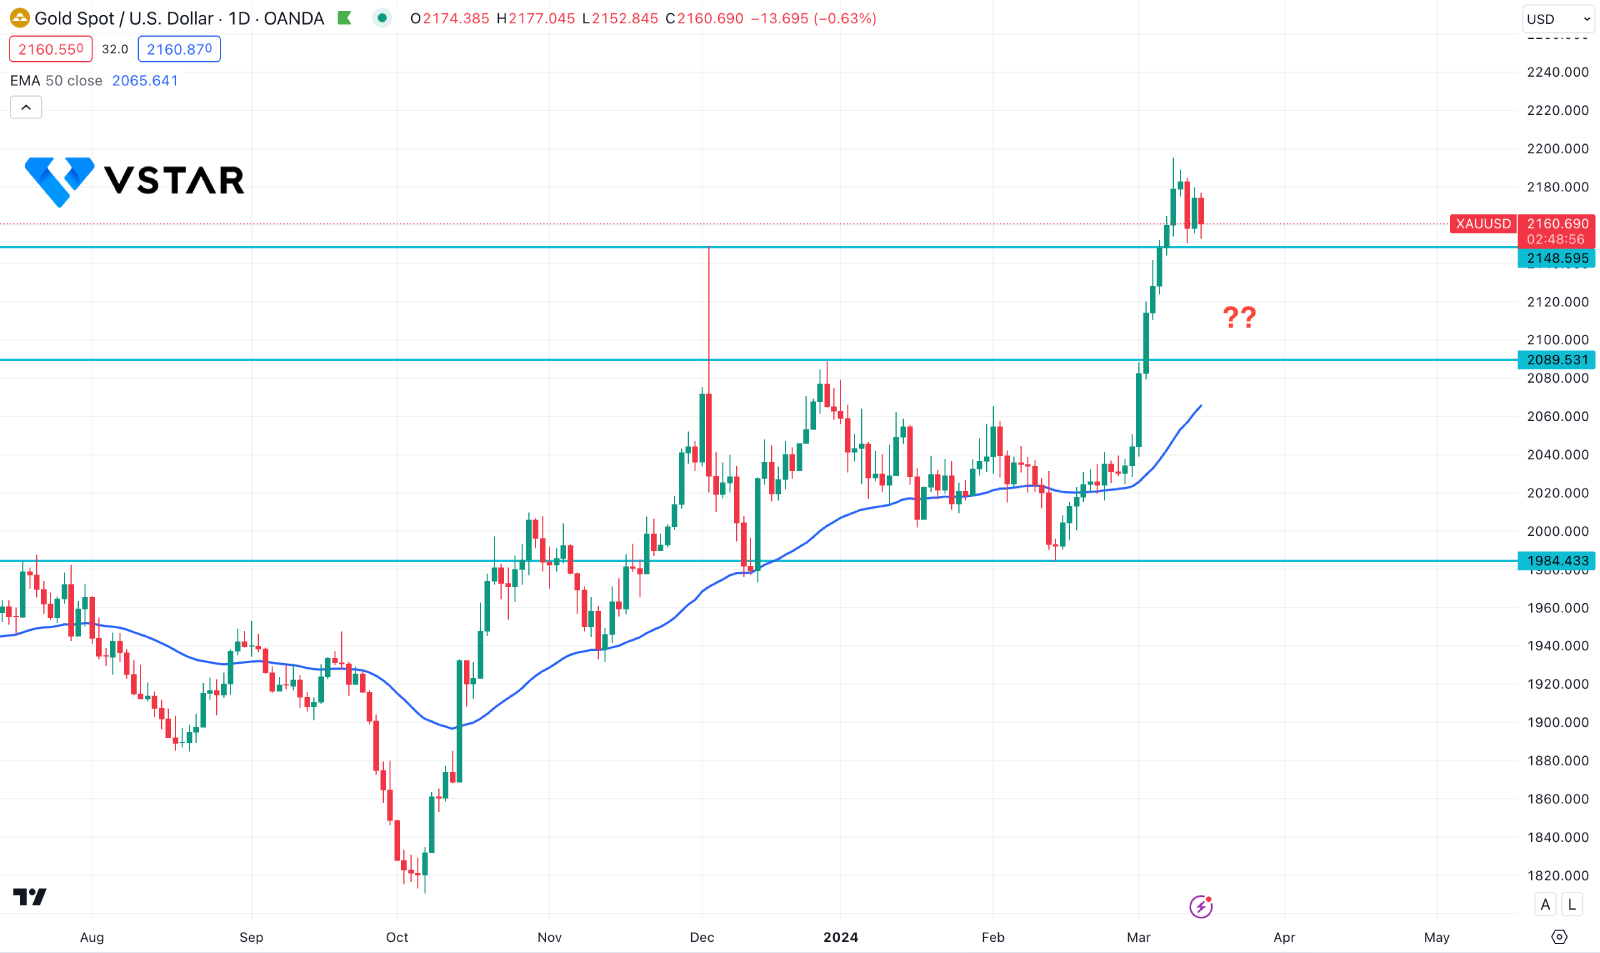
XAUUSD Technical Analysis

In the daily chart of XAUUSD, the current price trades at the 2162.00 area, which suggests an extended slide. However, the downside pressure is not confirmed as the price is still trading above the 2145.00 critical support level.
The 23.6% Fibonacci Extension level from the latest price swing suggests the next support level at the 2114.53 level.
In other technical indicators, the recent reading suggests an overbought reading, while the 20-day Exponential Moving Average is heading north above the 2089.90 static line.
Based on the daily outlook of Gold price, investors should monitor how the price reacts on the 2145.00 event level. A strong downside pressure with a bearish daily candle below this line would be a decent bearish opportunity, targeting the 2089.53 level.


