- IBM's Q1 revenue reaches $14.5 billion, showcasing diversified streams with 3% growth.
- Software segment revenue hits $5.9 billion, up 5.5%, driven by Hybrid Platform & Solutions.
- Consulting revenue remains flat at $5.2 billion, signaling a challenge.
- IBM's robust cash flow generation totals $4.2 billion, enhancing strategic flexibility.
Delve into IBM's Q1 2024 performance roller coaster, reflects resilience, yet challenges lurk with stagnant consulting revenue. Explore the intricate analysis of financial strength, innovation drive, and technical dynamics shaping IBM's stock trajectory in 2024.
IBM Strong Software Segment Growth
IBM's software segment demonstrated robust growth in the first quarter, with revenue reaching $5.9 billion, up 5.5% (5.9% at constant currency). This growth was primarily driven by the Hybrid Platform & Solutions segment, which saw a substantial increase of 6% (7% at constant currency). Notably, Red Hat, a key component of this segment, experienced a remarkable growth of 9%, indicating strong demand for IBM's hybrid cloud solutions.

Source: IBM 1Q24 Earnings
Furthermore, the automation segment within Hybrid Platform & Solutions surged by 13%, underscoring the increasing adoption of IBM's automation technologies by enterprises seeking efficiency and agility in their operations. The transaction processing segment also contributed to the overall software segment growth, with a 3% increase (4% at constant currency), reflecting sustained demand for IBM's transaction processing solutions.
IBM Diversified Revenue Streams
IBM's first-quarter revenue of $14.5 billion highlights the company's ability to maintain a diversified revenue stream. Despite an overall revenue growth of 1%, the constant currency growth of 3% demonstrates IBM's resilience across different business segments. The software segment, with a revenue of $5.9 billion, exhibited a remarkable growth of 5.5% (5.9% at constant currency). Within software, the Hybrid Platform & Solutions segment surged by 6%, indicating strong demand for IBM's software solutions in hybrid cloud and AI domains.
Consulting revenue, while flat overall, showed resilience with a 2% growth at constant currency, indicating IBM's ability to provide value-added consulting services to its clients. The infrastructure segment, although down by 1% in revenue, remained steady at constant currency, reflecting IBM's stability in providing hardware offerings despite market fluctuations.
IBM Robust Cash Flow Generation
IBM demonstrated robust cash flow generation in the first quarter, with net cash from operating activities reaching $4.2 billion, up $0.4 billion year-over-year. The company's free cash flow totaled $1.9 billion, marking a significant increase of $0.6 billion compared to the previous year. Over the last twelve months, IBM generated net cash from operating activities of $14.3 billion and free cash flow of $11.8 billion, showcasing its consistent ability to generate substantial cash flows.
IBM's Weakness in Consulting And Infrastructure Support
There is a stagnation in consulting revenue, which remained flat at $5.2 billion and saw only a slight increase of 1.7% at constant currency. Consulting revenue is a significant contributor to IBM's overall revenue stream, and any lack of growth in this area could hinder the company's rapid expansion potential. The limited increase in consulting revenue suggests that IBM may face challenges in attracting new consulting clients or in generating higher revenue from existing consulting engagements.
Furthermore, the decline in Infrastructure Support revenue by 8% to $3.1 billion, or 7% at constant currency, also highlights a weakness. While Hybrid Infrastructure and Distributed Infrastructure showed growth, the drop in Infrastructure Support revenue indicates potential challenges in maintaining revenue from support services associated with IBM's hardware offerings.

Source: IBM 1Q24 Earnings
IBM Stock Forecast 2024
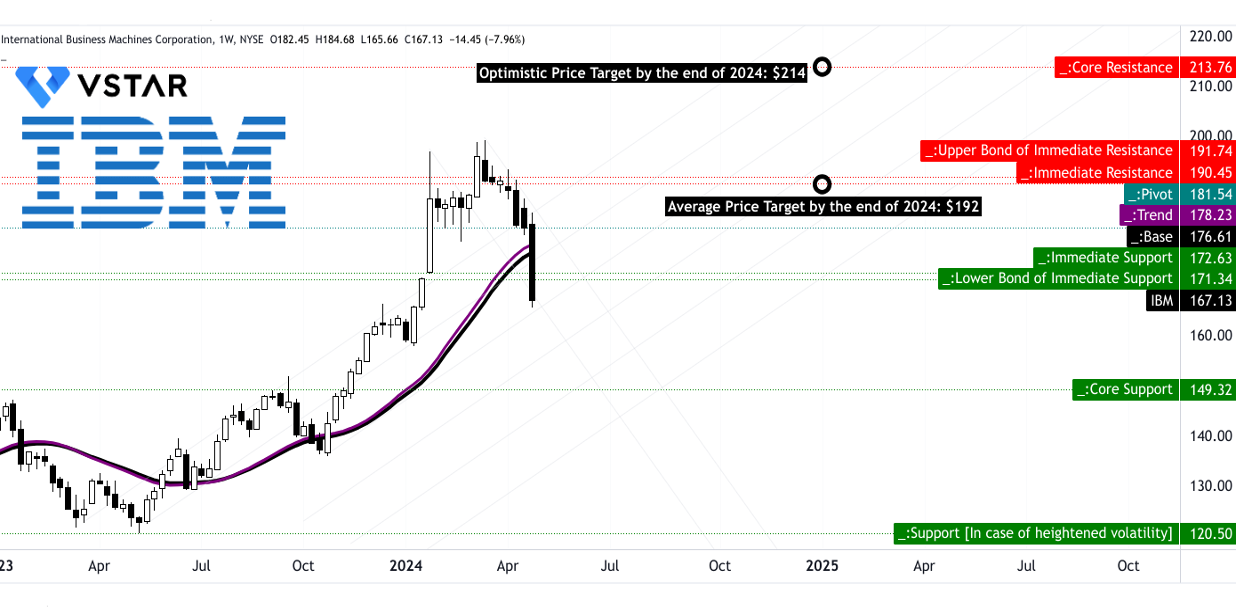
The current IBM stock price stands at $167.13, notably below the modified exponential moving average (EMA) trendline of $178.23 and the baseline of $176.61. This suggests a downward direction in the stock price. The modified EMA trendline serves as a crucial indicator, showcasing a deviation from the expected price trajectory. This deviation could signal a potential reversal or a prolonged downtrend, considering the stock's current position relative to the trendline.
The average price target for IBM by the end of 2024 is projected at $192.00, based on momentum of change-in-polarity over mid- to short-term, projected over Fibonacci retracement/extension levels. This indicates a potential upside from the current price level. However, the optimistic price target is set higher at $214.00, driven by the price momentum of the current swing over mid- to short-term, projected over Fibonacci retracement/extension levels. These targets suggest a possible rebound or recovery in the stock's price, aligning with the notion that the current downward trend might be temporary.
Source: tradingview.com
Primary resistance is observed at $171.34, indicating a significant barrier for upward movement. The pivot of the current horizontal price channel stands at $181.54, suggesting a key level to monitor for potential trend reversals. Core resistance is identified at $213.76, marking a crucial level where substantial selling pressure may occur. Core support is noted at $149.32, indicating a level where buying interest could increase significantly. In case of heightened volatility, additional support is seen at $120.50, providing a buffer against significant downside risk.
IBM Stock Price Forecast - RSI
The Relative Strength Index (RSI) currently stands at 35.66, below the regular bullish level of 64.8, indicating bearish sentiment. There are no bullish or bearish divergences observed, but the RSI line trend is downward, suggesting strengthening bearish momentum.
IBM Stock Forecast - MACD
The Moving Average Convergence/Divergence (MACD) indicator presents a bearish trend with the MACD line at 7.04 below the signal line at 9.17. The MACD histogram at -2.130 indicates increasing strength in the bearish trend, signaling potential further downside movement in the stock price.

Source: tradingview.com
Conclusion
Despite fundamental strengths like diversified revenue and robust cash flow, IBM faces challenges with stagnant consulting revenue. Technical analysis signals a downward price trend, although price targets suggest potential rebound.