


EURUSD
Fundamental Perspective
On Friday, the EUR/USD reached a three-week low due to a December uptick in European inflation. The Eurozone Harmonized Index of Consumer Prices (HICP) for December rose to 2.9%, up from November's 2.4%. Despite a market expectation of 3.0%, any inflation increase, even below the forecast, diminishes the likelihood of the European Central Bank (ECB) reducing interest rates to cut borrowing and lending costs.
Subsequently, the EUR/USD rebounded to a three-day high of around 1.1000 after US Nonfarm Payrolls (NFP) surpassed expectations, adding 216K new jobs in December, beating the anticipated 170K. Additionally, US Average Hourly Earnings rose to 4.1%, exceeding the expected 3.9% decrease and slightly surpassing November's 4.0% figure.
Technical Perspective
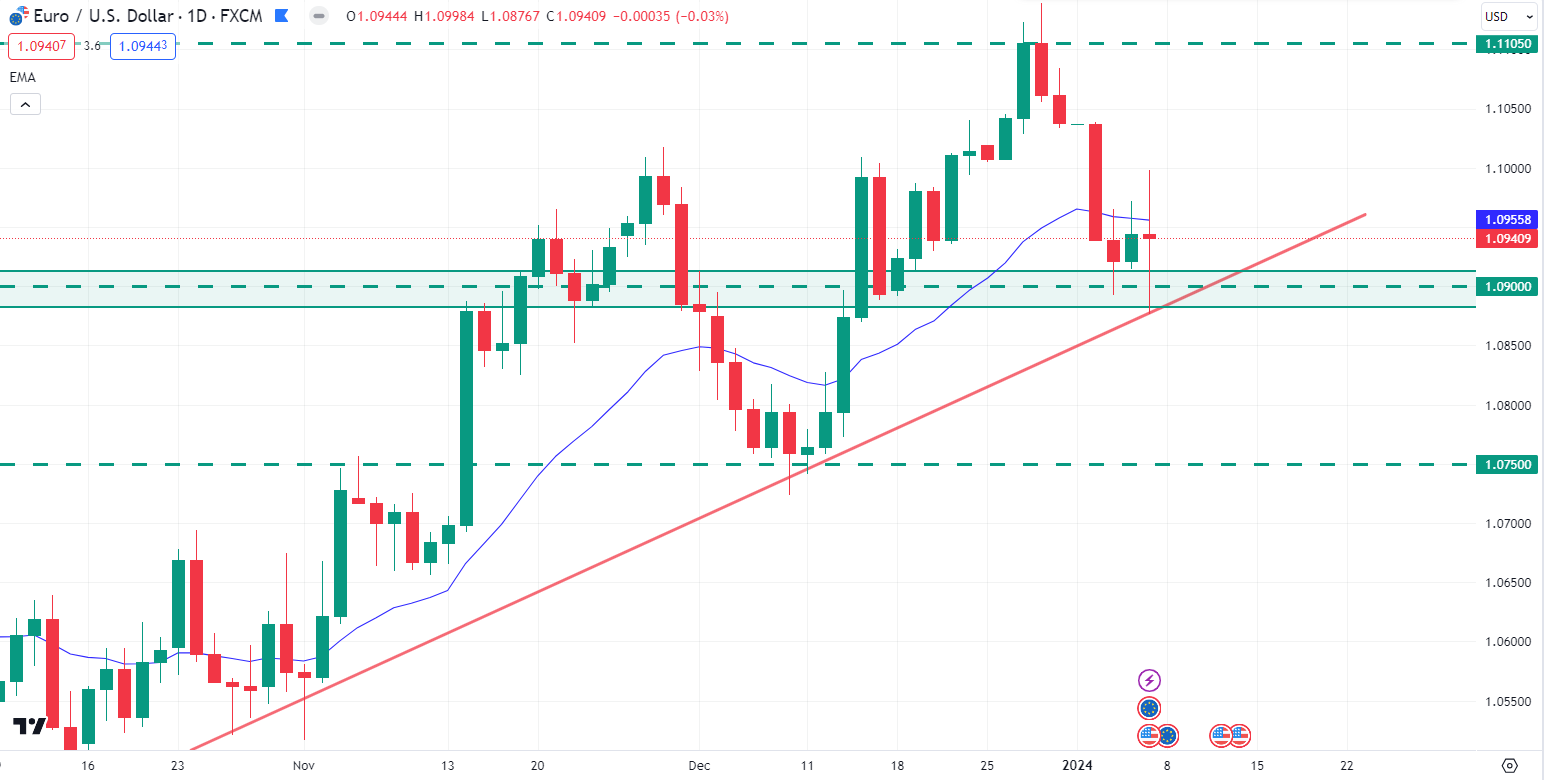
Image: TradingView
In the weekly chart, after rejecting from the 1.1100 price area with a weekly bullish rejection candle, bears regained momentum and pushed the price down to the 1.0875 price area. However, the weekly bearish candle closed below the dynamic level of 20 EMA, which indicates that the possible bearish pressure may be seen in the upcoming days.
In the daily chart, the momentum of EURUSD is still bullish as the price bounced from the 1.0900 psychological support level and the bullish trend line. So, if the price can have a daily bullish candle close above the 20 EMA, bulls may sustain the bullish pressure toward the 1.1105 price area again in the coming days.
On the bearish side, if the price can break below the bullish trend line and has a daily bearish candle close below the 1.0900 price area, bears may regain momentum and push the price down to the 1.0750 event area in the days ahead.
GBPJPY
Fundamental Perspective
The Bank of England (BoE) reported that Britons heavily leaned on credit, reaching a seven-year high in November, indicating reduced concerns about the BoE's elevated interest rates. Simultaneously, S&P Global noted a positive trend in the services sector, with business activity climbing from 50.9 in November to December's seven-month high of 53.4, surpassing the expected 52.7. The S&P Global Composite PMI, covering manufacturing and services, rose from 50.7 in November to 52.1 in December.
Pound Sterling (GBP) pairs like GBP/USD and GBP/JPY are supported as UK 10-year Gilts yield 3.74%, twelve basis points higher than Wednesday's close. In contrast, Japan's Jibun Bank Manufacturing PMI for December disappointed at 47.9, suggesting the Bank of Japan (BoJ) might delay normalizing monetary policy.
Technical Perspective
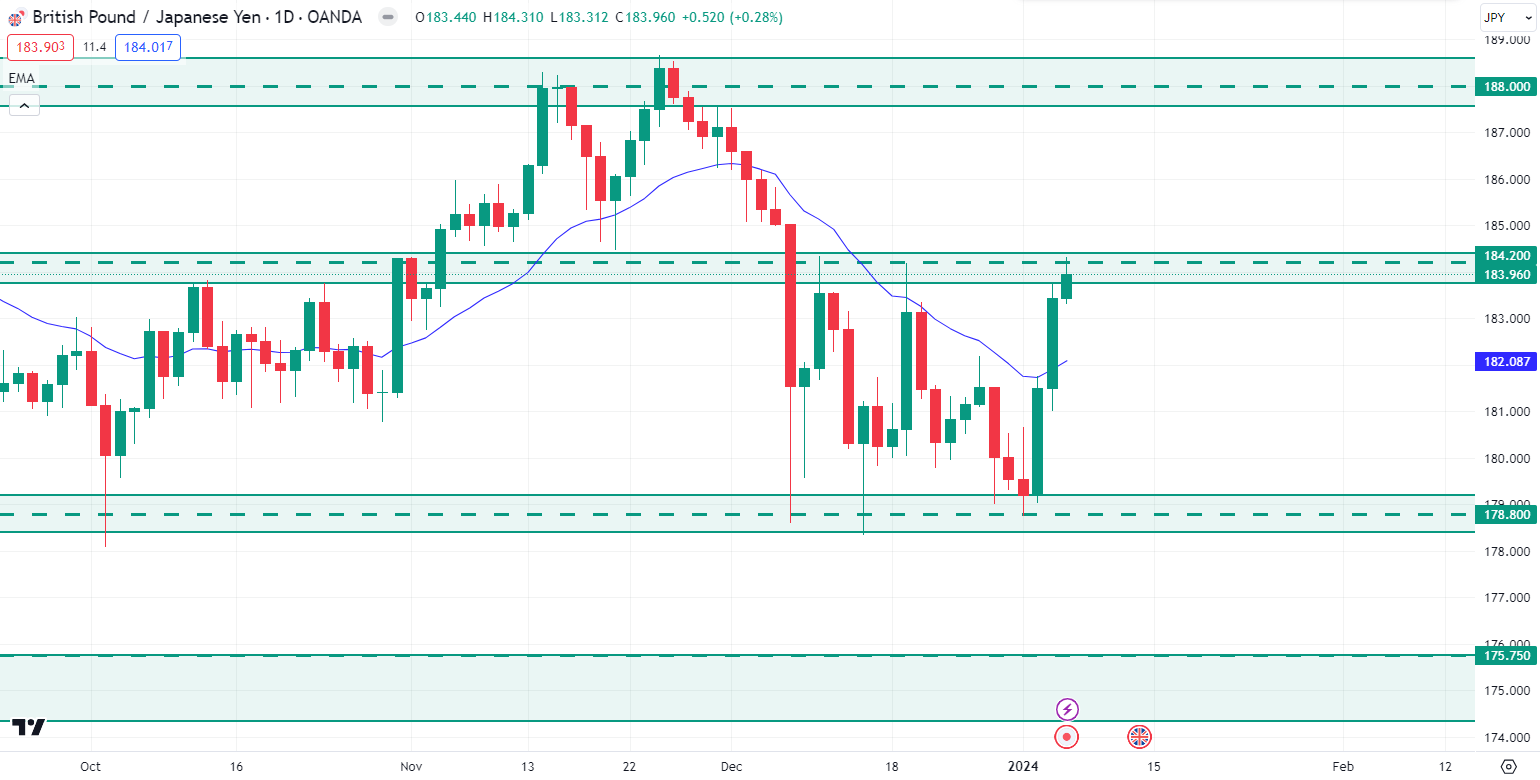
Image: TradingView
In the weekly chart, GBPJPY showed strong bullish pressure after bouncing from the 178.80 event level and had an impulsive bullish candle close above the 183.00 psychological price area.
In the daily chart, GBPJPY is still trading in the 178.80 - 184.20 price area range. However, as per the weekly candle, there is a possibility that GBPJPY may strike further higher. So, if the price can break above the 184.20 resistance area with a daily bullish candle close, bulls may sustain the bullish pressure toward the 188.00 price area.
On the bearish side, if the price can break below the 178.80 support level with a daily bearish candle close, bears may regain momentum and push the price down to the 175.75 demand zone area in the coming days.
Nasdaq 100 (NAS100)
Fundamental Perspective
As of the latest information available, the NAS100, representing the top 100 non-financial companies on the NASDAQ, is poised for potential volatility in the upcoming week of January 8th to 12th, 2024. Market analysts anticipate the index to be influenced by macroeconomic factors such as employment reports, inflation data, and global trade tensions. Keep an eye on tech sector earnings, particularly from major companies like Apple, Google, and Amazon, as they can significantly impact NAS100 movements. Additionally, geopolitical developments and central bank announcements may contribute to market fluctuations. Traders are advised to stay informed and exercise caution in their investment decisions.
Technical Perspective
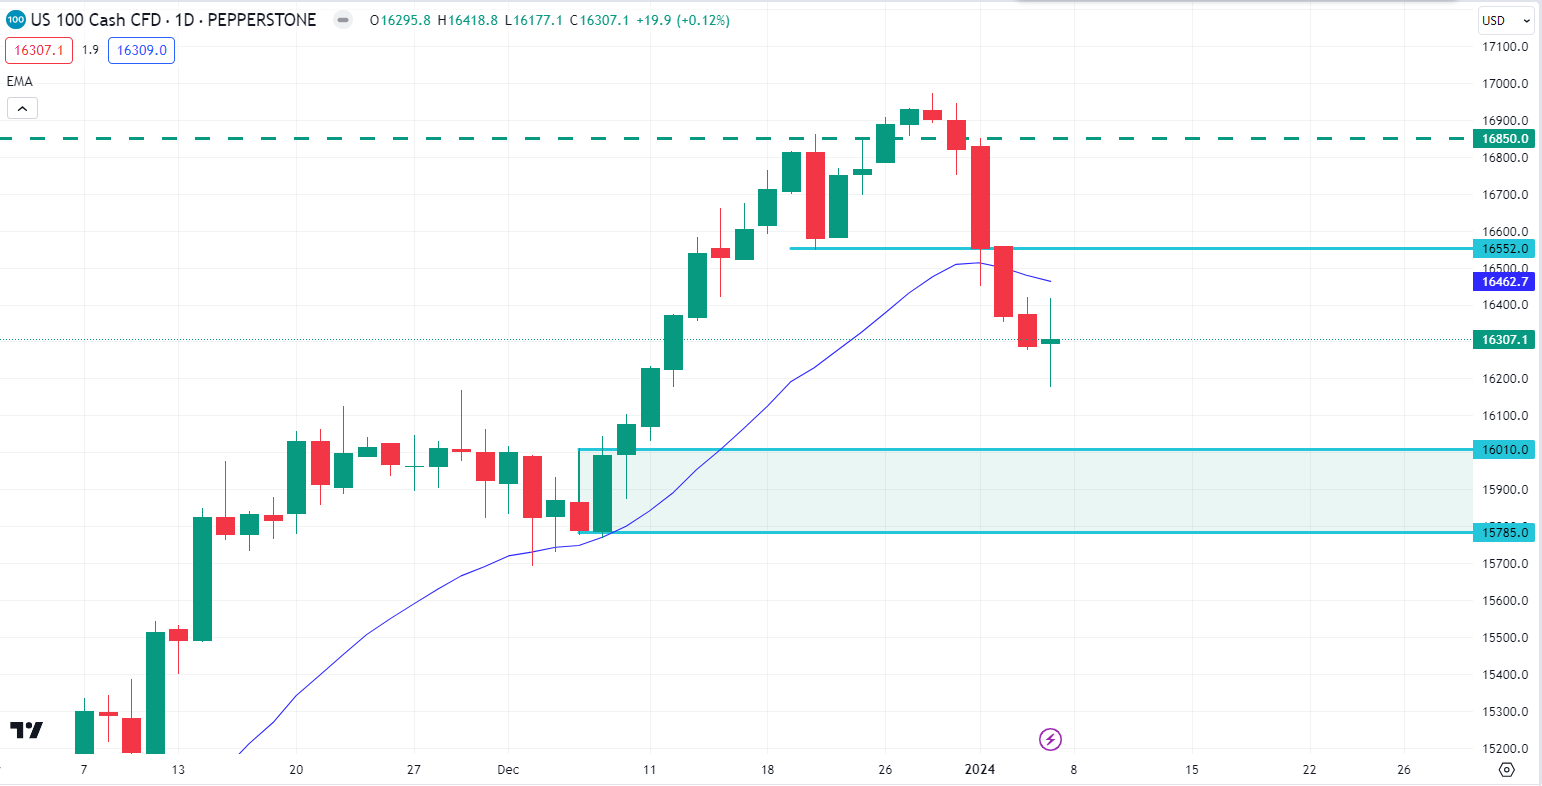
Image: TradingView
In the weekly chart, NAS100 had a weekly bearish engulfing candle close after rejecting the $16850.0 psychological resistance area. As per the weekly candle, there is a high probability that NAS100 may continue further lower after retracing 50% of the engulfing candle.
In the daily chart, the NAS100 price may retrace upside toward the $16552.0 neckline area. So, if the price retraces toward the $16552.0 price area and rejects with an impulsive bearish candle close, bears may push the price down to the demand zone, which is around the $16010.0 - 15785.0 price area.
On the bullish side, if the price comes down to the $16010.0 - 15785.0 demand zone area and bounces with an impulsive daily bullish candle close, bulls may sustain the bullish pressure toward the $16552.0 price area again in the coming days.
S&P500 (SPX500)
Fundamental Perspective
Heading into the week of January 8th to 12th, 2024, the S&P 500, a key benchmark for U.S. stocks, faces potential market shifts based on recent developments. Investors should closely monitor economic indicators like employment numbers and inflation rates, which can sway the index. Earnings reports from major companies, including those in the financial and technology sectors, will likely impact the S&P 500.
Global events and central bank statements should also influence market sentiment. Traders are advised to stay attuned to the latest news and exercise prudent decision-making as the index responds to dynamic economic factors during the upcoming week.
Technical Perspective
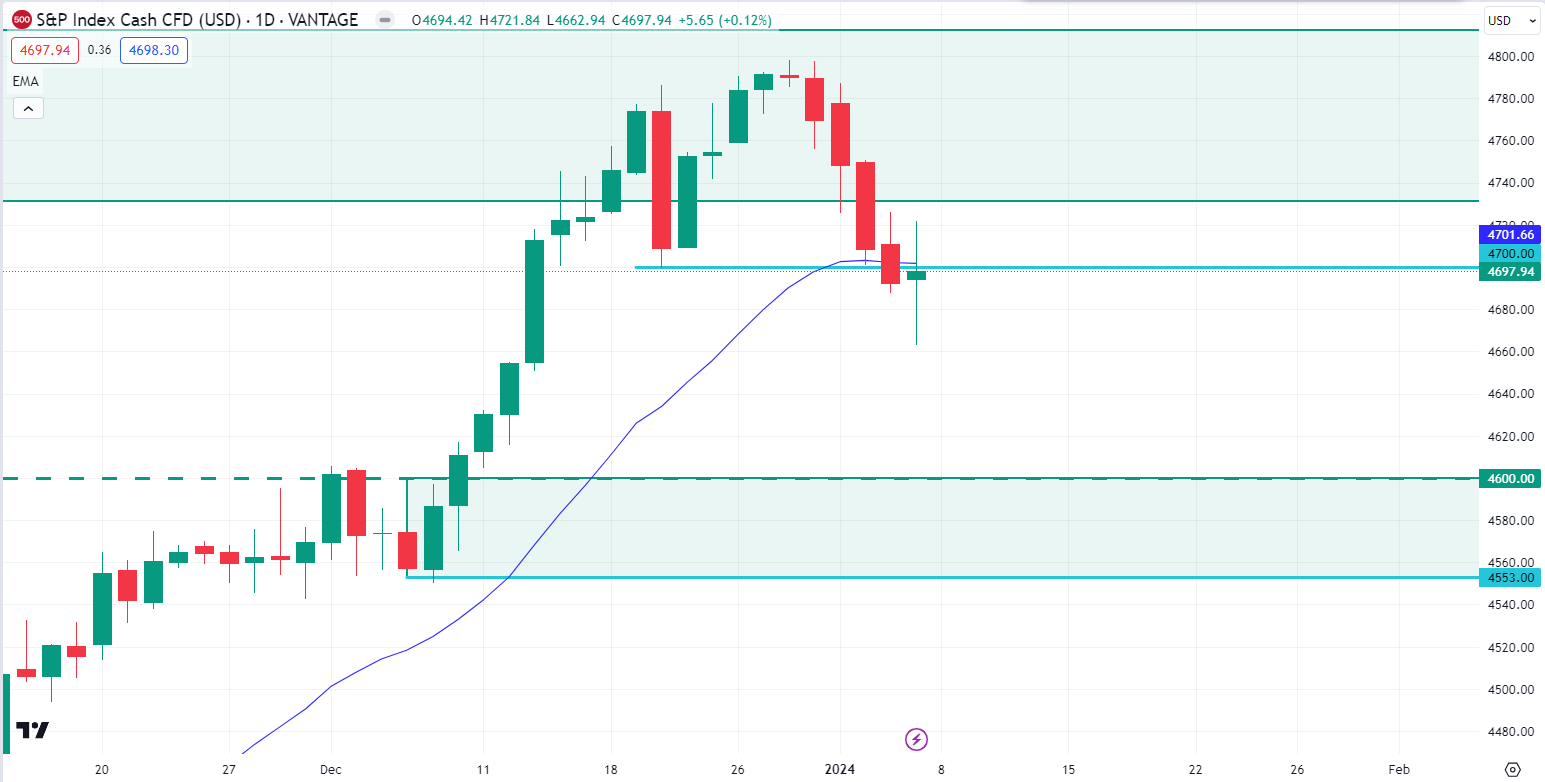
Image: TradingView
In the weekly chart, the S&P500 closed with a bearish engulfing candle for the recent weekly order block area. Also, the price had a bearish candle close below the weekly 20 EMA.
In the daily chart, after breaking below the $4700.00 neckline area with a daily bearish candle, the price retraced and had a daily bullish indecision candle close. So, if the price can have a daily bearish candle close below the $4700.00 neckline area, bears may continue further lower toward the $4600.00 price area in the days ahead.
On the bullish outlook, if the price comes down to the $4600.00 - $4553.00 demand zone area and bounces with an impulsive daily bullish candle close, bulls may sustain the bullish pressure toward the $4700.00 price area again in the coming days.
Hang Seng Index (HK50)
Fundamental Perspective
As we approach the week of January 8th to 12th, 2024, the HK50 index, reflecting the performance of the Hong Kong stock market, is subject to potential market dynamics. Recent data indicates that geopolitical tensions, trade developments, and economic indicators may influence the index. Keep an eye on key sectors, especially finance and technology, for potential market-moving events. Additionally, central bank actions and global economic conditions could impact the HK50. Investors are advised to stay informed about the latest news and exercise caution, recognizing the potential for shifts in market sentiment during the upcoming week.
Technical Perspective
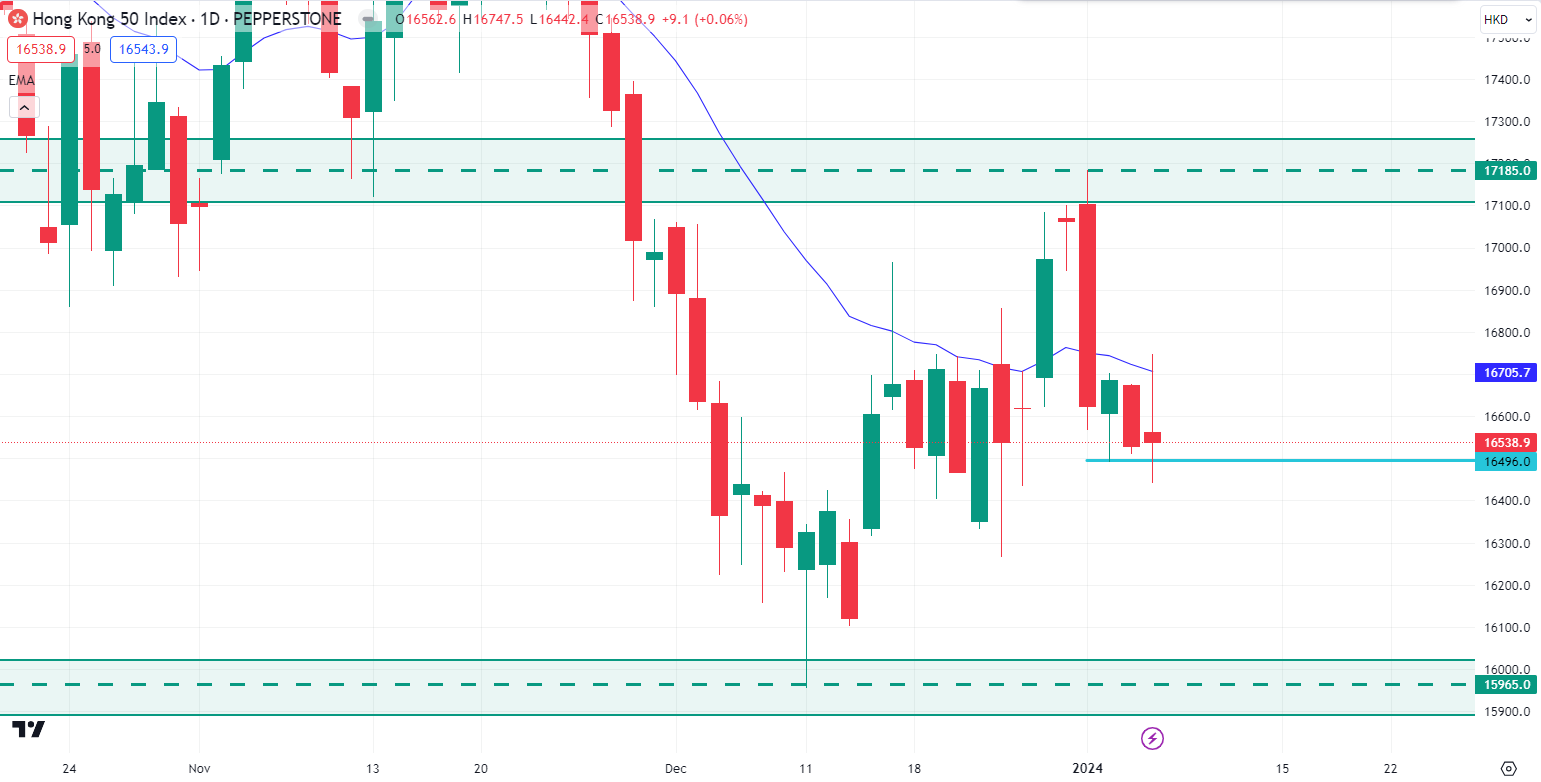
Image: TradingView
In the weekly chart, HK50 engulfed almost 80% of the previous bullish candle, which could work as a downside continuation possibility.
In the daily chart, the price trades below the dynamic level of 20 EMA. Therefore, a downside continuation with a daily candle below the $16496.0 price area could aim for the $15965.0 price area.
On the bullish side, the $15965.0 support level would be a strong barrier as a bounceback from this area could increase the price towards the $17185.0 price area.
Bitcoin (BTCUSD)
Fundamental Perspective
Bitcoin (BTC) is hovering within the weekly supply zone, attempting to break its mean threshold, but facing caution from both traditional and perpetual traders. The market is in a holding pattern, awaiting a decision from the US Securities and Exchange Commission (SEC) regarding spot BTC exchange-traded funds (ETFs). With the January 5 to 10 window officially open, trading volume has decreased as traders await the next market narrative. While excitement about the launched product is already factored in, the market is now focused on the upcoming SEC decision, with some overestimating its short-term impact and underestimating its long-term benefits. In the short term, Crypto Rover predicts a potential 5% to 10% surge in Bitcoin's value upon approval, followed by a sell-off in the subsequent days triggered by developing news.
Technical Perspective
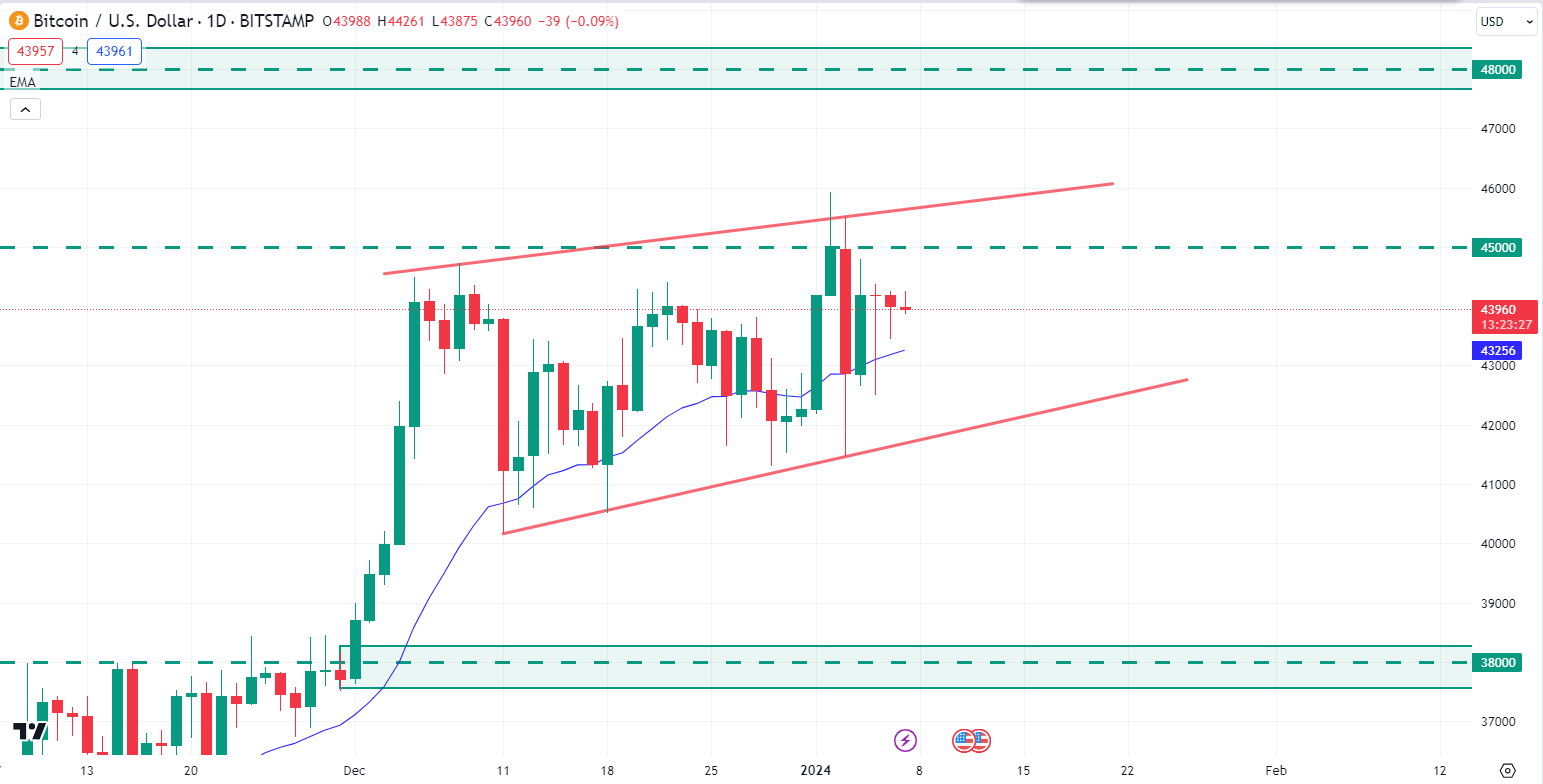
Image: TradingView
In the weekly chart, BTC continued higher with an inside bar continuation, supported by the broader bullish trend.
However, the daily price remains within an ascending channel; a break above the channel’s resistance could aim for the $48000 price area.
On the bearish outlook, if the BTC price can break below the bullish channel’s support with a daily bearish candle close, bears may regain momentum and retrace down to the $38000 demand zone in the coming days.
Ethereum (ETHUSD)
Fundamental Perspective
Ethereum's on-chain data reveals a significant exit queue, currently requiring a wait time of 5 days and 4 hours. Celsius announced plans to unstake its ETH holdings to cover restructuring costs, with over $1.09 billion worth of ETH set to be removed from the Ethereum validator chain. The Ethereum Shanghai update allowed investors to withdraw staked ETH, leading to the highest count of validator exits on Friday, marking a historic moment. The current exit queue boasts 15,358 validators, and the anticipated wait time is five days and 4 hours. Despite the substantial outflow, Ethereum, with over 905,000 validators and 28.8 million ETH staked, representing nearly 24% of the circulating supply, is expected to withstand the impact on network dynamics and price action.
Technical Perspective
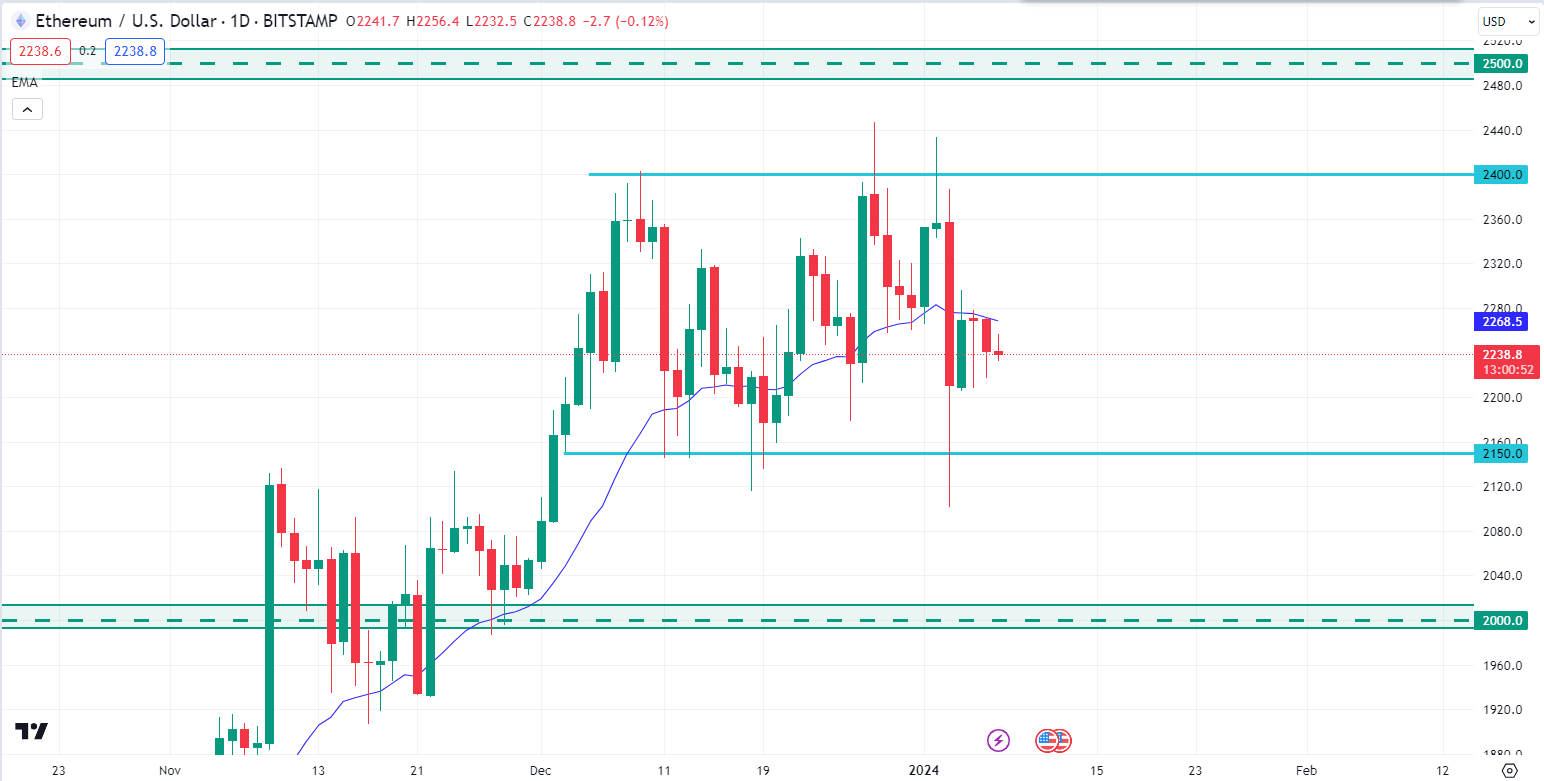
Image: TradingView
In the weekly chart, ETH had a bearish indecision candle close after rejecting the bullish channel’s resistance. The price is struggling to break below December’s 1st weekly bullish candle low and has four consecutive candles inside it.
In the daily chart, the price is currently trading inside the range of $2400.00 - $2150.00 price area. So, if the price can break below the $2150.00 support level with a daily bearish candle close, bears may push the price down to the $2000.00 psychological price area in the coming days.
On the bullish outlook, if the price can break above the $2400.00 resistance level with a daily bullish candle close, bulls may sustain the bullish pressure toward the $2500.00 event area in the days ahead.
Tesla Stock (TSLA)
Fundamental Perspective
Entering the week of January 8th to 12th, 2024, Tesla (TSLA) investors should note potential market movements based on recent developments. Industry experts anticipate TSLA's stock performance to be influenced by electric vehicle (EV) market trends, global supply chain dynamics, and government policies promoting sustainable energy. Keep a close eye on quarterly earnings reports, which could impact investor sentiment.
Any breakthroughs or setbacks in autonomous driving technology could also affect TSLA's trajectory. With the electric vehicle sector rapidly evolving, staying informed about the latest news and market trends is crucial for investors navigating the upcoming week's potential shifts in TSLA's value
Technical Perspective
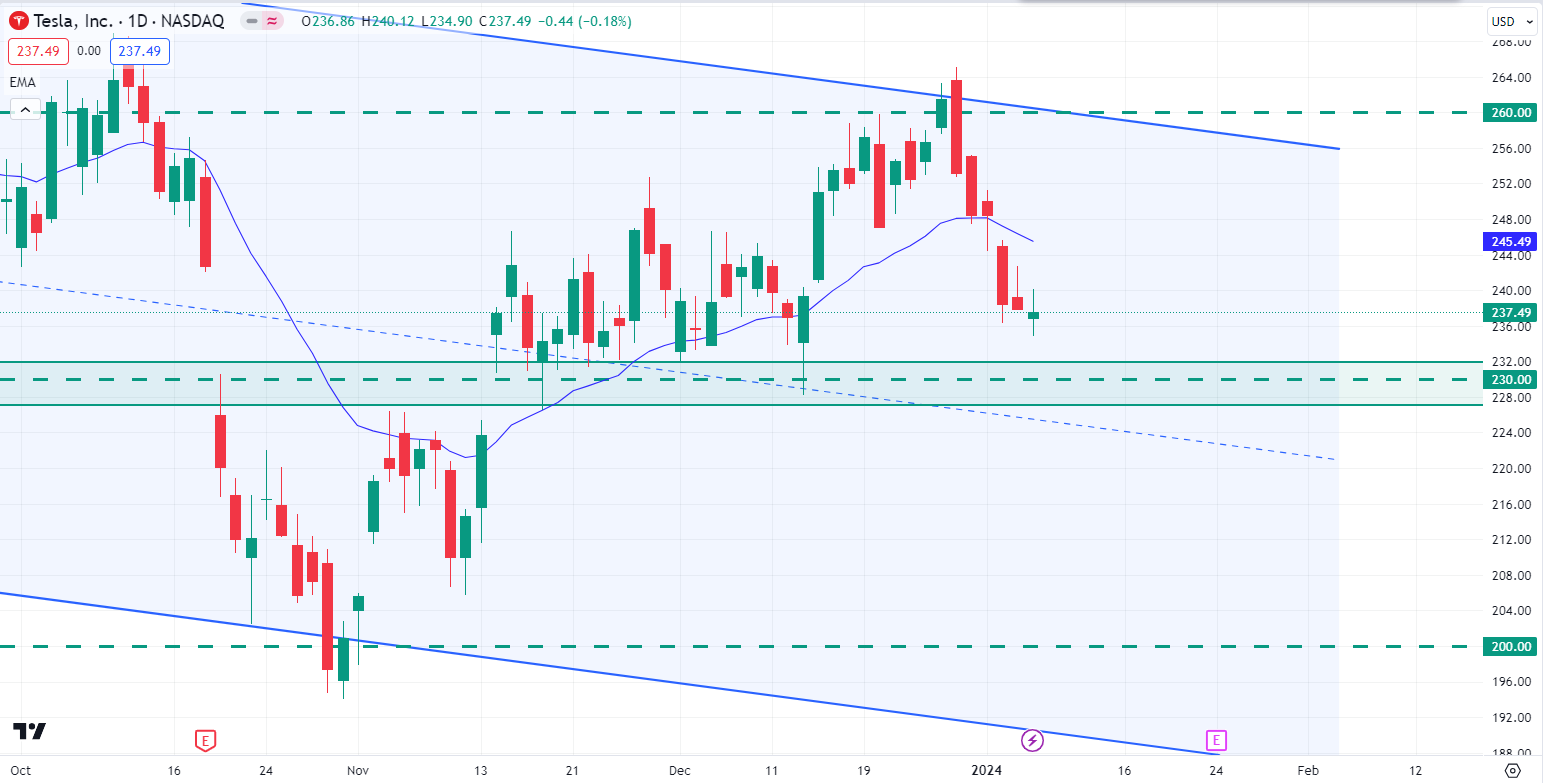
In the weekly chart, TSLA stock pushed lower after rejecting the flag pattern’s resistance with a weekly bearish pin bar. The bearish candle after the pin bar suggests a trend continuation toward the sellers' side.
In the daily chart, the TSLA stock price may continue toward the $230.00 support level. So, a selling pressure to the $230.00 support level and a bounceback could increase the price toward the $260.00 price area.
On the bearish side, the $230.00 support level would be a crucial area to look at. A downside pressure below this line could extend the loss toward the $200.00 psychological support level.
GOLD (XAUUSD)
Fundamental Perspective
In Friday's trading session, the XAU/USD metal experienced a dip, showing volatility in response to mixed US economic data, indicating a robust US labor market but a weaker service sector. Investors swiftly adjusted their expectations on the Federal Reserve (Fed), shifting from a dovish stance to betting on an earlier start to the easing cycle.
December showcased a strong US labor market, with the Nonfarm Payrolls report surpassing expectations by adding 216,000 jobs, beating the forecast of 170,000. This marked a notable improvement from the previous month's edition of 173,000 jobs. Additionally, Average Hourly Earnings rose by 0.4%, exceeding the predicted 0.3%, matching the previous month's rate. The Unemployment Rate for the month remained stable at 3.7%, slightly below the expected 3.8%.
Technical Perspective
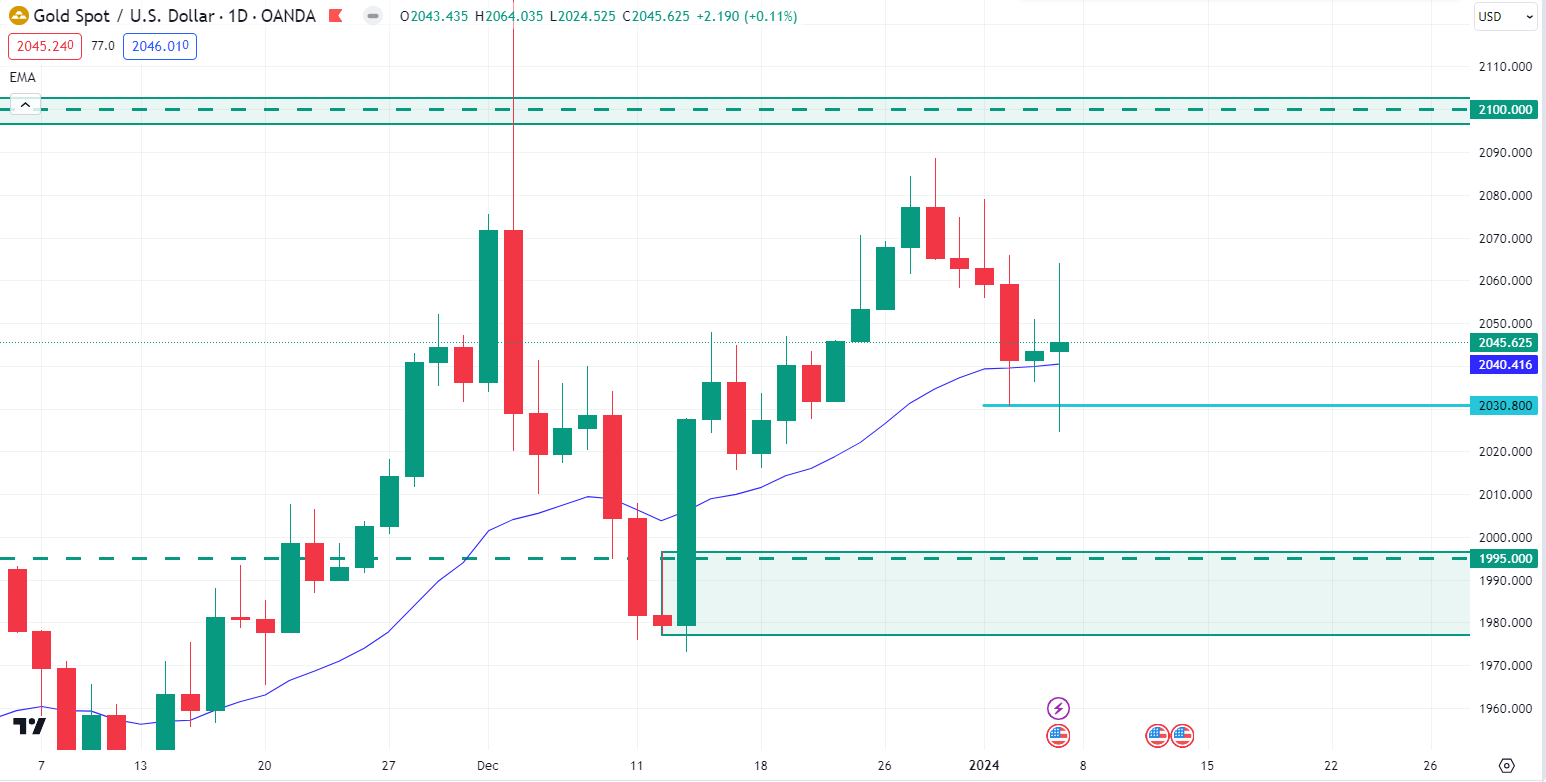
Image: TradingView
The Gold price still trades inside the weekly bearish mother bar in the weekly chart. After creating a bearish mother bar, bulls pushed the price higher with three consecutive bullish candles but failed to take over the mother bar high and had a bearish candle close last week.
The dynamic level of 20 EMA in the daily chart still holds the price as strong support. So, if the price had a daily bullish candle close above the 20 EMA next Monday, bulls may sustain the bullish pressure toward the $2100.00 price area in the days ahead.
On the bearish outlook. If the price can break below the $2030.80 price area with a daily bearish candle, bears may regain momentum and push the price down to the $1995.00.
WTI Crude Oil (USOUSD)
Fundamental Perspective
West Texas Intermediate (WTI) US Crude Oil saw another increase on Friday, reaching 74.27, driven by ongoing tensions in the Middle East impacting energy markets. Logistics and shipping companies are diverting cargo ships away from the Suez Canal to steer clear of Houthi rebel-infested waters near Yemen's coast. This has rerouted Europe-Asia shipping lanes around Africa. A US-led naval coalition is facing challenges in securing Yemeni shores from Iran-backed Houthi rebels, who target civilian ships. The Israel-Hamas conflict adds to regional instability.
Iran, aiming for higher Crude Oil prices, reportedly suspends shipments to China until an agreement on elevated prices is reached, as per unnamed oil industry sources cited by Reuters.
Technical Perspective
In the weekly timeframe, after a bearish pin bar close below the dynamic level of 20 EMA, bulls again regained momentum and pushed the price higher with a weekly bullish pin bar last week.
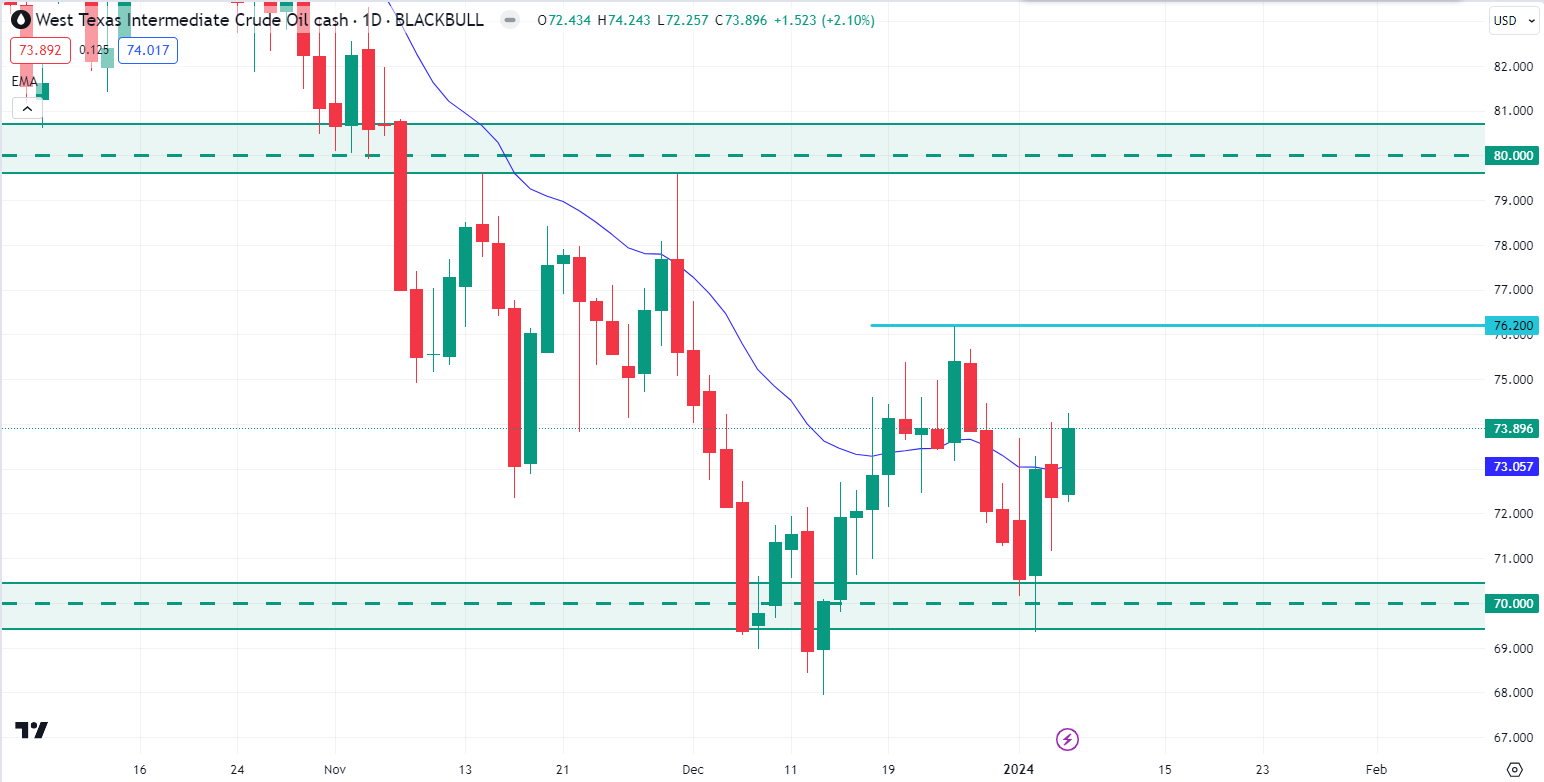
Image: TradingView
In the daily chart, if bulls push the price further upside and break above the $76.20 neckline area with a daily bullish candle close, bulls may continue further upside toward the $80.00 price area in the coming days.
On the bearish outlook, if the price rejects the $76.20 neckline area with a daily bearish candle close, bears may regain momentum and push the price down to the $70.00 price area again in the days ahead.


