


EURUSD
Fundamental Perspective
Over the previous week, investor conjecture surged concerning the potential rate-cut cycles by the European Central Bank (ECB) and the Federal Reserve (Fed).
About the Federal Reserve, the hawkish Fed suggested a reluctance to pursue a "soft landing." As a result, the probability of an interest rate cut occurring in June has become progressively more credible.
On Friday, Richmond Fed President Thomas Barkin even speculated that the Federal Reserve might refrain from implementing rate cuts for the remainder of the year. Concurrently, the CME’s FedWatch Tool projected a 52% change in interest rate cuts at the meeting on June 12.
On the other hand, Peter Kazimir, a member of the ECB's Board, elaborated on the ECB's stance by proposing a rate cut in June. Furthermore, Vice President Luis de Guindos indicated that the Governing Council of the ECB is prepared to make modifications to monetary policy in light of newly received data.
Technical Perspective
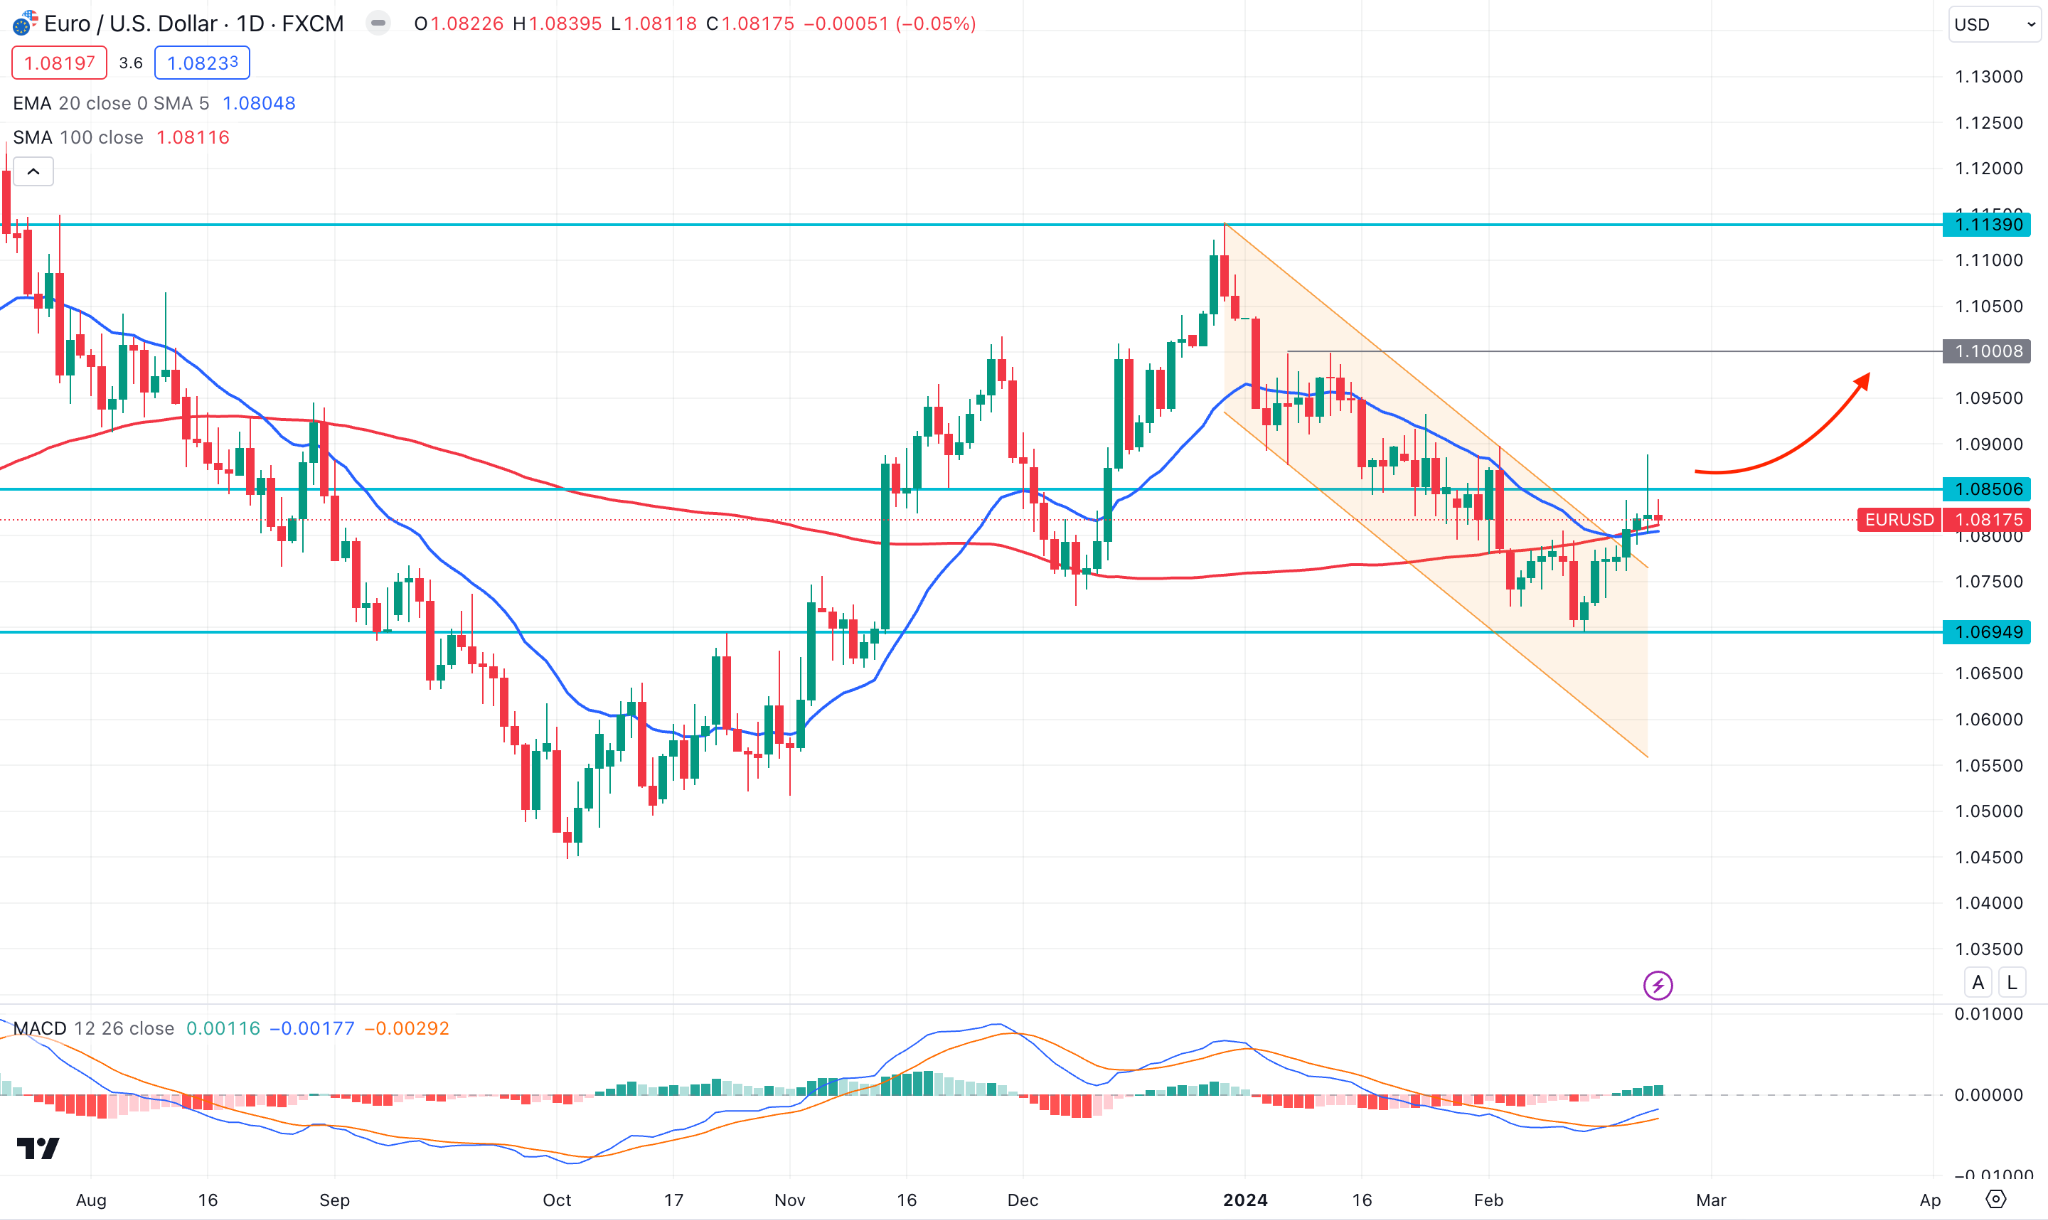
After a bullish weekly close, the latest candle closed sideways, suggesting a need for a breakout before confirming a stable trend.
In the daily chart, a descending channel breakout and a symmetrical triangle formation suggest a potential bullish opportunity after a valid breakout.
The ideal trading approach for this pair is to look for a daily candle above the 1.0866 static resistance level before aiming for the 1.1000 mark.
On the other hand, a failure to hold the momentum above the dynamic 20-day EMA could make it challenging for bulls. A bearish continuation is possible but needs a stable market below the 1.0795 line.
GBPJPY
Fundamental Perspective
In the absence of significant economic data releases in the United Kingdom, the focus is shifted towards macroeconomic updates in Japan.
As a result of Ueda's remarks, which indicated it was premature to reach the 2% inflation objective of the central bank, the GBP strengthened against the yen. Ueda underscored the critical nature of scrutinizing additional data about wage projections.
In contrast, BOJ board member Hajime Takata expressed on Thursday the possibility of modifying the ultra-loose monetary policy of the central bank. Takata suggested that negative interest rates and bond yield control measures be reconsidered.
The trajectory of BOJ policy and inflation expectations are likely to be contingent on the outcome of wage hike negotiations between major corporations and labor unions.
Technical Perspective
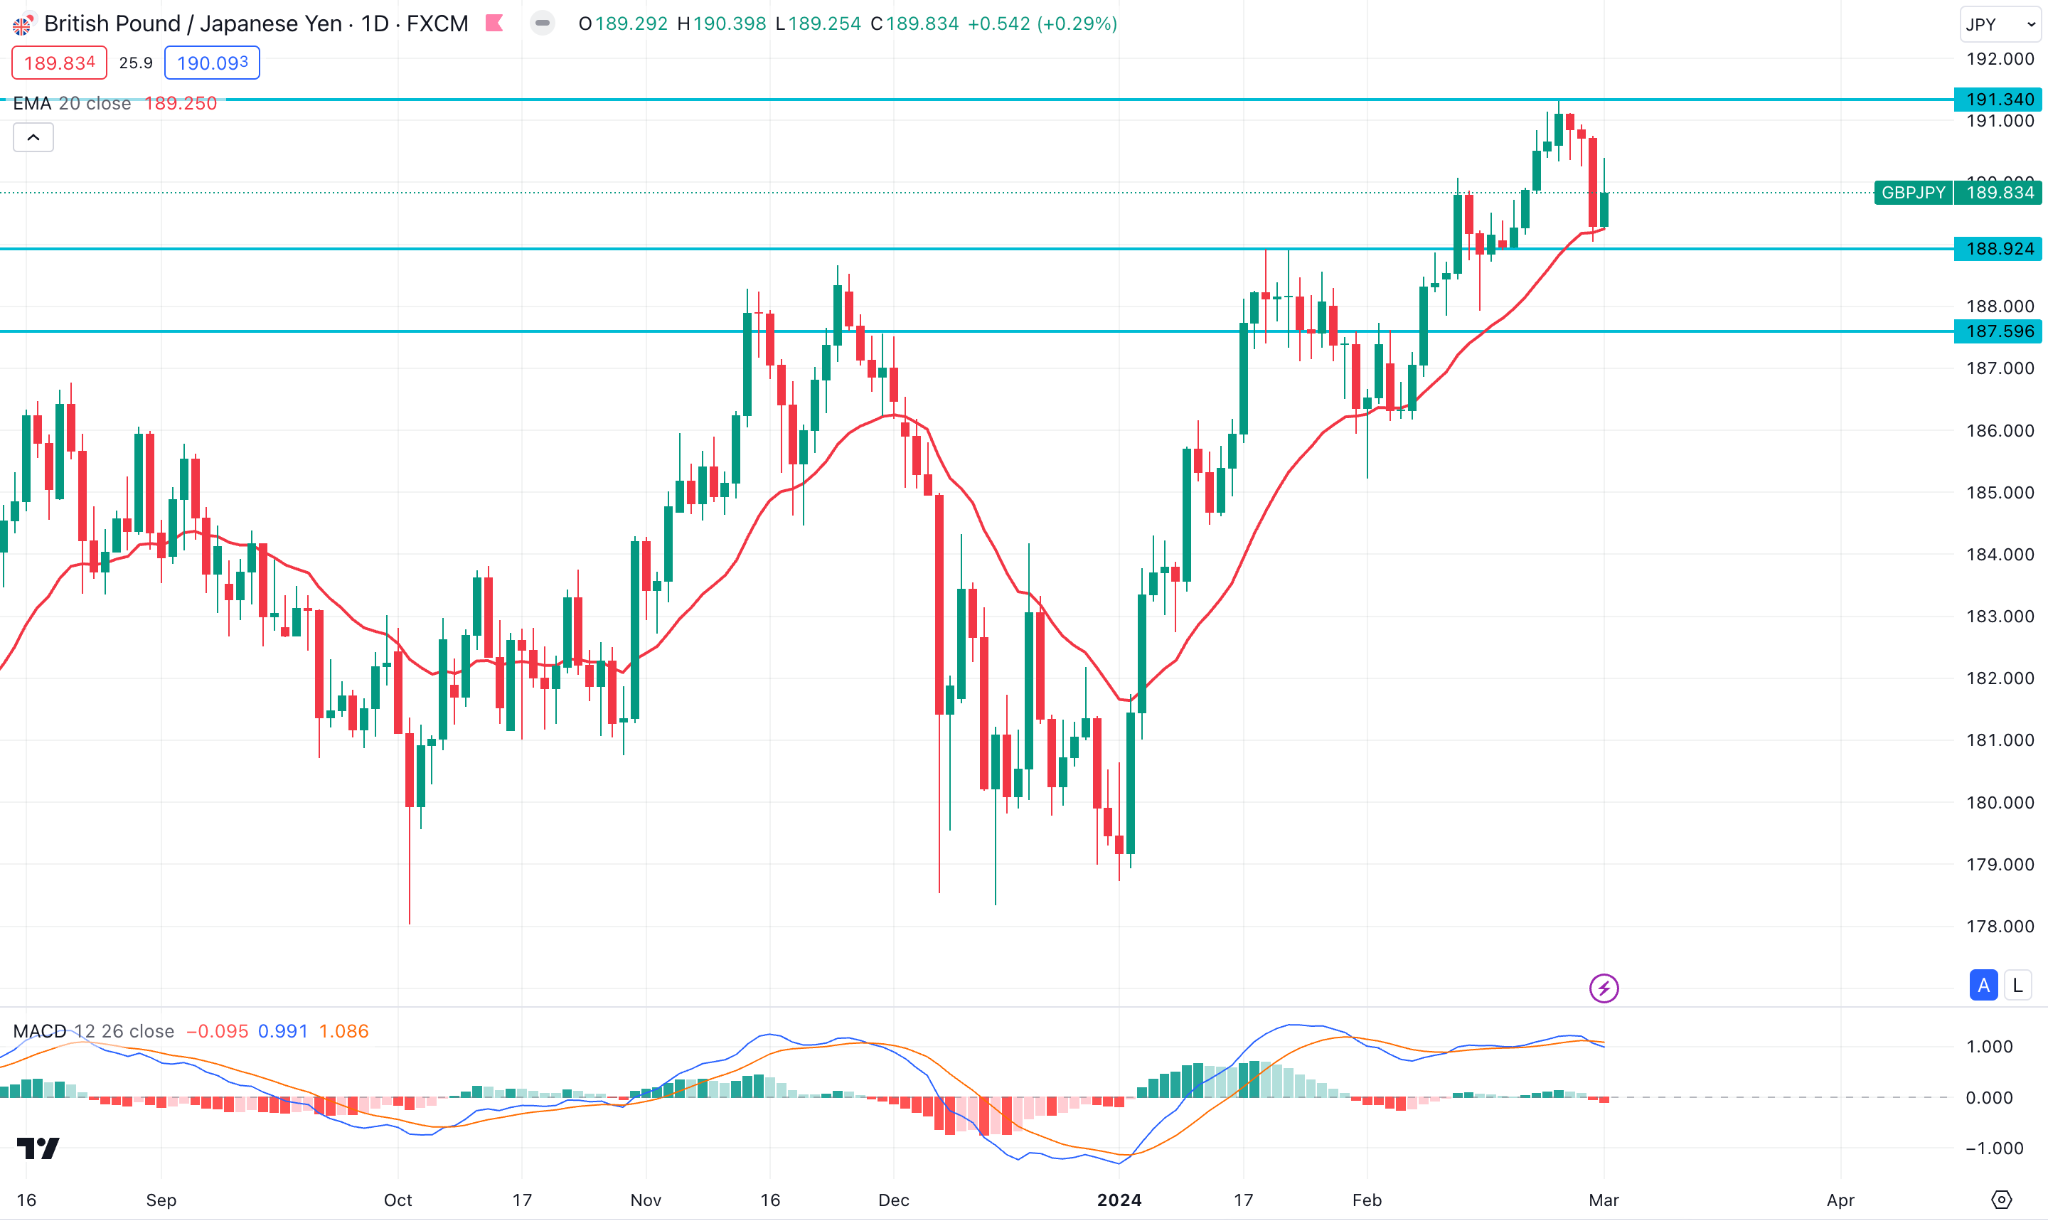
After three consecutive bullish weeks, GGBPJPY posted a selling pressure with a bearish close. However, the selling pressure remained within an inside bar, not sufficient to consider a trend reversal.
In the daily chart, the recent price faced counter-impulsive selling pressure and found a bottom at the dynamic 20-day EMA support. In that case, more selling pressure with a daily close below the 188.92 static support could validate the short opportunity targeting the 1887.59 level.
On the other hand, the ongoing buying pressure might resume, where a short-term bullish signal from the intraday price could increase the price toward the 191.34 high.
Nasdaq 100 (NAS100)
Fundamental Perspective
Optimism regarding advancements in artificial intelligence pushed global equities to all-time highs. Moreover, there is no expectation for the Nasdaq 100, which reached a record high last week.
A renewed interest in AI technology was fueled by the significant influence that corporate earnings emphasized its had on revenue streams and company performance. In response to positive AI-related data, Dell Technology experienced an extraordinary 28% increase. In contrast, AMD and Nvidia attained new all-time highs on the strength of demand for AI-related equities.
Among crucial releases for this week are Sea Limited (SEA), CrowdStrike Holdings, Inc. (CROWD), Target Corporation (TGT), JD.com, Inc. (JD), and many more.
Technical Perspective
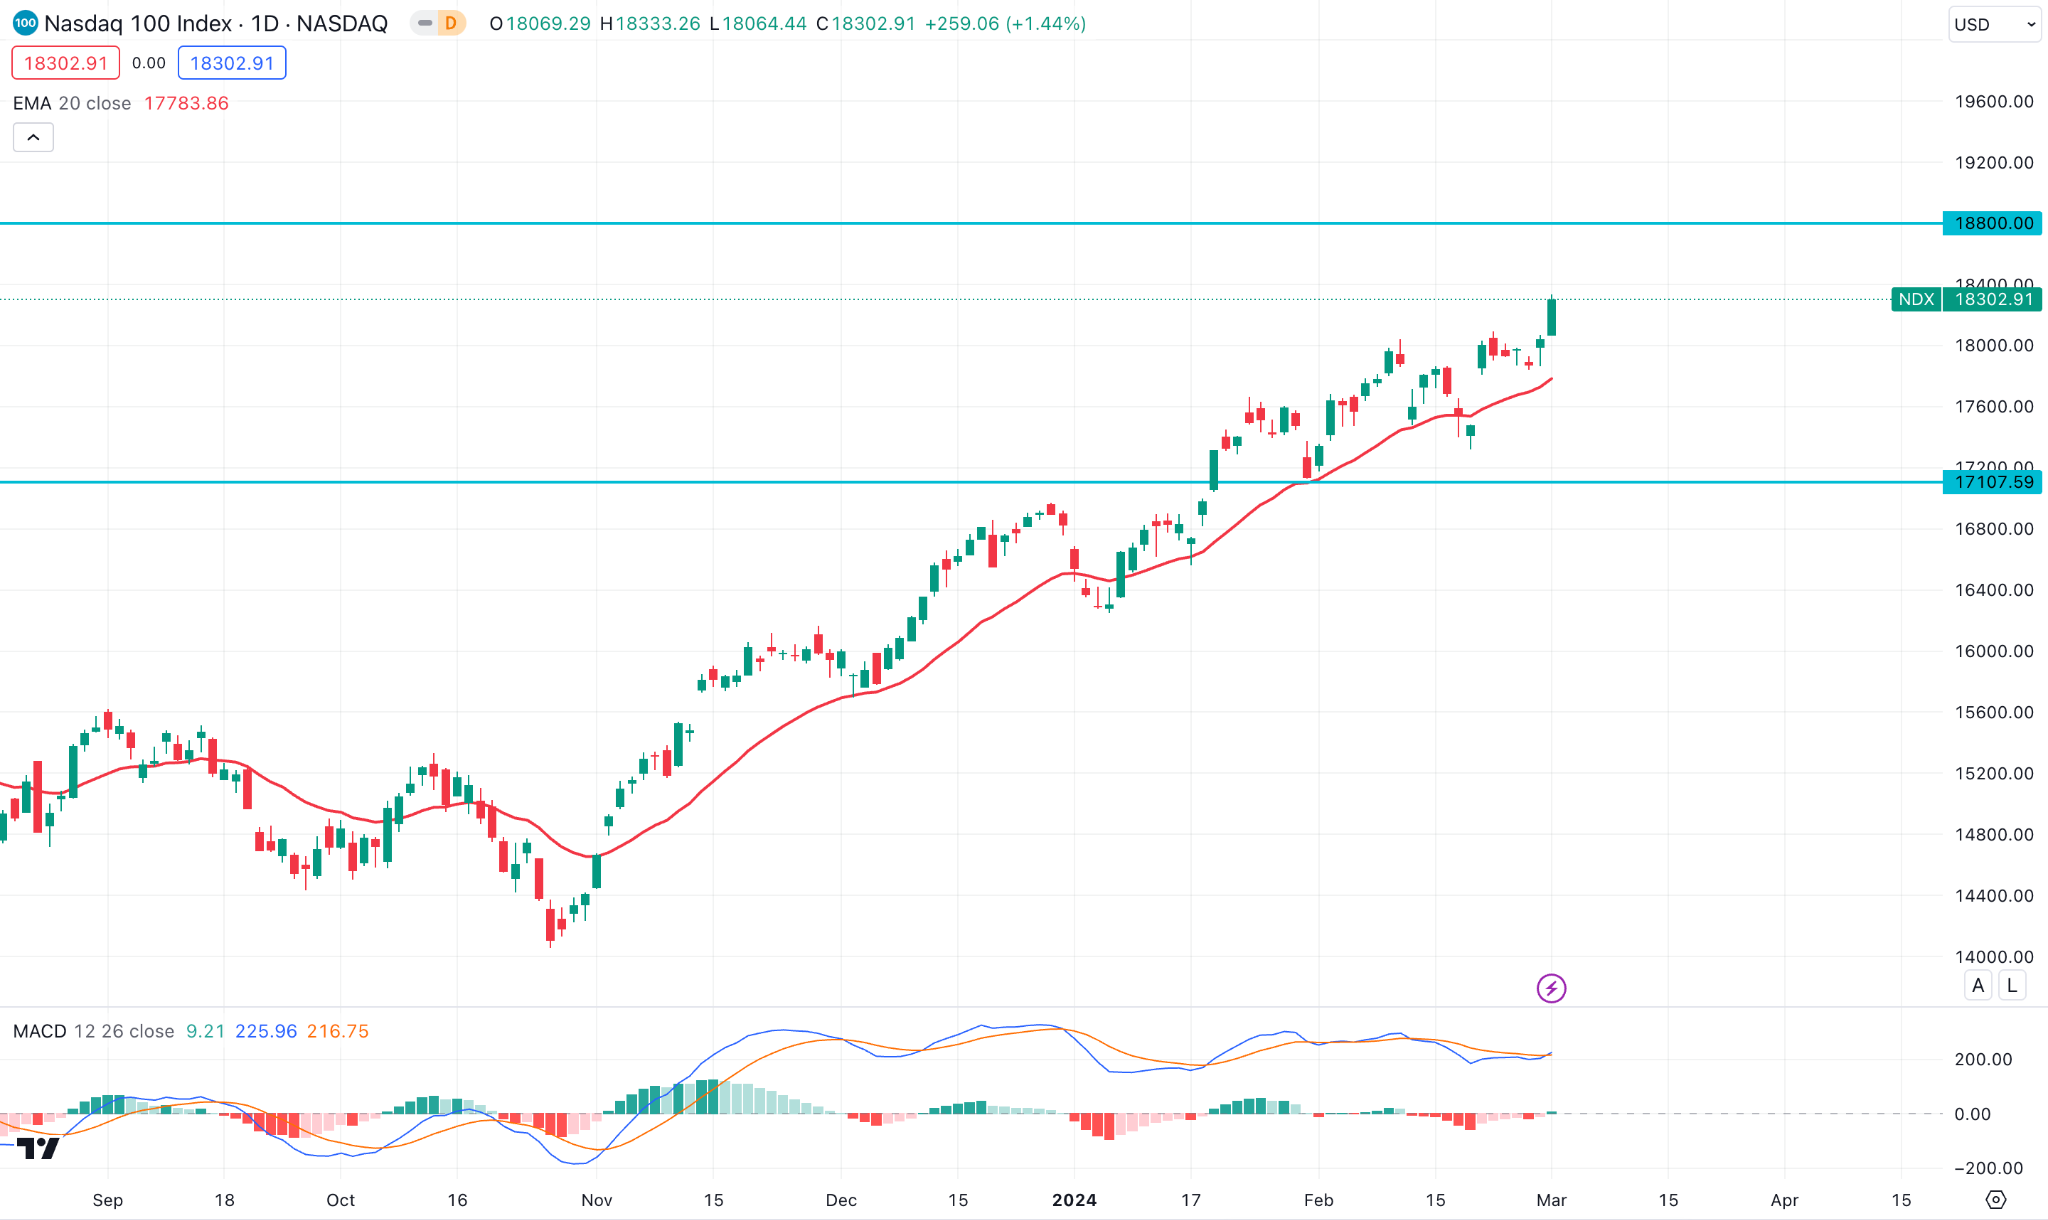
In the weekly chart, a bullish engulfing bar and a continuation showed a trend continuation momentum.
Moreover, the daily price showed a bullish range breakout from the 17837.22 support level, which worked as a confluence of bullish factors.
Based on this outlook, an upward continuation might test the 18800.00 psychological level, which is a crucial Fibonacci Extension level.
However, a downside continuation is possible, which needs a bearish exhaustion before anticipating a trend change.
S&P500 (SPX500)
Fundamental Perspective
A review of January's data reveals that the preferred inflation indicator of the Federal Reserve fell to its lowest level in three years, which bolstered S&P 500 gains and prompted expectations of interest rate cuts at the June meeting.
For this week, the non-farm payrolls report, and the ISM services PMI are the main events to look at. Predictions indicate that February will witness robust job creation of approximately 188,000, although this is a decrease from January's robust report. The Federal Reserve would positively assess any moderation in average earnings.
In addition, the focus will be on the biannual event of Federal Reserve Chair Jerome Powell's two-day testimony before Congress. In response to a hawkish tone from Powell, rate reduction expectations could be scaled back, causing the market to retreat from all-time highs.
Technical Perspective
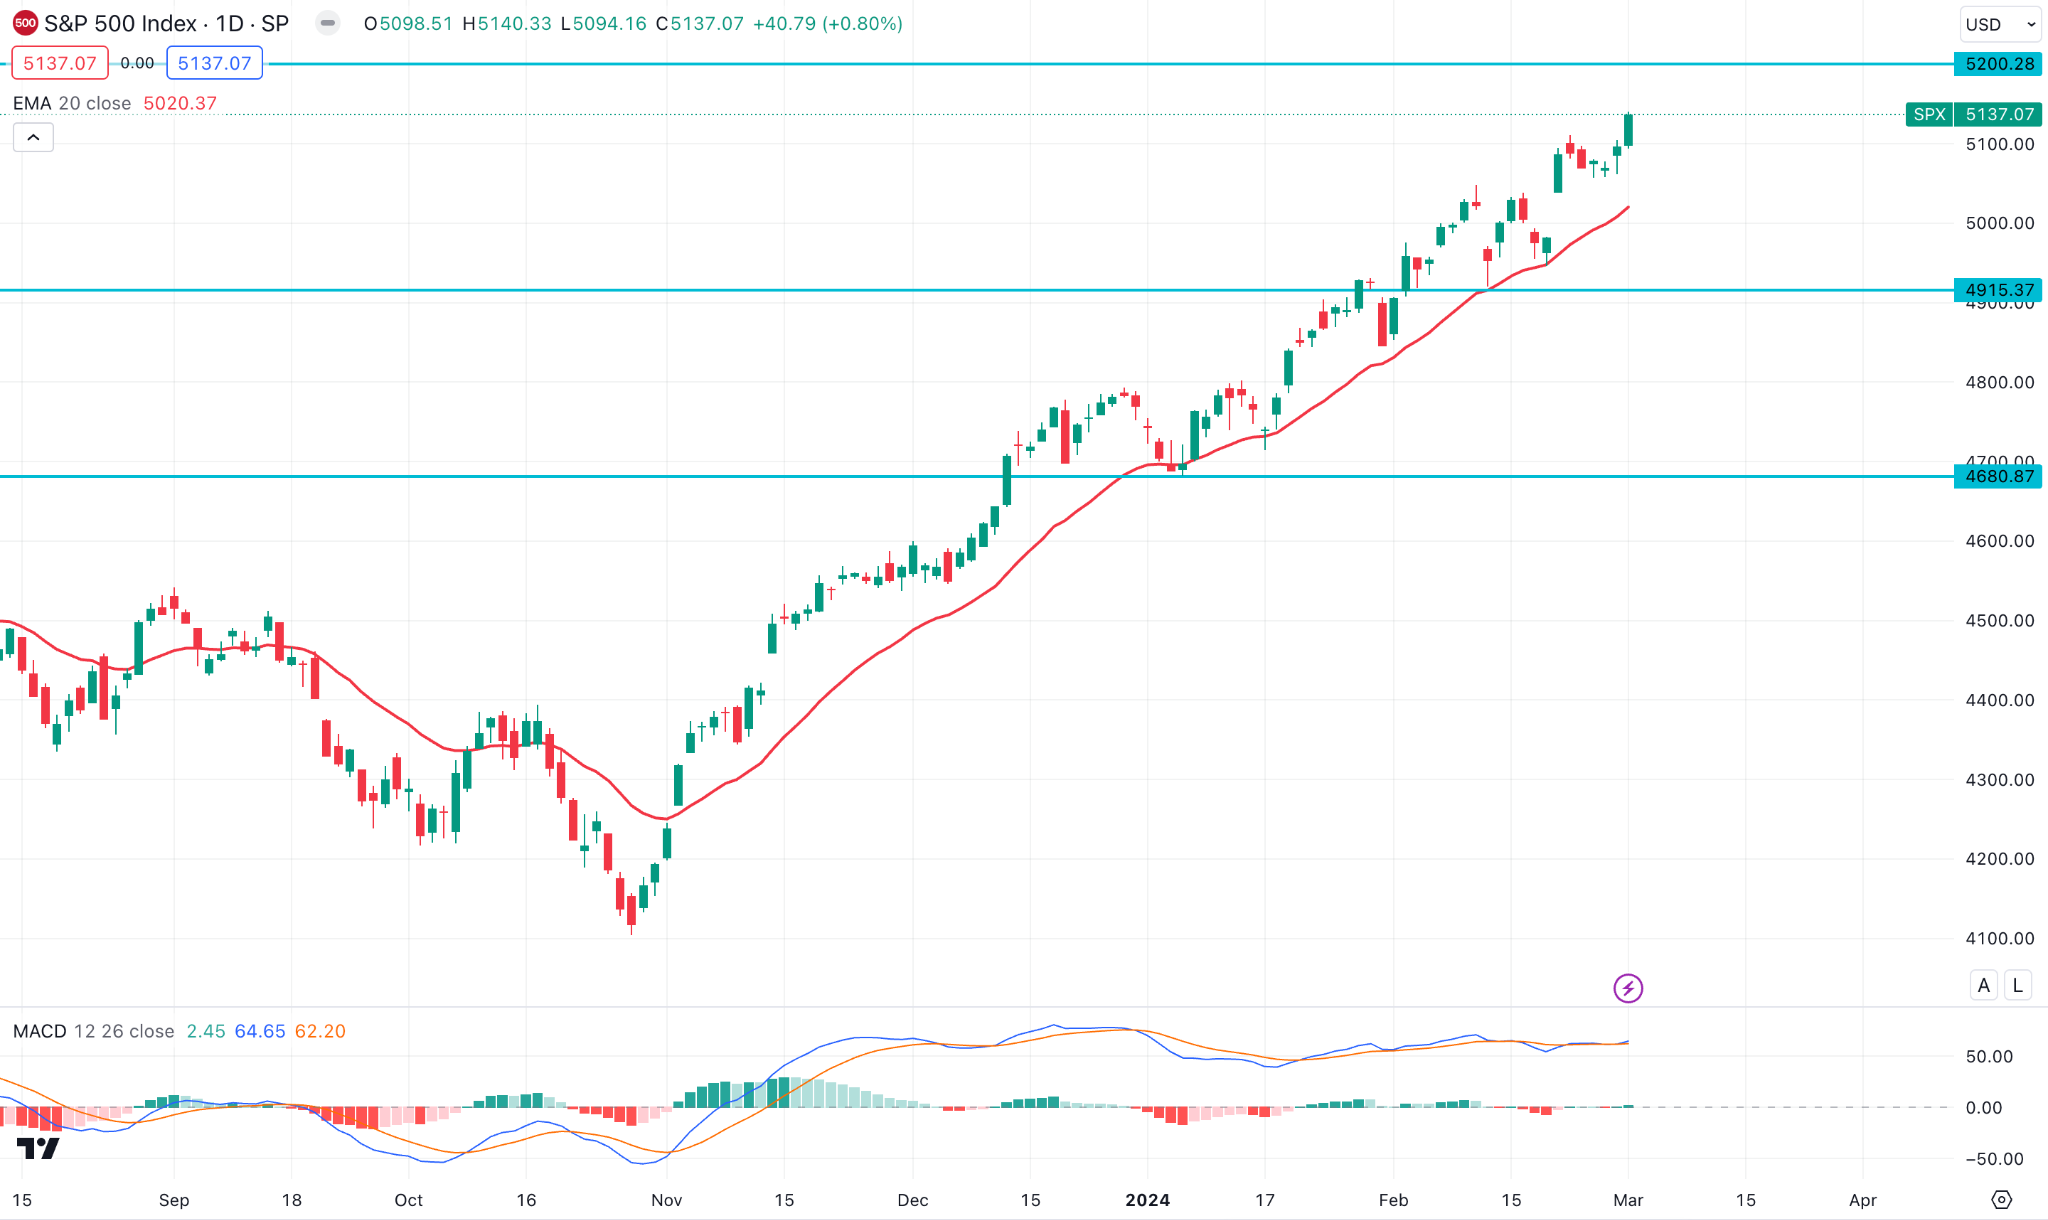
The latest weekly candle showed a bullish continuation signal, which came after a valid engulfing pattern breakout.
In the daily chart, a bullish trend reversal is visible from the 5051.11 bottom, suggesting a minor bullish continuation signal. In that case, the upward pressure is more likely to extend toward the 5200.00 resistance level.
On the other hand, strong bearish exhaustion is needed as the ongoing market trend is impulsive.
Hang Seng Index (HK50)
Fundamental Perspective
Following a two-day decline, Hong Kong shares closed in positive territory on Friday after potential supplementary economic stimulus measures from China during the forthcoming annual session of Parliament.
Factory activity in the world's second-largest economy decreased in February for the fifth consecutive month, according to official data released on Friday. In contrast, a distinct PMI indicator tracked by S&P Global Ratings and Caixin that monitored smaller Chinese manufacturers rose from 50.8 in January to 50.9 in February.
Lawmakers are expected to face greater pressure to strengthen the economy during the 14th National People's Congress (NPC) meeting, which is scheduled to begin in Beijing on March 5th.
Technical Perspective
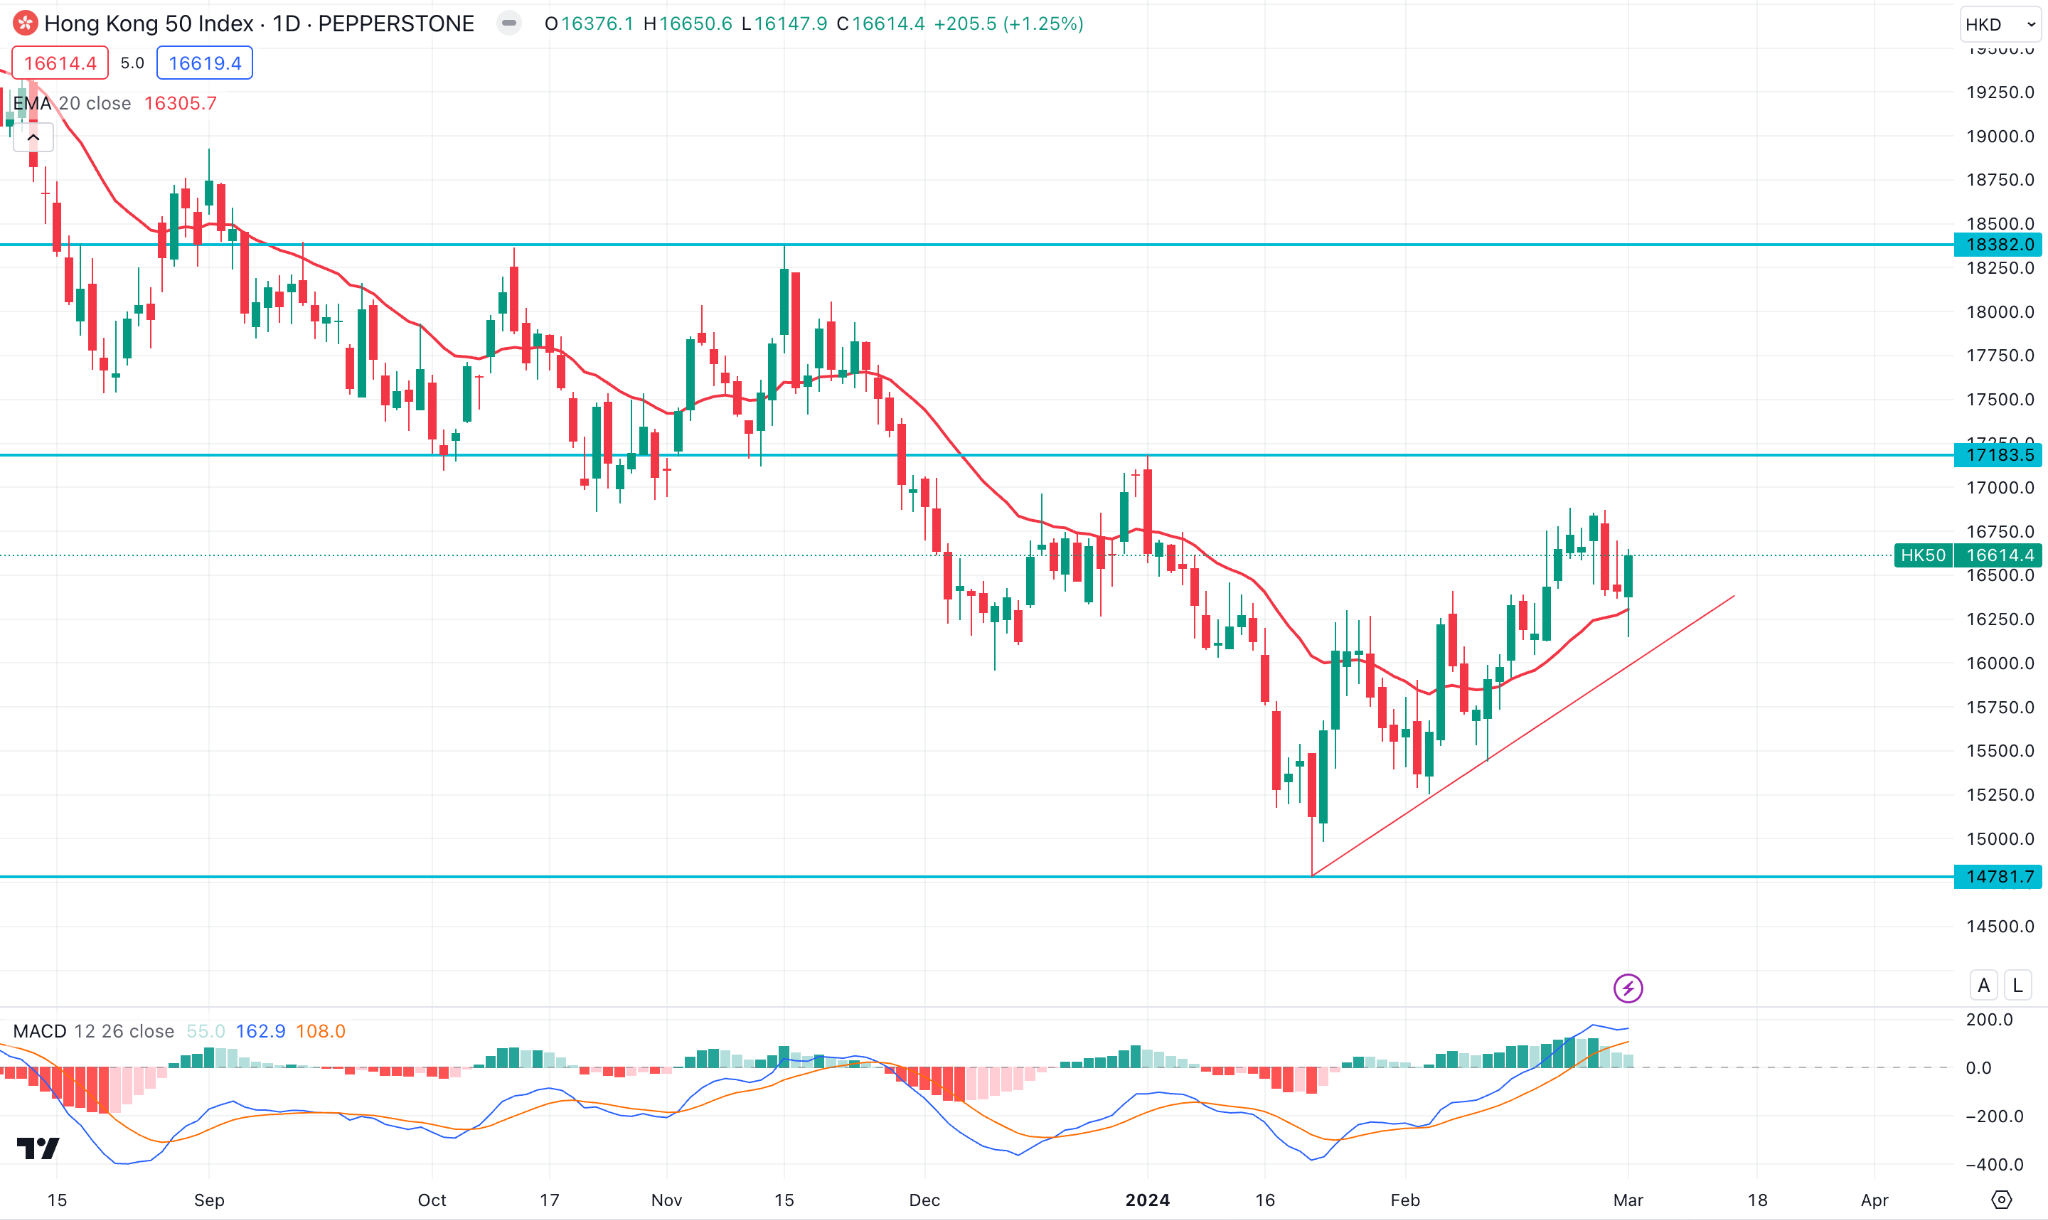
The weekly HK50 price suggests a minor bullish correction as it failed to move above the dynamic 20-week SMA line.
In the daily chart, the bullish correction has more room upward as the most recent dynamic resistance is at the 1718.50 level. Therefore, a bullish continuation with a daily close above this level might take the price towards the 18000.00 psychological level.
On the bearish side, the rising trendline support would be a crucial level, where a bearish trendline breakout could be a potential short opportunity.
Bitcoin (BTCUSD)
Fundamental Perspective
Bitcoin (BTC) has experienced a substantial percentage increase of 43% over the last thirty days and 19% over the previous week. Consequently, many Bitcoin addresses have entered the profitable zone for the first time in over two years, while 97% of all Bitcoin addresses are now profitable.
According to on-chain metrics from IntoTheBlock, 50.62 million Bitcoin addresses are profitable at the current price level. This number signifies more than 97% of the total addresses of wallets. Significantly, the last time such extensive profitability was witnessed was in November 2021, when Bitcoin was valued at approximately $69,000, near its peak value.
The notable price increase can be ascribed to increased mainstream acceptance within conventional investment communities, primarily propelled by the advent of Spot Bitcoin ETFs. This phenomenon has prompted investors to adopt a renewed holding mentality.
Technical Perspective
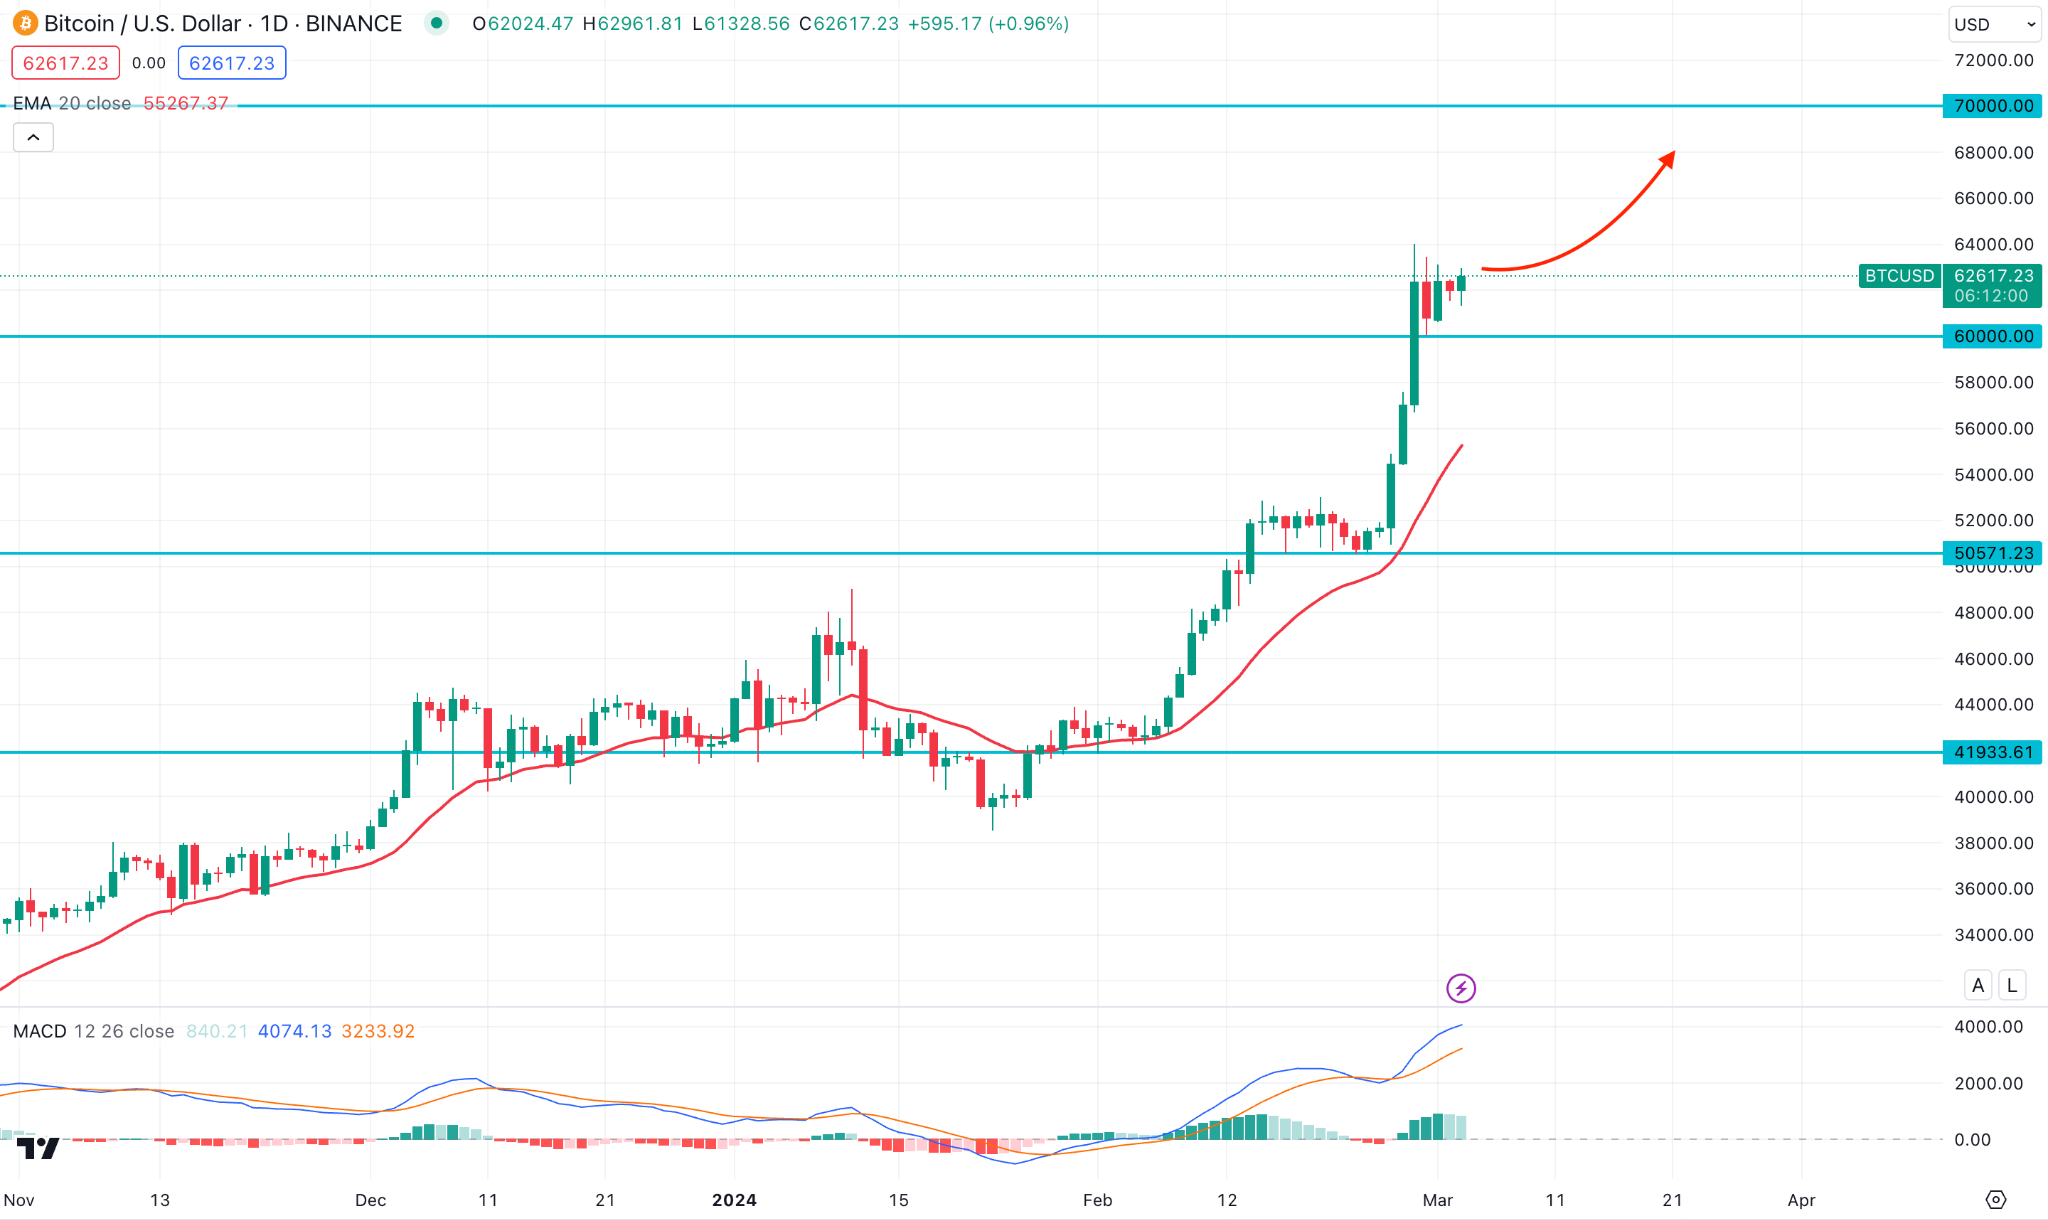
The last weekly candle suggests the highest 1-week gain since 2022, which could be a remarkable achievement for BTCUSD bulls.
In the daily chart, the current price trades within a bullish pennant pattern, where a breakout and a daily candle above the 64000.00 level could increase the possibility of reaching the 70000.00 level.
On the bearish side, a sharp recovery with a bearish daily close below the 60000.00 level might lower the price toward the 52000.00 area.
Ethereum (ETHUSD)
Fundamental Perspective
Recently, Vitalik Buterin, one of the co-founders of Ethereum, drew attention to the potential economic ramifications that could arise from the expenses linked to "blobs" on the Ethereum network. Blobs, a functionality introduced by Ethereum Improvement Proposal (EIP) 4844, are data bundles that can be affixed to transactions and are approximately 125 kilobytes in size.
Howevererin conducted a comparison between the present costs of data transmission on Ethereum and the forecasts put forth by Polymarket, an online prediction marketplace. Currently, 125 kB of data transmission on Ethereum costs approximately 0.06 ETH.
On the contrary, Polymarket estimates that clumps will cost around 0.001 ETH. The considerable disparity suggests that deploying EIP-4844 could substantially diminish the costs associated with data storage on the Ethereum network.
Technical Perspective
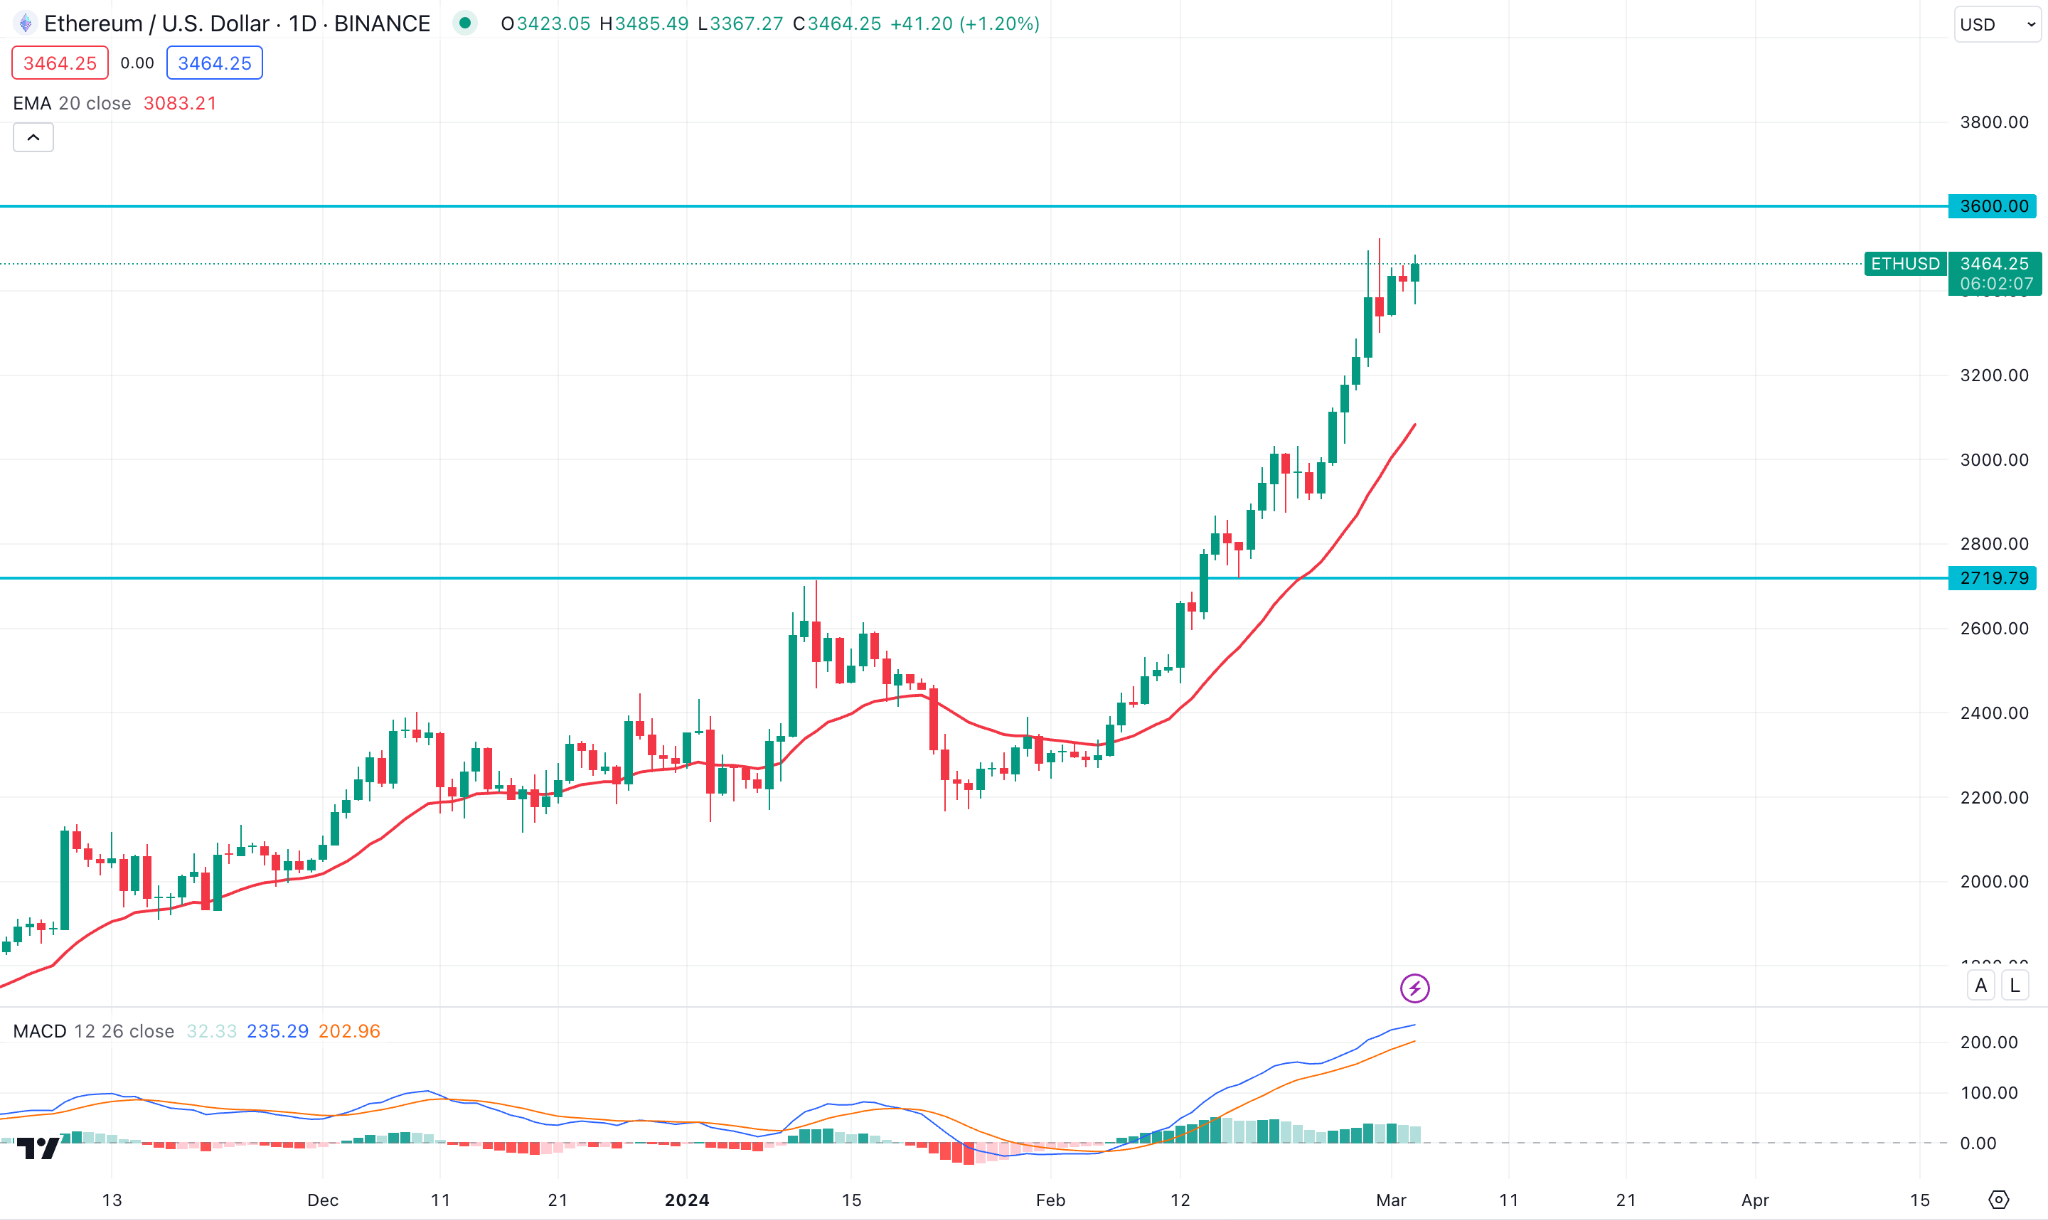
The ongoing bullish momentum is solid in the ETHUSD price, where the current price hovers above the 3000.00 level.
In that case, a successful breakout with a daily candle above the 35000.00 level could be a solid opportunity to test the 4000.00 psychological level.
Tesla Stock (TSLA)
Fundamental Perspective
Tesla stock has dropped around 16% in 2024 so far. Analysts expect Tesla's earnings to decline in 2024 compared to 2023. This is due to factors like lower vehicle volume growth and the company focusing on launching its next-generation vehicle.
While Tesla CEO Elon Musk has teased the new Roadster and other projects, analysts remain cautious due to the lack of specifics on profitability and future plans. Some analysts have even removed Tesla from their "best idea" lists. Overall, the outlook for Tesla stock in 2024 is uncertain.
Technical Perspective
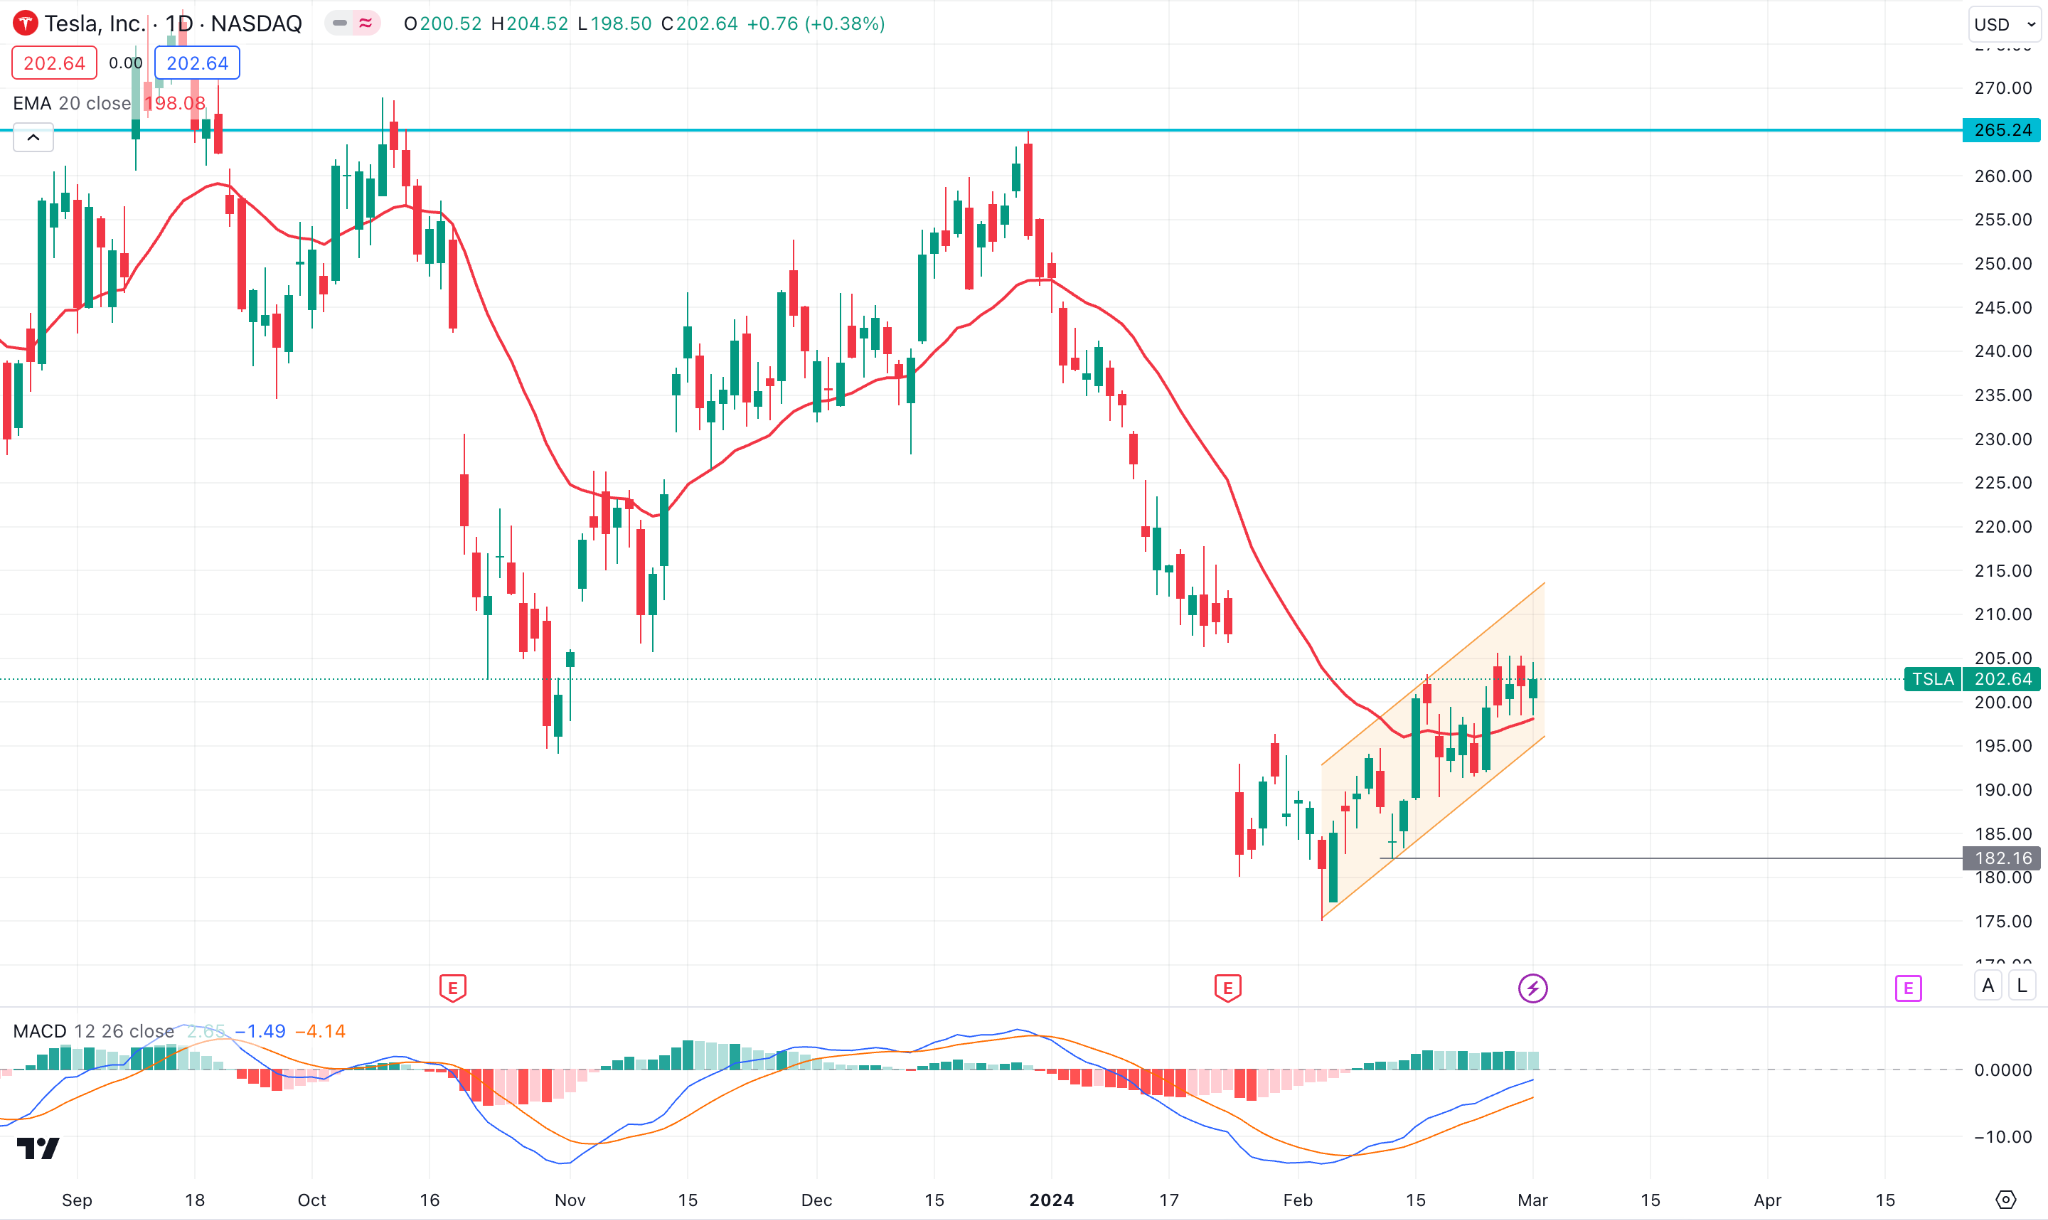
Tesla Stock (TSLA) showed a bullish range extension within the channel formation in the daily chart.
In that case, investors should monitor how the TSLA stock price reacts to the 210.00 resistance level. The dynamic 20 day EMA is supportive to bulls, while the MACD Histogram is bullish.
However, a bearish reversal is possible, which needs a decent recovery with a valid channel breakout.
Gold (XAUUSD)
Fundamental Perspective
In the previous week, there was substantial bullish pressure on Gold, surpassing technical milestones. A modest decline in U.S. Treasury yields that left investors pondering their implications for the monetary policy posture of the Federal Reserve contributed to the upward momentum in bullion prices.
The core PCE deflator for January recorded values aligned with consensus estimates, increasing by 0.4% month-on-month and 2.8% year-on-year. In light of recent inflation concerns prompted by CPI and PPI data, Wall Street had been preparing for a possible increase. However, investors were relieved when the FOMC's preferred price indicator met expectations.
Ahead of time, speculators ought to diligently observe February's forthcoming U.S. employment data to gain valuable insights regarding the market trajectory. On the contrary, if nonfarm payroll figures fail to meet expectations and indicate an escalation of economic difficulties, it is probable that interest rate forecasts will adopt a more lenient position, thereby applying a downward force on yields.
Technical Perspective
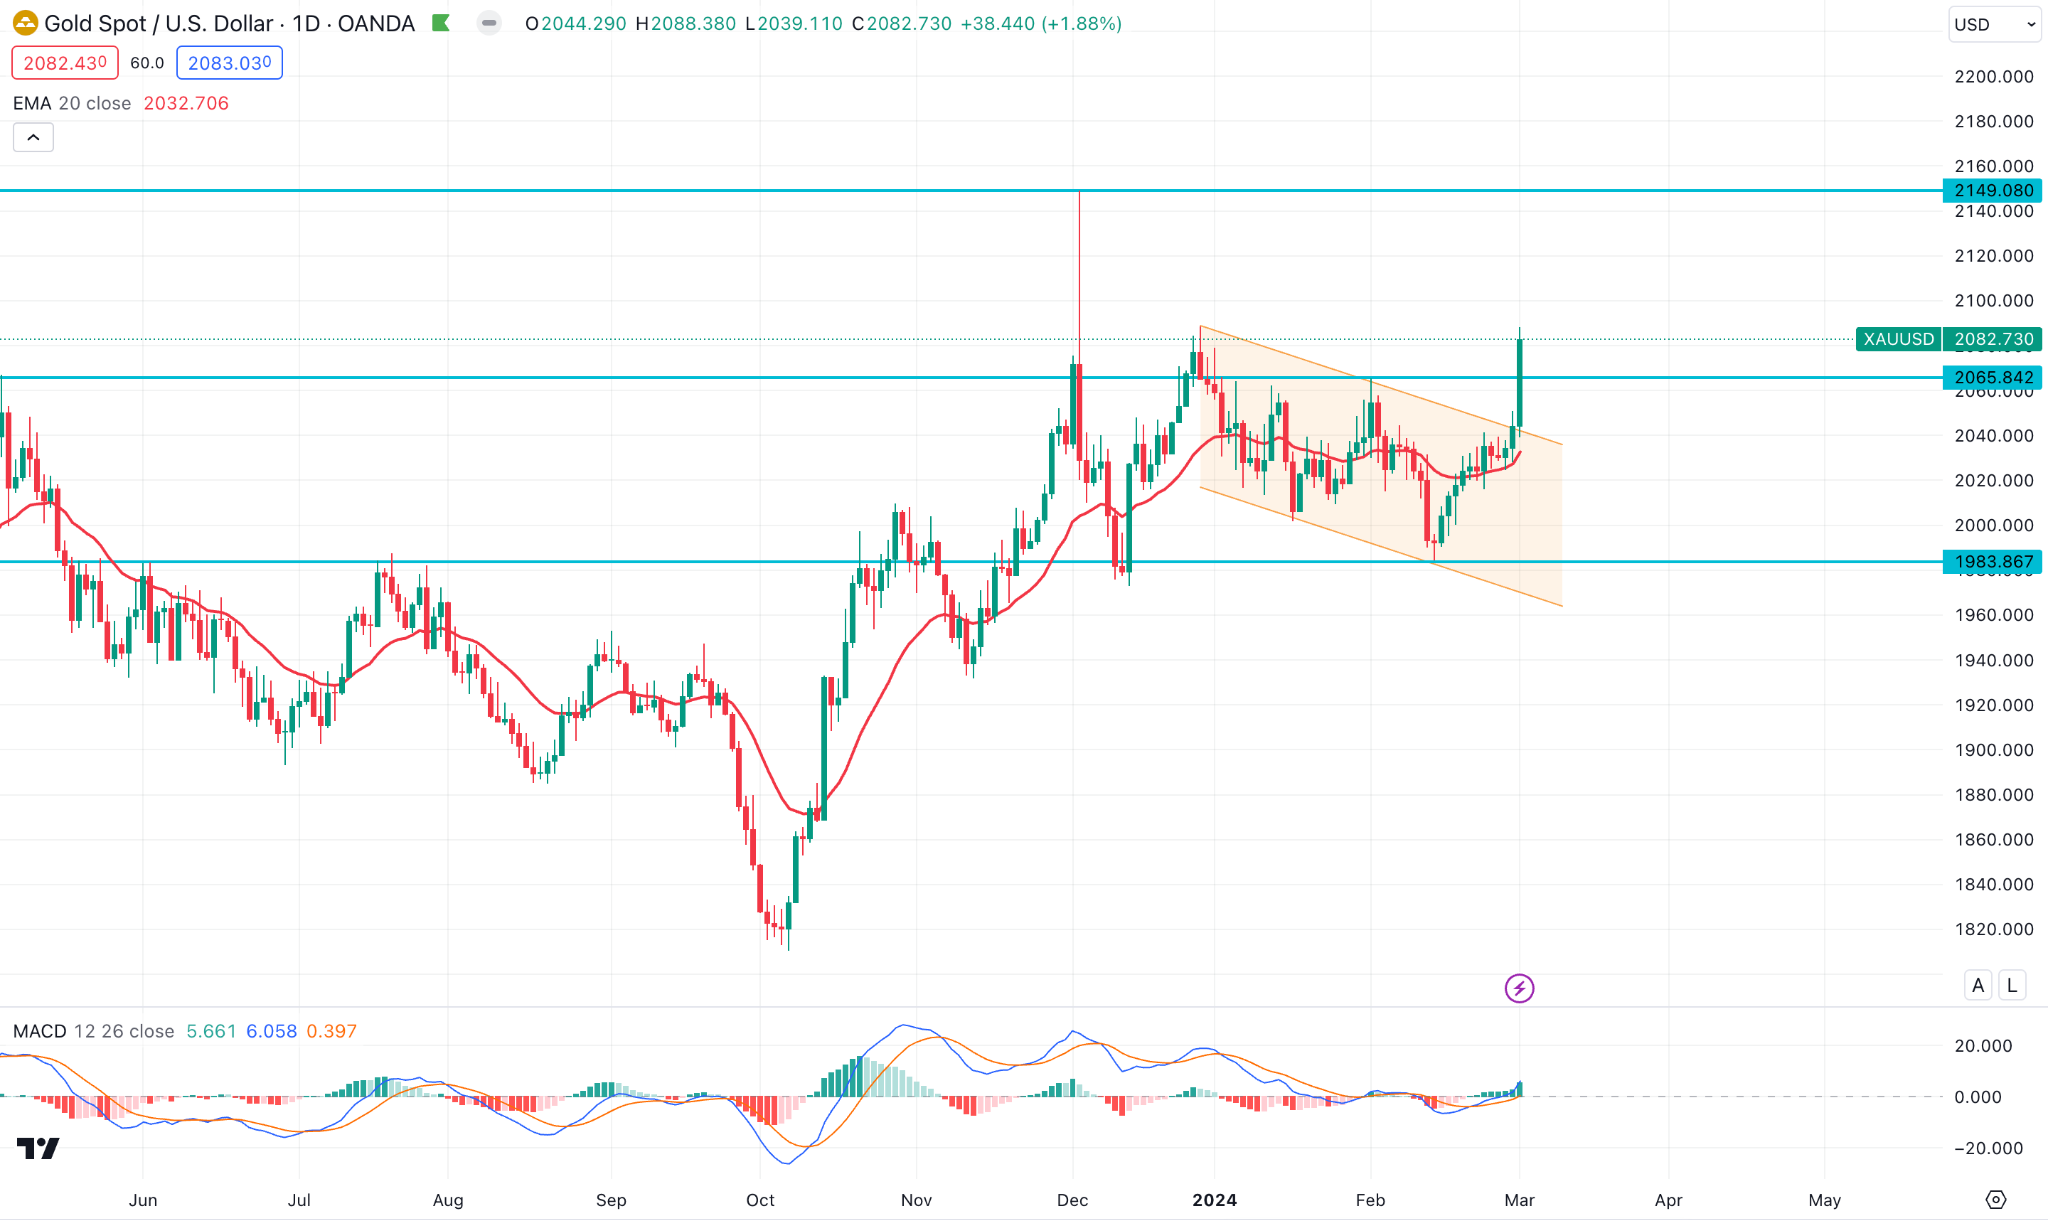
The XAUUSD daily price showed a considerable bullish continuation after the channel breakout. It is a sign of a stable bullish market, where further upward pressure is potent.
In that case, investors should closely monitor the price. A minor downside correction and a bullish rejection from intraday prices could be a valid long opportunity.
WTI Crude Oil (USOUSD)
Fundamental Perspective
The crude oil prices experienced a moderate increase at the end of the week, supported by the depreciation of the US dollar. In addition, the prognosis for crude was bolstered by anticipation that OPEC+ would extend its roughly 2 million barrels per day (bpd) crude production cuts beyond March.
Furthermore, the persistent assaults carried out by Houthi rebels against commercial vessels in the Red Sea caused significant disruptions to the supplies of crude oil from the Middle East. This, in turn, bolstered the physical oil markets in the United States as international purchasers resorted to American crude to circumvent the shipping complications.
In the US, the ISM manufacturing index for February declined by 1.3 points to 47.8, which was below the consensus estimate of an increase to 49.5. In addition, construction expenditures decreased unexpectedly by 0.2% month-over-month in January, the steepest decline in fifteen months, contrary to expectations of a 0.2% increase. In addition, the February U.S. consumer sentiment index from the University of Michigan was revised by 2.7 points to 76.9, falling short of expectations for a plateau at 79.6.
Technical Perspective
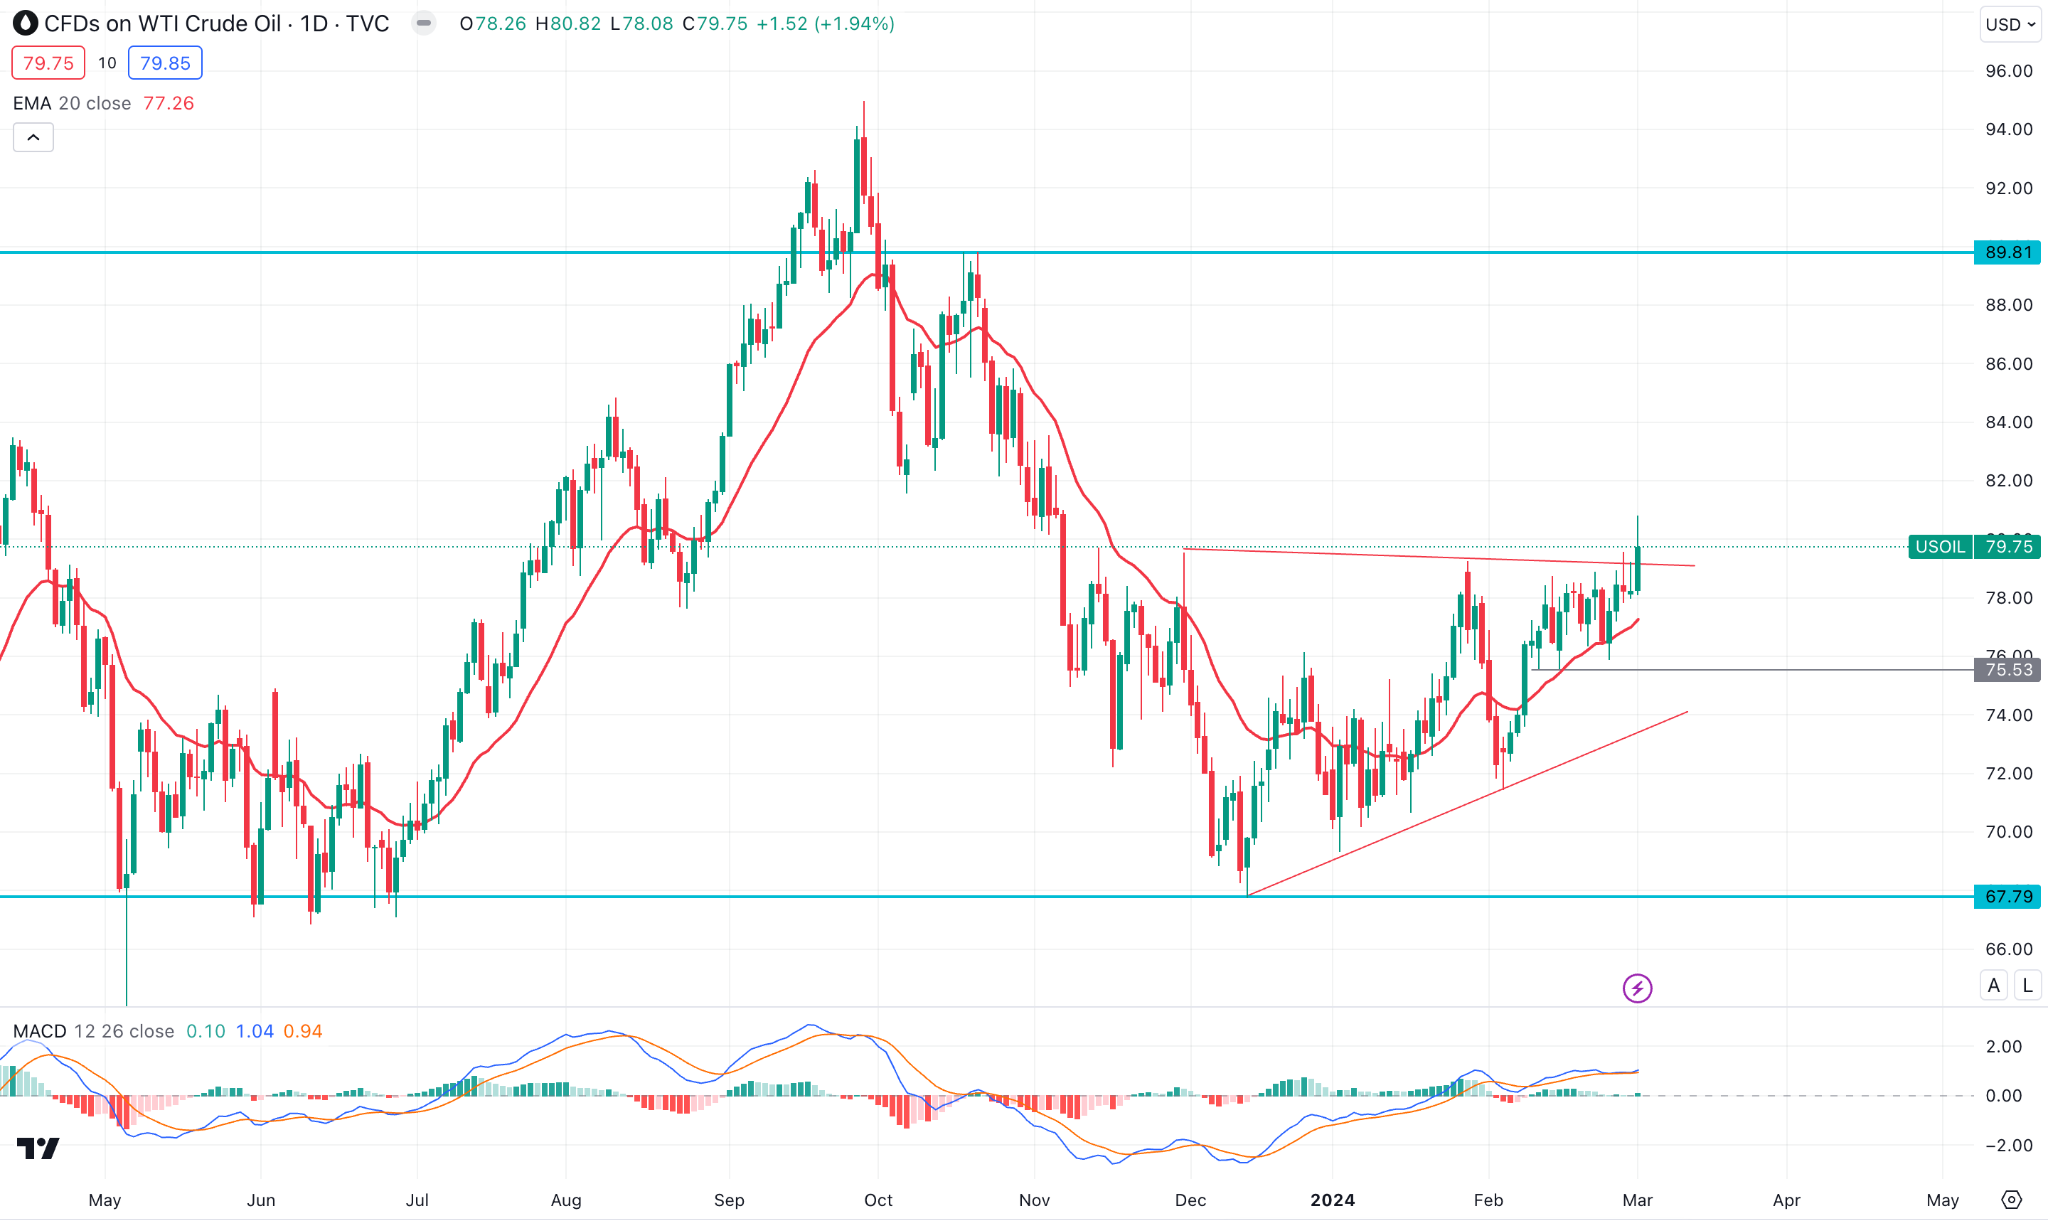
The WTI daily price suggests a bullish trendline breakout, supported by the dynamic 20-day EMA support. Moreover, the MACD Histogram remained sideways, while the 100-day SMA is below the current price.
Based on this outlook, an upward continuation is potent, aiming for the 88.00 resistance level. However, a failure to hold the price above the 75.53 level could be an alarming sign to bulls, which might lower the price towards the 70.00 level.


