


EURUSD
Fundamental Perspective
Last week, the United States Dollar surpassed the weekly high after different economic data declared a stable U.S. economy with some minor weaknesses. These all indicate that the Fed can minimize the rate cut count in the current year or keep interest rates higher for an extended period.
The manufacturing data of the U.S. on revealed a 0.8% rebound for last month after a 1.1% decline in the previous month. However, in a research note, Citi analysts said the February rebound partly republish the downward revisions to January output and alternative of a "weather-related drag in January in non-durable goods manufacturing sectors."
A survey data on Friday revealed that inflation expectations and consumer sentiment in the United States slightly changed in March. The preliminary consumer sentiment index reading by the University of Michigan came to 76.5, whereas the final reading in February was 76.9.
The survey's reading, a measure that the Fed tracked, remained unchanged at 3.0% in March for the one-year inflation expectation. For the straight 4th month, the five-year inflation outlook by the survey remained steady.
The FOMC meeting will be held next week, and investors are not expecting any further interest rate move; better than expected, US CPI and PPI data this current week let investors rein in future cut bets.
Technical Perspective
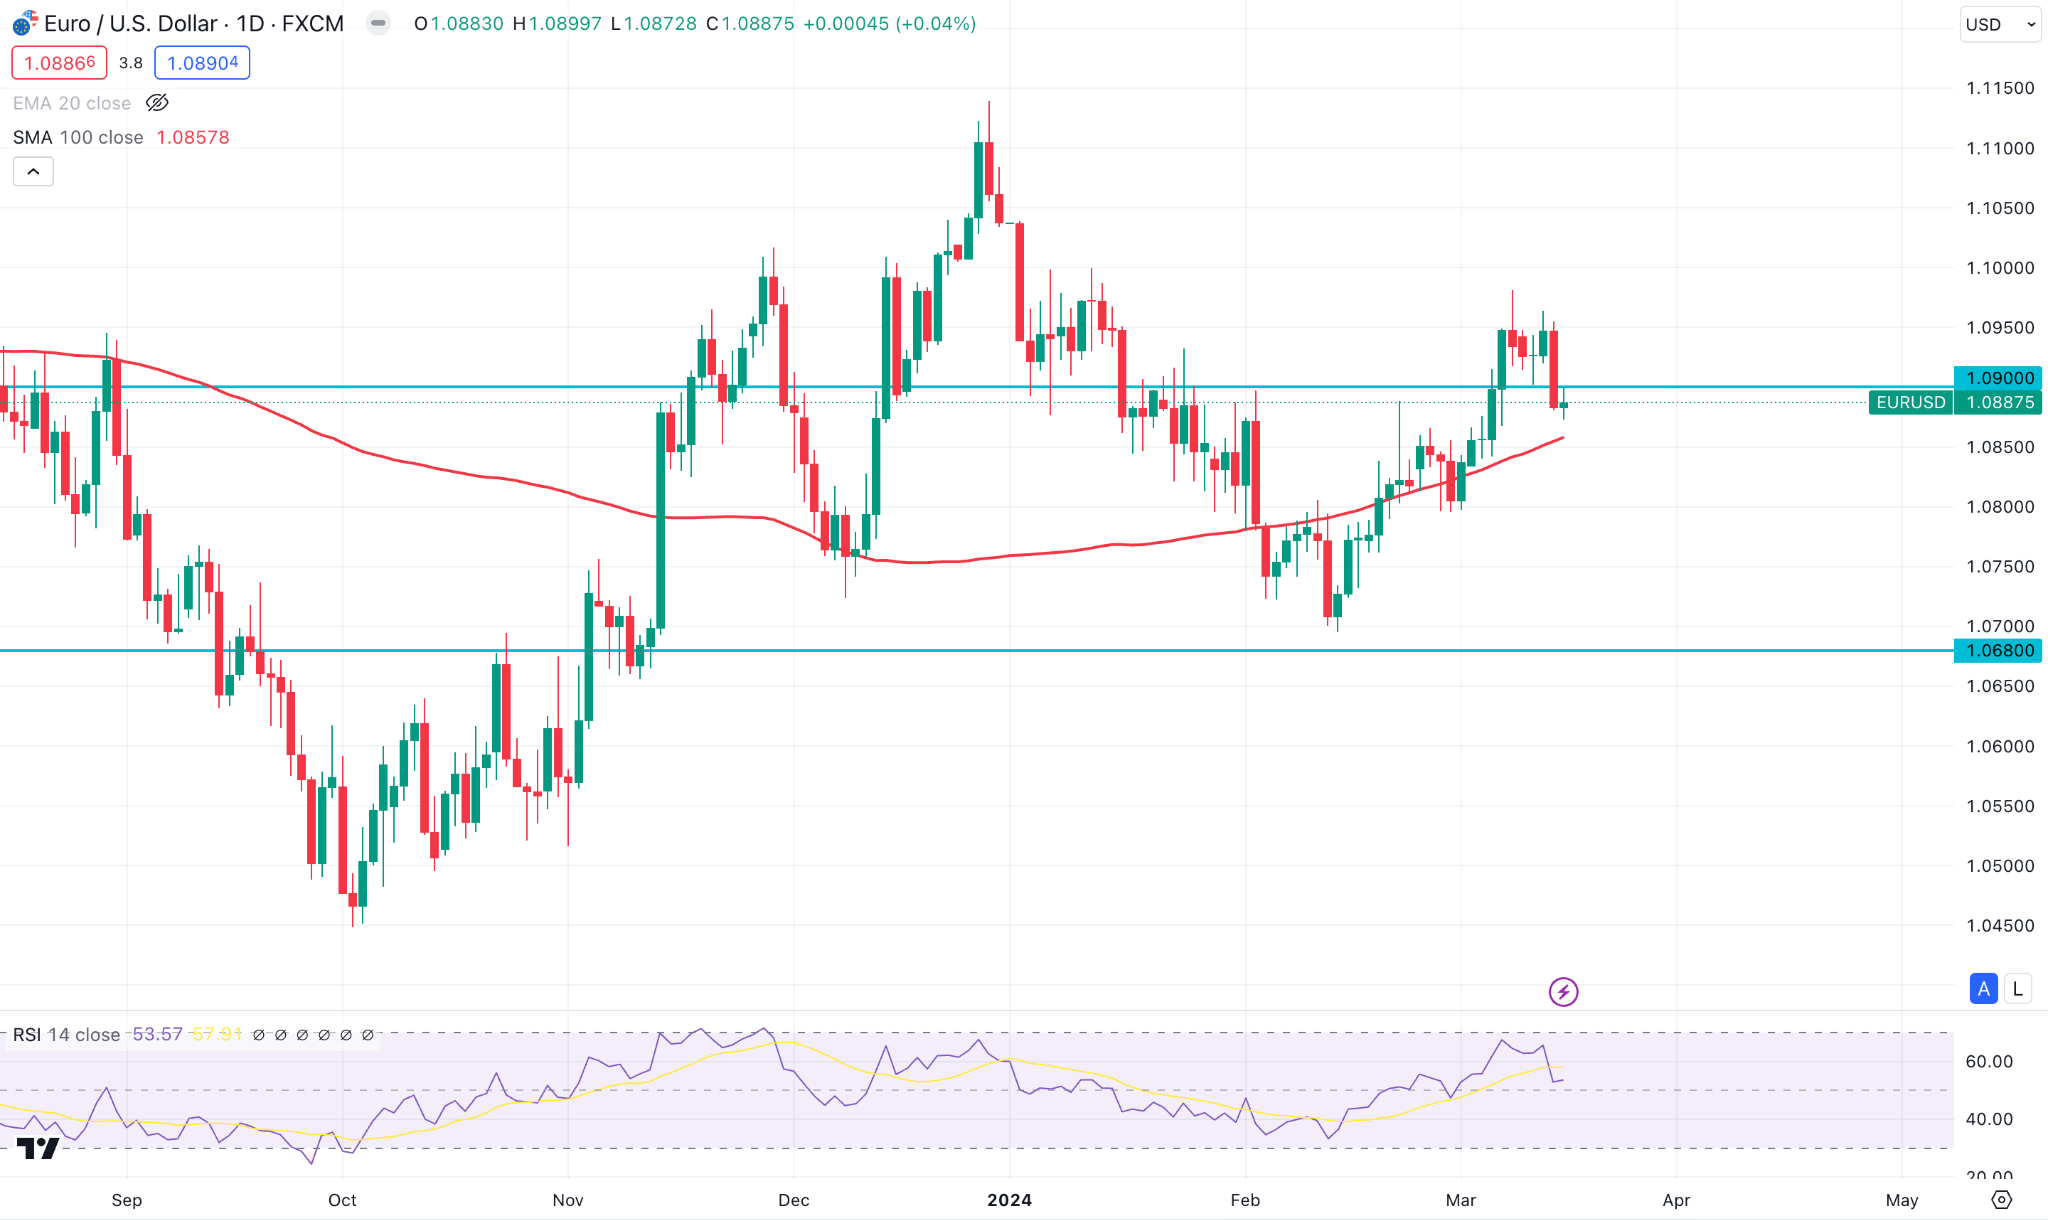
The weekly EUR/USD chart shows a fresh uptrend continuation, whereas the latest candle closed red. Meanwhile, the daily chart remains above the 100 SMA line, indicating that the price can continue to increase.
On the daily chart, the price remained on a downtrend from the last week of December 2023 to mid-February 2024. Later on, it reached a fresh high of 1.0980, near the 0.618 Fibonacci Retracement level of the previous downtrend.
Based on this outlook, the price is more likely to continue to drop at the nearest support level near 1.08 or even near 1.0680. On the other hand, if the price breaks the recent high of 1.098 l, it can reach the next resistance level of 1.115 soon.
GBPJPY
Fundamental Perspective
In the latest data, the UK ILO unemployment rate increased to 3.9%, slightly higher than 3.8% in December, as the Office for National Statistics (ONS) published data on Tuesday.
In January, Average Earnings excluding Bonus, a wage inflation measure, increased 6.1% YoY compared to a 6.2% rise in December, whereas a 6.2% raise was expected. Since October 2022, the UK pay growth has been at its slowest, which has influenced the BoE's rate cut bets.
Andrew Bailey, BoE Governor, delivered a diluted message on Tuesday that couldn't support Great Britain's Pound. He said price-wage spiral worries were easing, and inflation expectations seemed to be under control. According to Reuters, he was uncertain about the jobless rate due to geopolitical risks and labor market data issues.
On the other hand, Shunichi Suzuki, Finance Minister of Japan, said that the government will mobilize all policy steps to carry on the solid wage hikes trend of this year, and the economy will no longer remain deflated. However, investors hope the BoJ won't depart from its extended policy stance expansionary as a full-proof plan for the wage-price spiral remains nonexistent.
Market participants are closely focused on BoJ's press conference when the central bank changes its negative interest rates and YCC (Yield Curve Control). Kazuo Ueda, BoJ governor, said earlier that the policymakers will debate whether the outlook is bright enough to phase out the massive monetary stimulus.
Technical Perspective
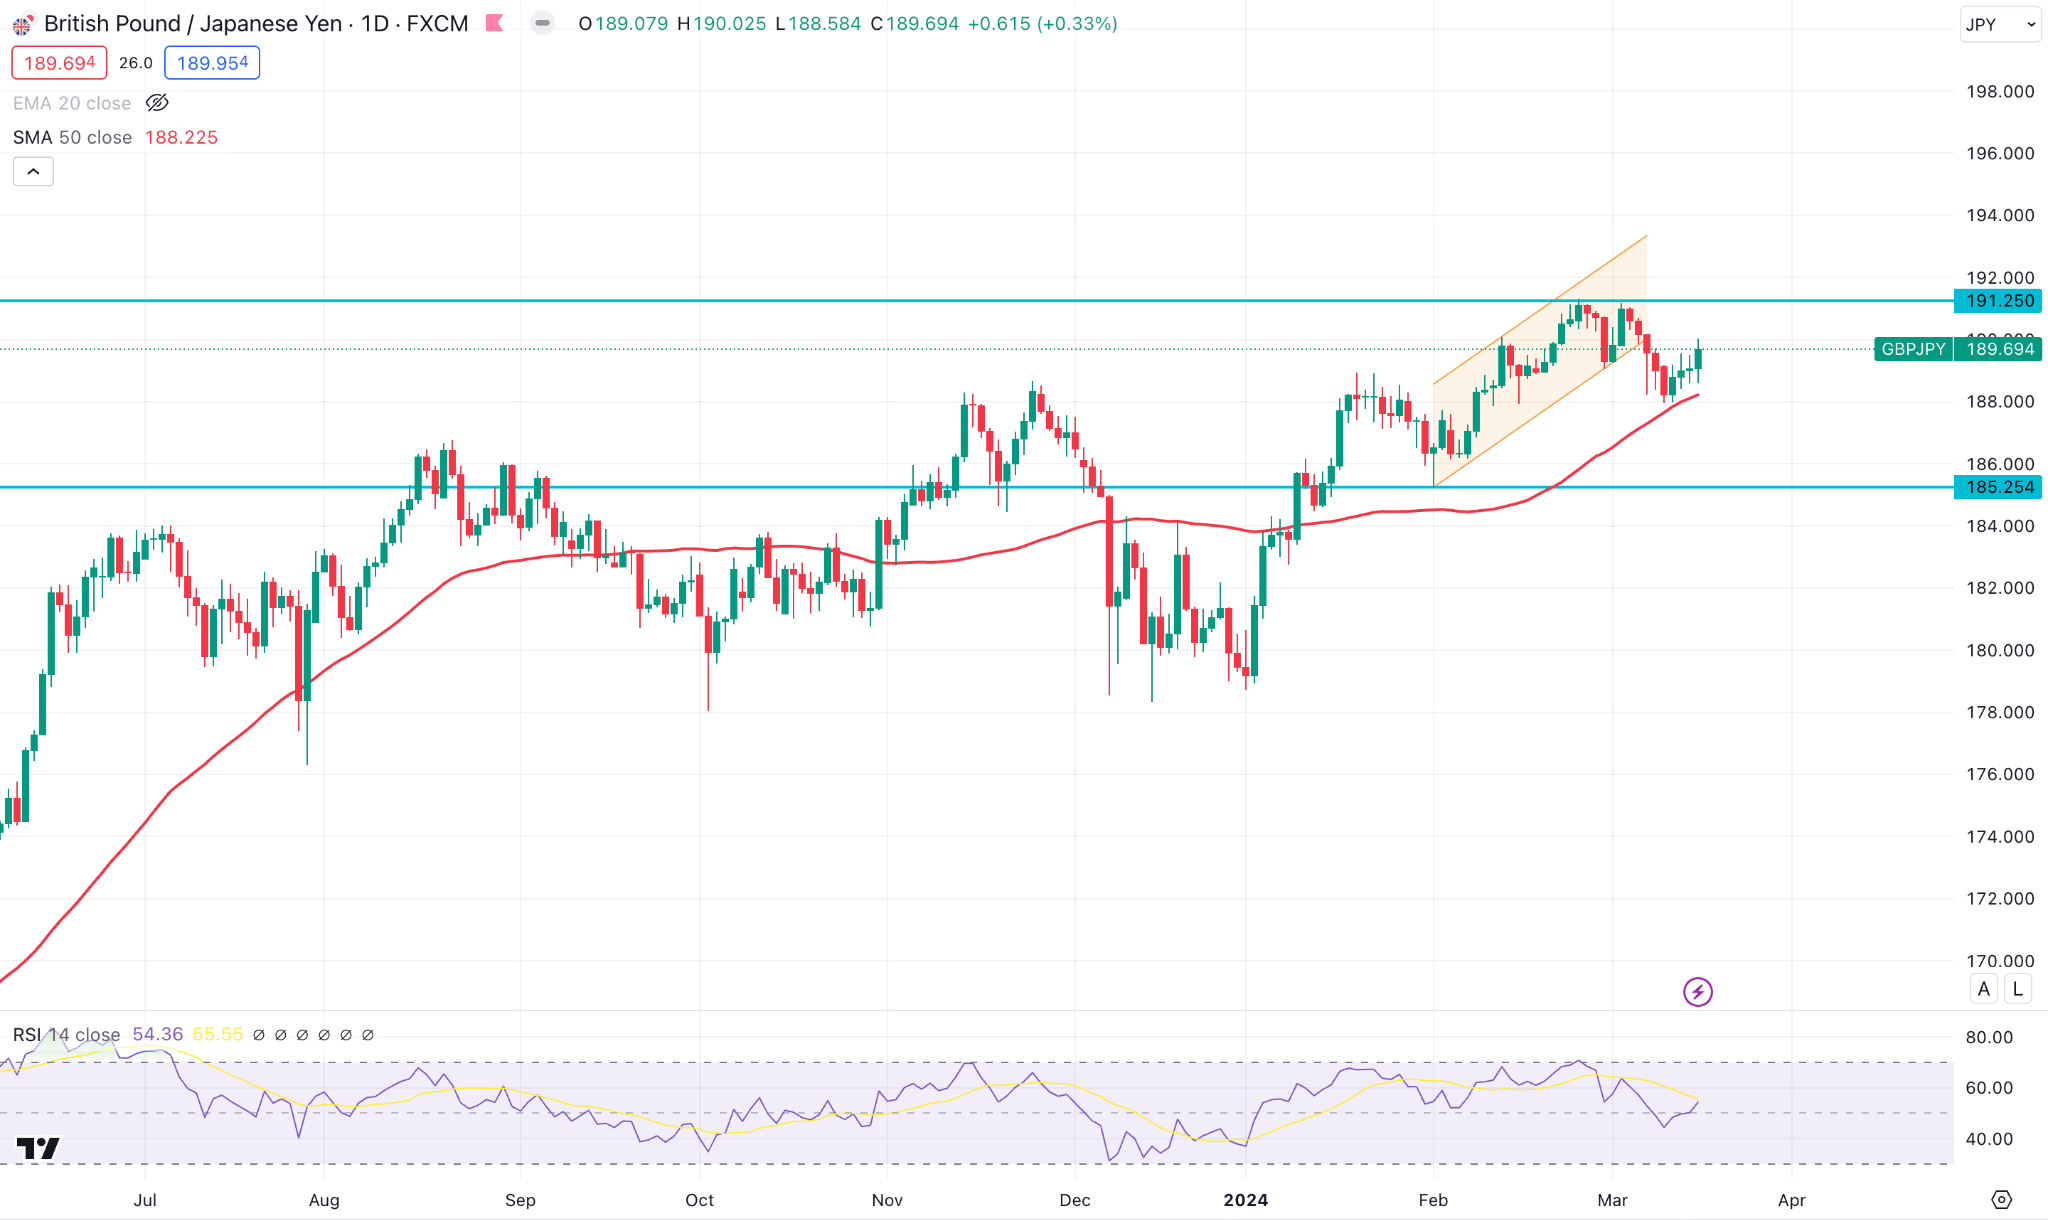
On the weekly chart, GBPJPY remains on a solid bullish trend. At the same time, the RSI index declares buyers' domination on the currency pair.
Meanwhile, the daily chart shows that the price just crossed over the SMA 50 line, declaring bullish pressure on the asset. This indicates that the price can reach the first resistance near 191.25, and a breakout can trigger the price to reach a high in July 2015 near 195.
On the other hand, rejection from this level can open the door to the last support level near 179.00, followed by the previous support near 171.00 level.
Nasdaq 100 (NAS100)
Fundamental Perspective
While technology stocks suffered through investors' anxiety, a downfall occurred on Friday in the major US stock indexes. Remarkable tech giants, including Microsoft and Apple, witnessed a decline of over 1%, and Alphabet and Amazon saw a downfall. However, despite the recent volatility in stock valuation, Nvidia has gained over 1%.
The upcoming policy meeting of the Fed on March 19 has triggered speculation considering the future interest rate path. While the Fed suggests an unchanged future rate, the focus is also on market stability and long-term interest rate perspectives. The ongoing discussion on whether sufficient moderated inflation could affect these decisions.
Meanwhile, the survey about consumer sentiment data by the University of Michigan did not meet expectations, declaring durable cautions on consumer outlook.
Technical Perspective
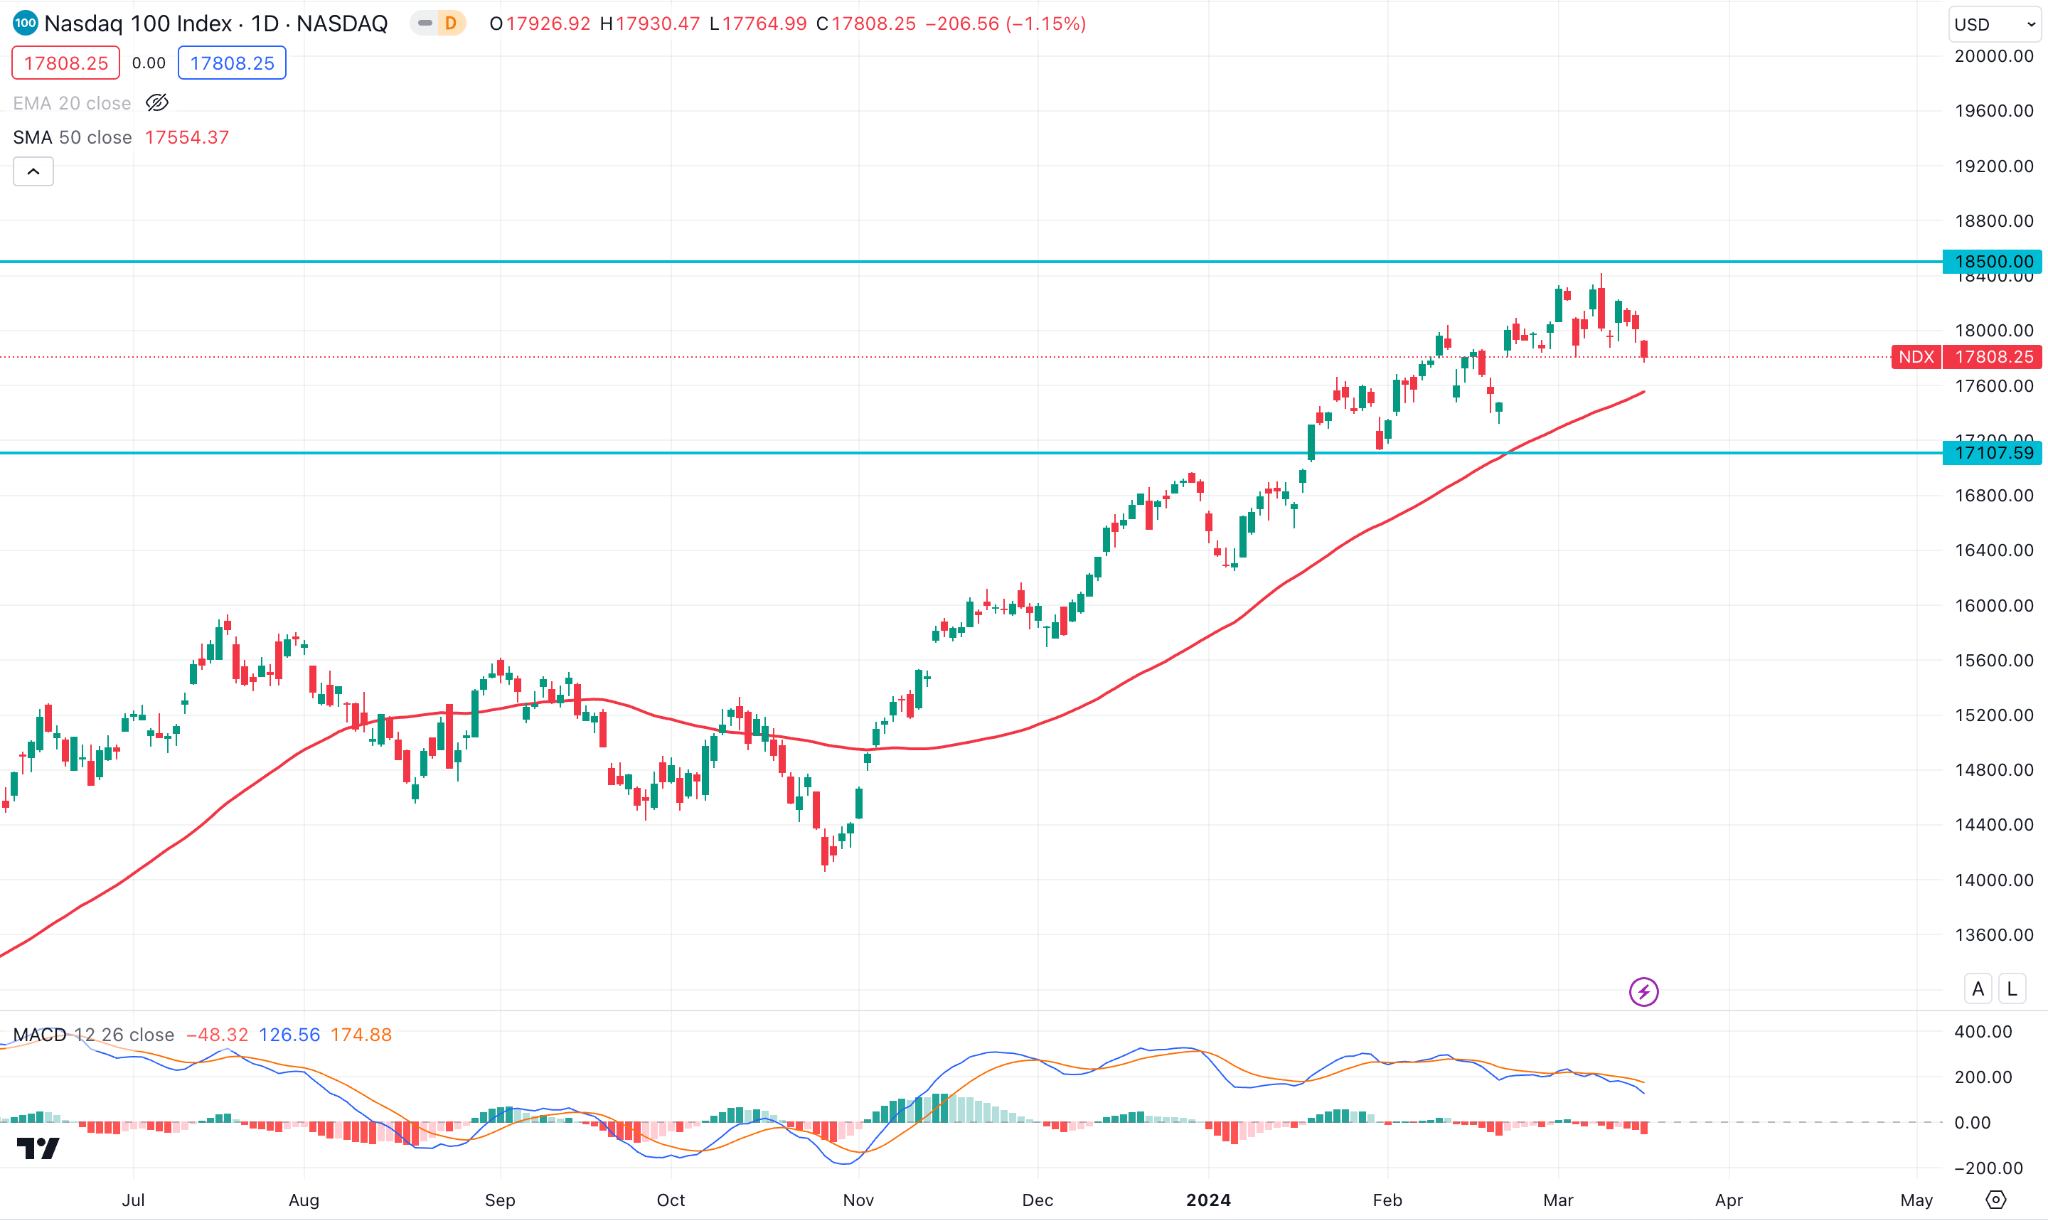
The weekly chart of the Nasdaq 100 shows a slight decline after reaching a peak near 18400 last week while remaining on an uptrend.
The daily chart shows sellers take control after a little consolidation, although it remains above the SMA 50 line. Meanwhile, the MACD window confirms sellers' domination at the current price. It can reach the previous low near 17350.00, followed by the support level near 16900.00 and 15800.00.
On the other hand, a significant bull pressure can take the price back to the recent resistance level near 18500.00 and above.
S&P500 (SPX500)
Fundamental Perspective
The U.S. stocks finished down on Friday, as the information-technology sector of the S&P 500 index posted a sharp weekly loss.
The chief market strategist at Ameriprise, Anthony Saglimbene, said in a phone interview Friday that, in recent months, the mega-cap companies known as “Big Tech” shares increase pushes the market.
On Friday, data shows the S&P 500 declined and finished 1% downside for the week. Technology, the biggest sector of the index, had a weekly downside of 0.4%.
According to the CME FedWatch tool, the federal funds futures market traders are anticipating the Fed will hold its benchmark rate steady at next week's policy meeting and again in May, with a 55% chance of a quarter-percentage-point cut in June to a target range of 5%-5.25%.
Technical Perspective
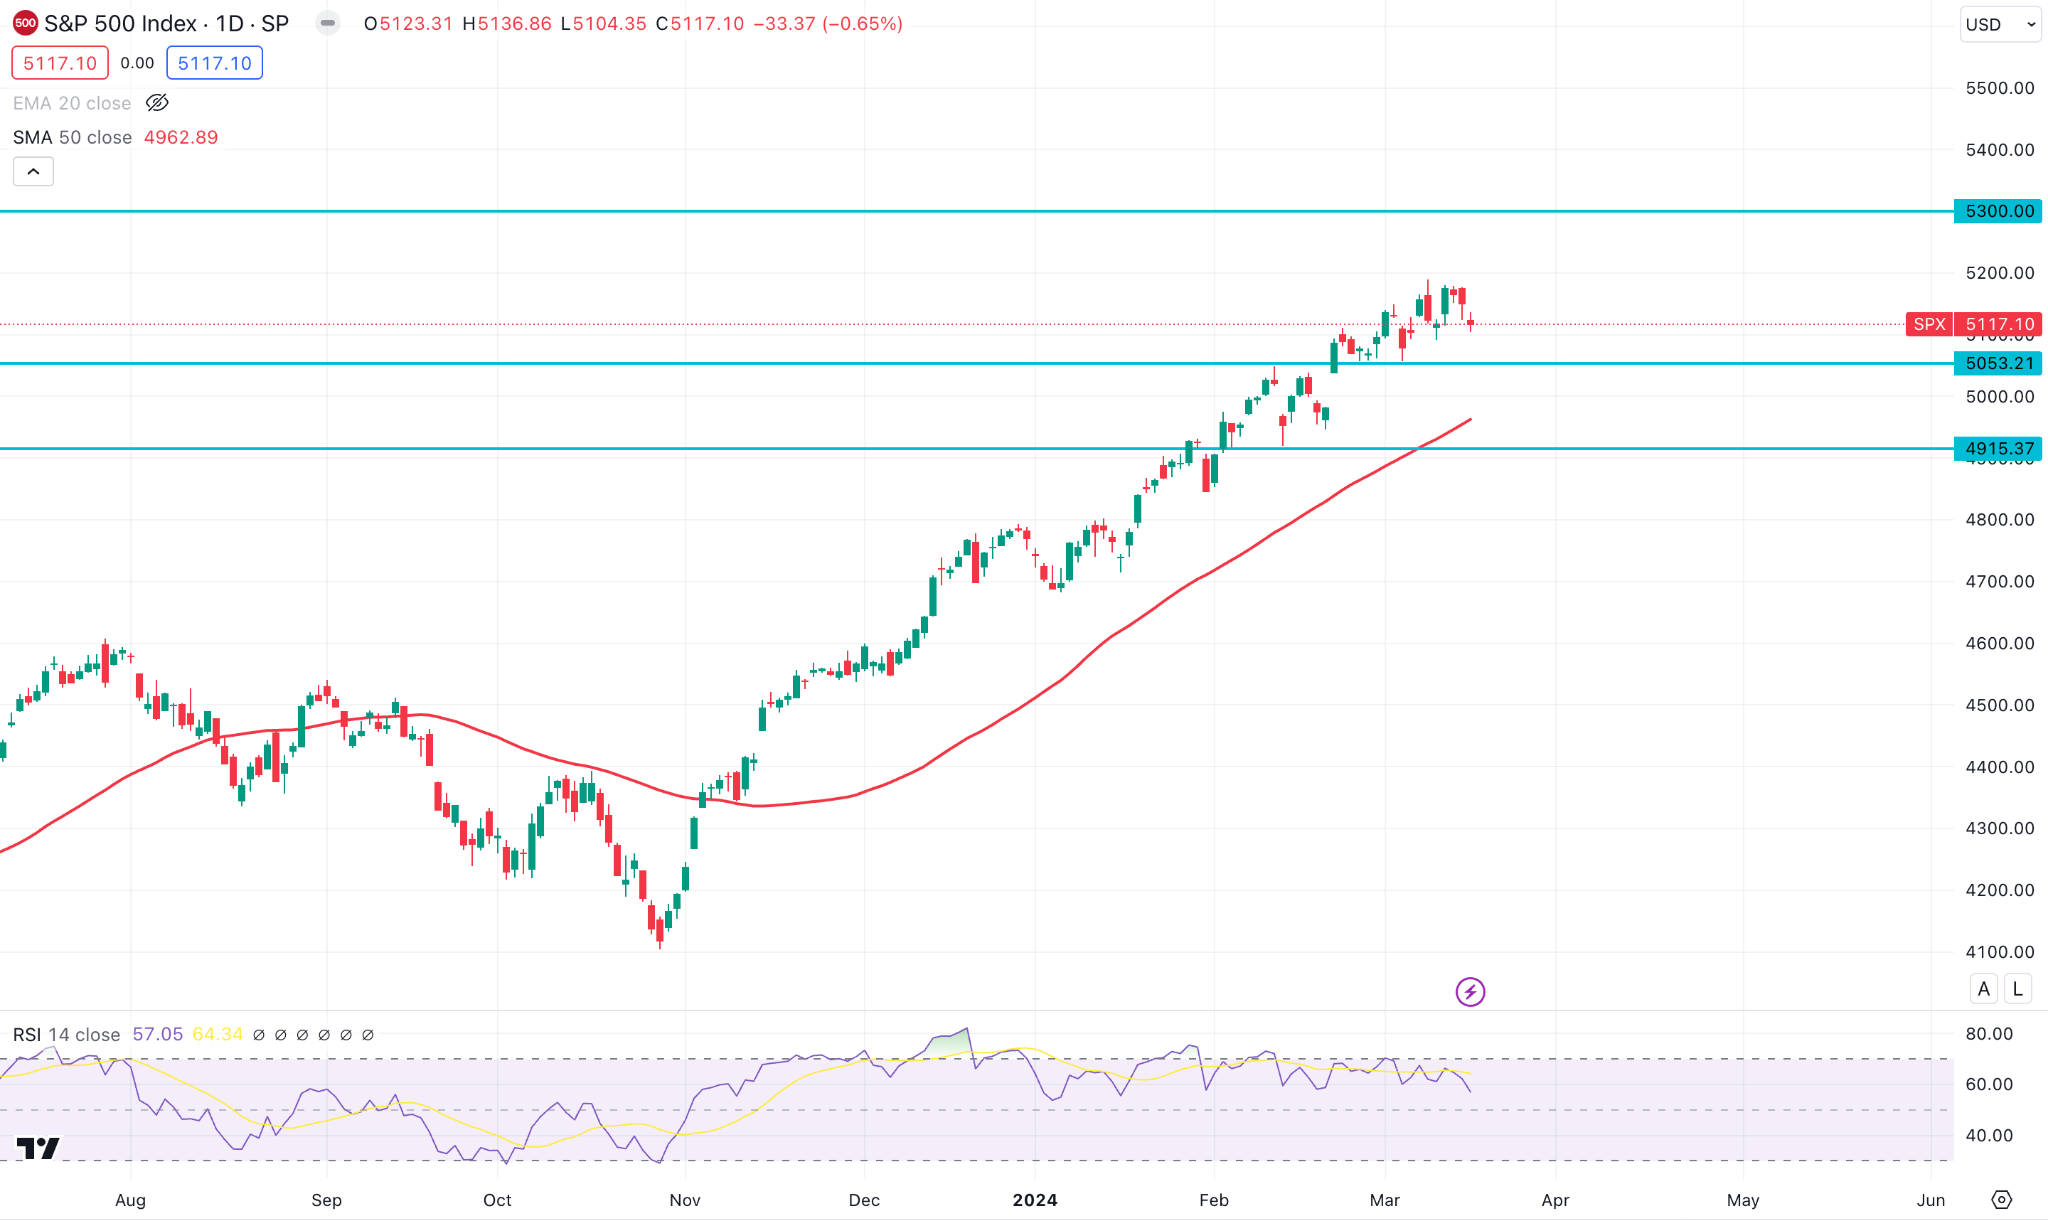
The weekly chart of the S&P 500 index shows a sharp uptrend, and the price remains at the top. The RSI window shows the price remains overbought, indicating a correction toward the 4790 level.
The daily chart shows that the price dropped from the peak near the 5177 level. It can regain the bull pressure to reach the high and continue to grow toward a new high.
On the other hand, significant sell pressure can push the price toward the recent support level near 4800, followed by another significant support zone near 4600.
Bitcoin (BTCUSD)
Fundamental Perspective
Bitcoin reached ATH this week, but investors need to notice if the weekly candle fails to close above the previous ATH of $69,000, it can be a swing failure pattern. The setup indicates buy pressure may fade at this level and a possible upcoming trend reversal.
It is absurd that the price of BTC will retreat just after posting a new ATH. However, if it occurs, the key swing low remains near $42,000 to create a new lower low, as seen in the weekly chart. Taking the overall general outlook of the market and bullish ETF flows into consideration, it is an incredible scenario, too.
The Fed (Federal Reserve) may start interest rate cuts, which could trigger short-term volatility and correction in the short term. That can be the scenario the US Fed can trigger. Again, considering the current market condition, this is an abnormal outlook. However, keep the Bitcoin Halving in mind that it is only 33 days away.
Technical Perspective
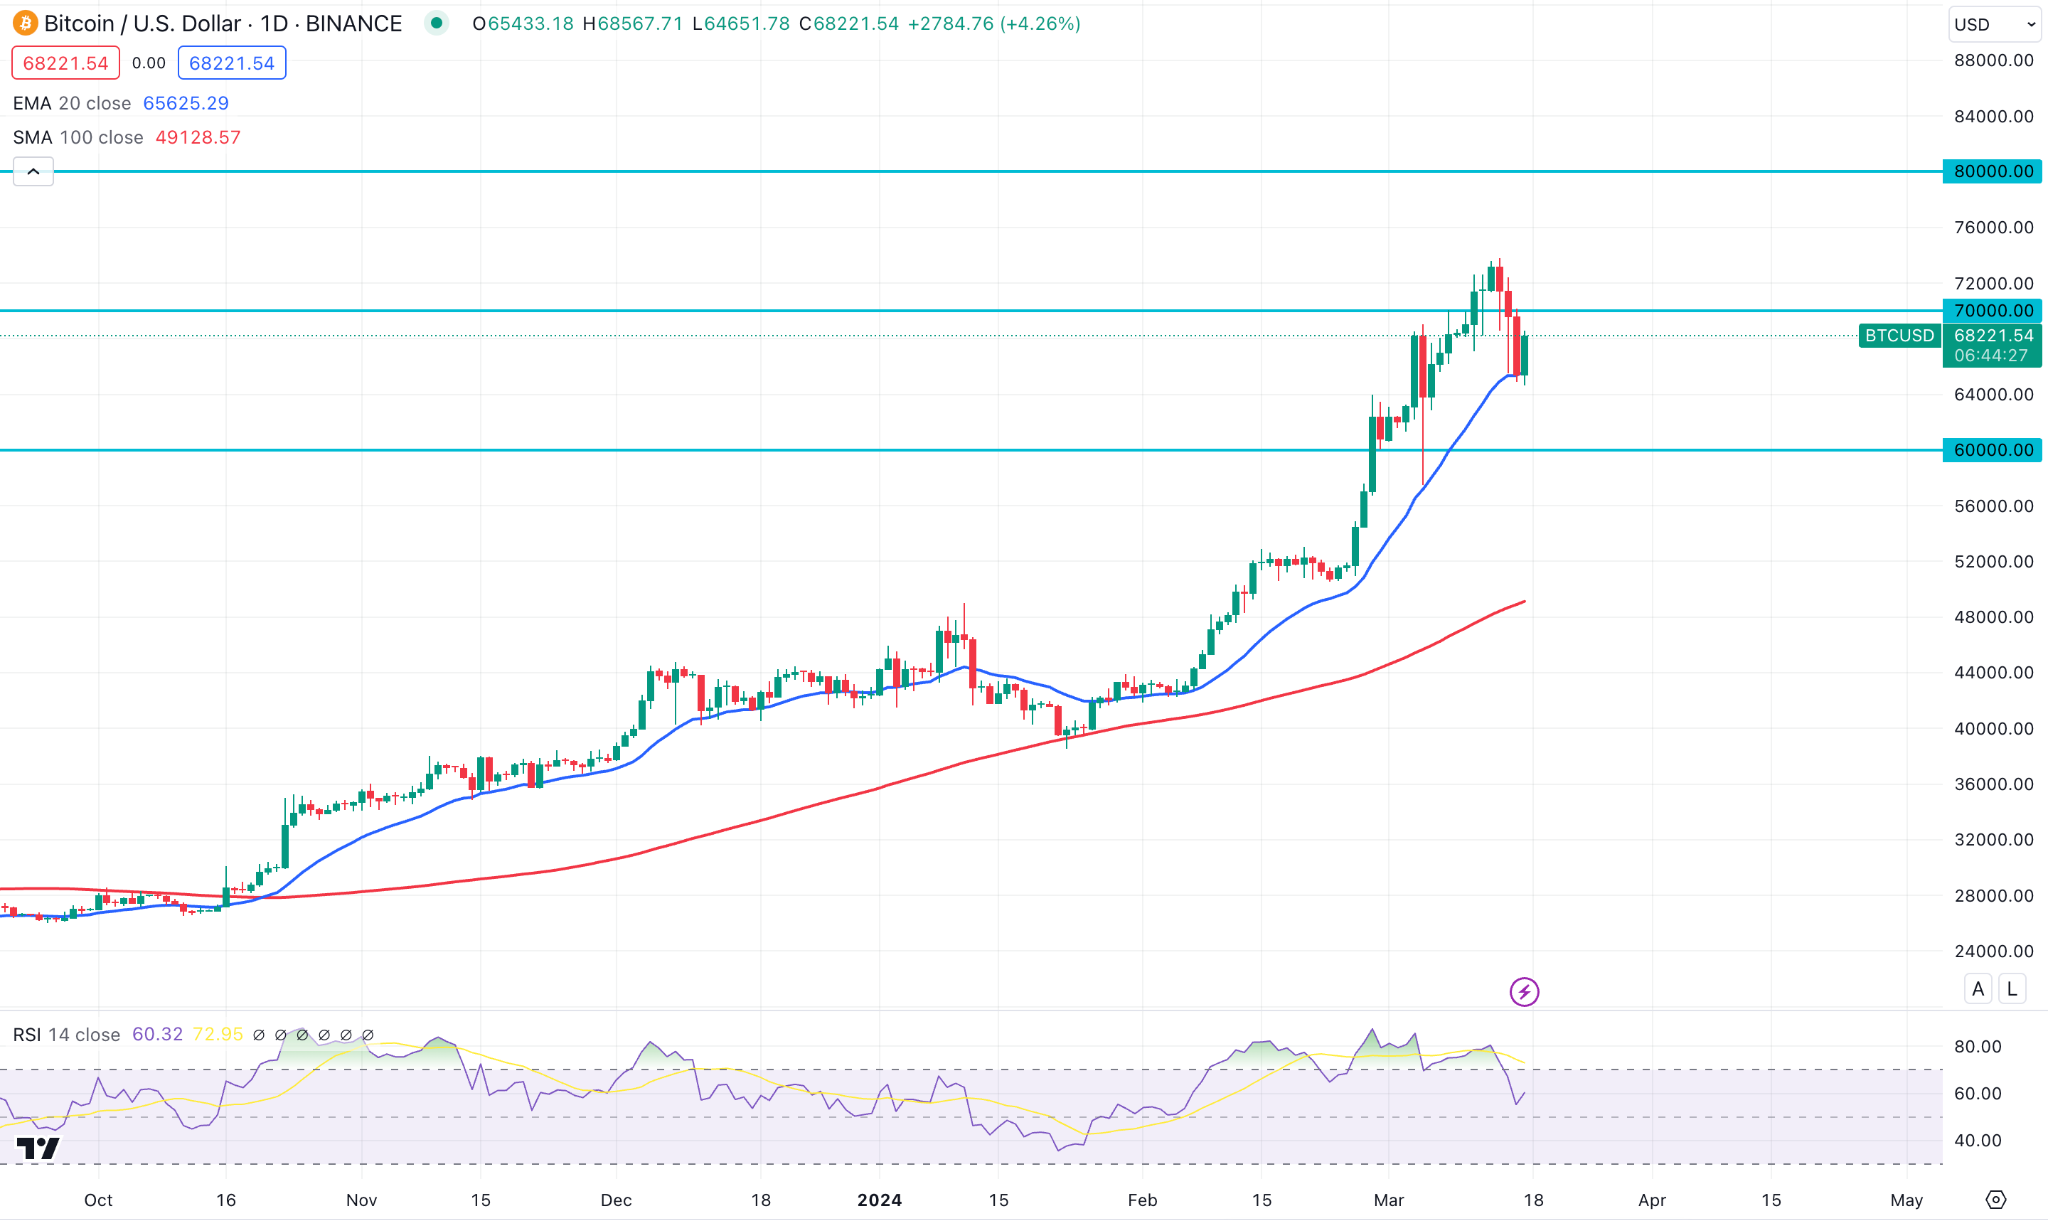
The weekly BTC candle is red and retreats after reaching an ATH of nearly $73,650.
The daily candle shows the price drops for several days after reaching the new ATH. It can be a minor correction before reaching a new ATH. The psychological level is $100,000. On the other hand, the price can reach nearly $42,000 level, after having a solid bearish candle below the $60,000 level.
Ethereum (ETHUSD)
Fundamental Perspective
Current fluctuations in ETH have triggered the involvement of significant institutions, including Alameda Research and FTX.
According to recent data from Spot on Chain, these companies have been enthusiastically transferring considerable amounts of ETH, equivalent to 6,500 ETH, to Coinbase, which equals $24.57 million.
Surprisingly, these transactions have united with the sudden price drop of Ethereum, indicating a potential correlation between massive transactions from Almeda Research and FTX and the price drop of Ethereum.
Meanwhile, US Senator Butler and Reed want to abstain from granting approval of new ETFs beyond BTC for alternative tokens as they called on the US Securities and Exchange Commission (SEC). Unconditionally, policymaking bodies are pushing for SEC approval for spot Ethereum ETF dismissal.
Coinbase's Chief Legal Officer, Paul Grewal, presented evidence by releasing a statement to the Senators that opposes their claims. He explained that plentiful digital assets have upper market quality beyond BTC compared to most heavily traded stocks. For example, the spot market of Ethereum has liquidity and depth, surpassing only two of the S&P 500 stocks' trading volumes. Additionally, the bid-ask spread of ETH is lower than only one S&P 500 stock.
The crypto community is still optimistic about the ETFs of spot ETH despite the US Senators' opposition to ETFs' further approval.
Technical Perspective
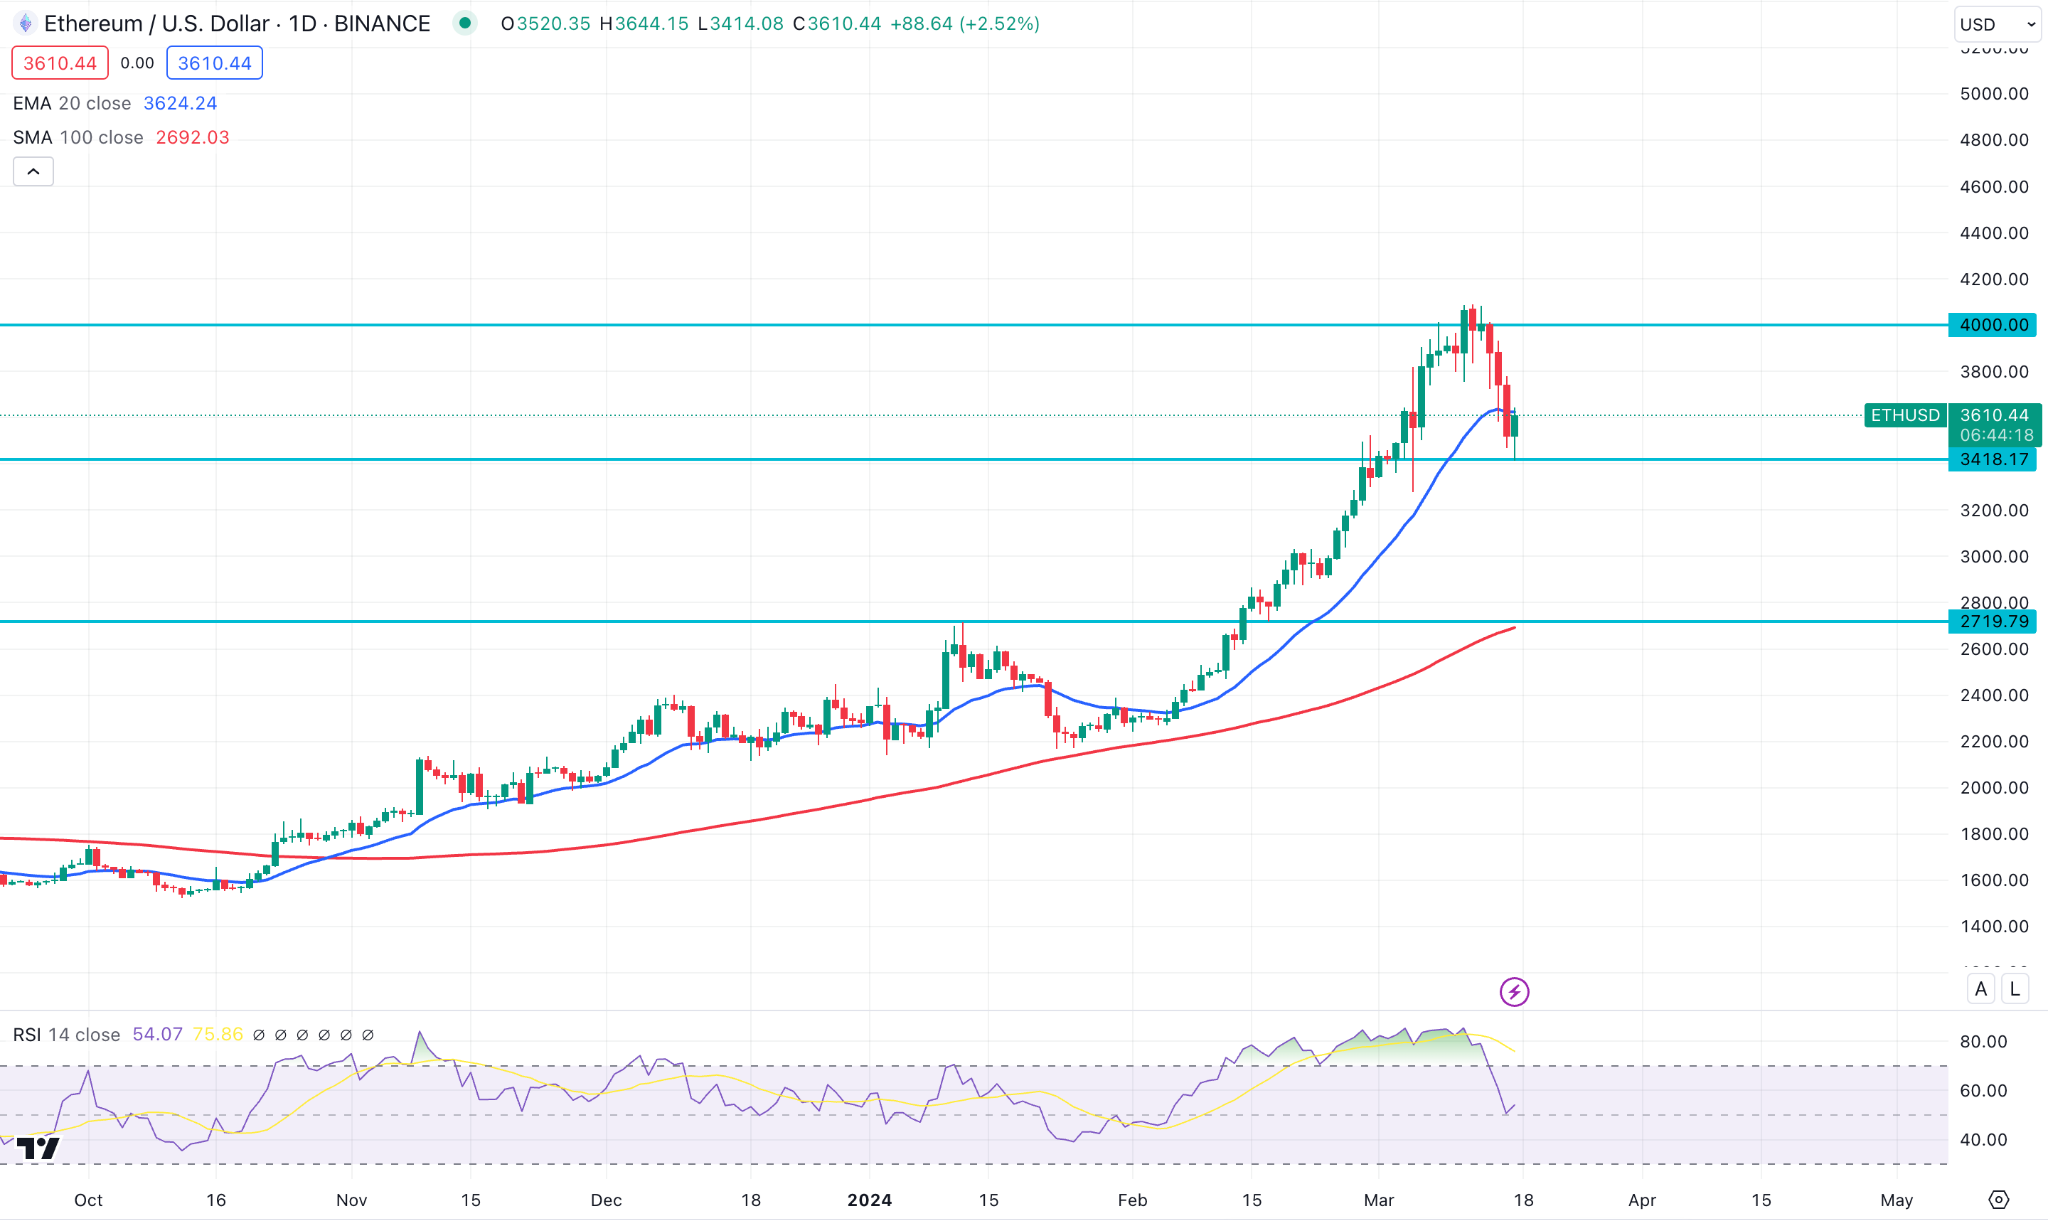
Ethereum (ETH) price hit the 4000.00 psychological level with 5 consecutive bullish weekly closes.
Investors should monitor price reactions in the 4000.00 psychological line in the coming days. A daily candle above this level could trigger the price towards the 5000.00 level.
On the other hand, the price can reach nearly 3418.18 for a downside correction after having a solid downside pressure below the 4000.00 level.
Nvidia Stock (NVDA)
Fundamental Perspective
The bulls on artificial intelligence (AI) have been squashing an ETF fund that multiplies the return from Nvidia stock as inflows and trading volume hit record highs. After pulling in more than $1 billion YTD, the ETF, GraniteShares 2x Long NVDA Daily ETF (NVDL), newly carried out a split 6 for 1 stock. The solid interest in NVDL comes from its indefatigable growth.
Many investors gradually wondered whether the chipmaker was considering itself a stock split after surpassing the $900 mark recently.
GraniteShares, a global ETF issuer, declared a split forward of a 6-for-1 stock for the NVDL ETF last month. The fund design allows investors to have twice the daily return of NVDA stock.
After the split took effect on 13 March, the number of outstanding shares increased by approx. 500%, but did not impact the total outstanding shares market value.
The Nvidia ETF, or NVDL, has witnessed its asset surge to $2 billion due to increasing investors' enthusiasm for AI companies.
According to etf.com, with a significant inflow of $545.8 million on 11 March, the fund recorded an additional investment of $1.02 billion this year. Bloomberg data revealed that by early 13 March, assets under the management of the NVDA ETF had reached $1.98 billion and recorded a price surge of three times this year.
Technical Perspective
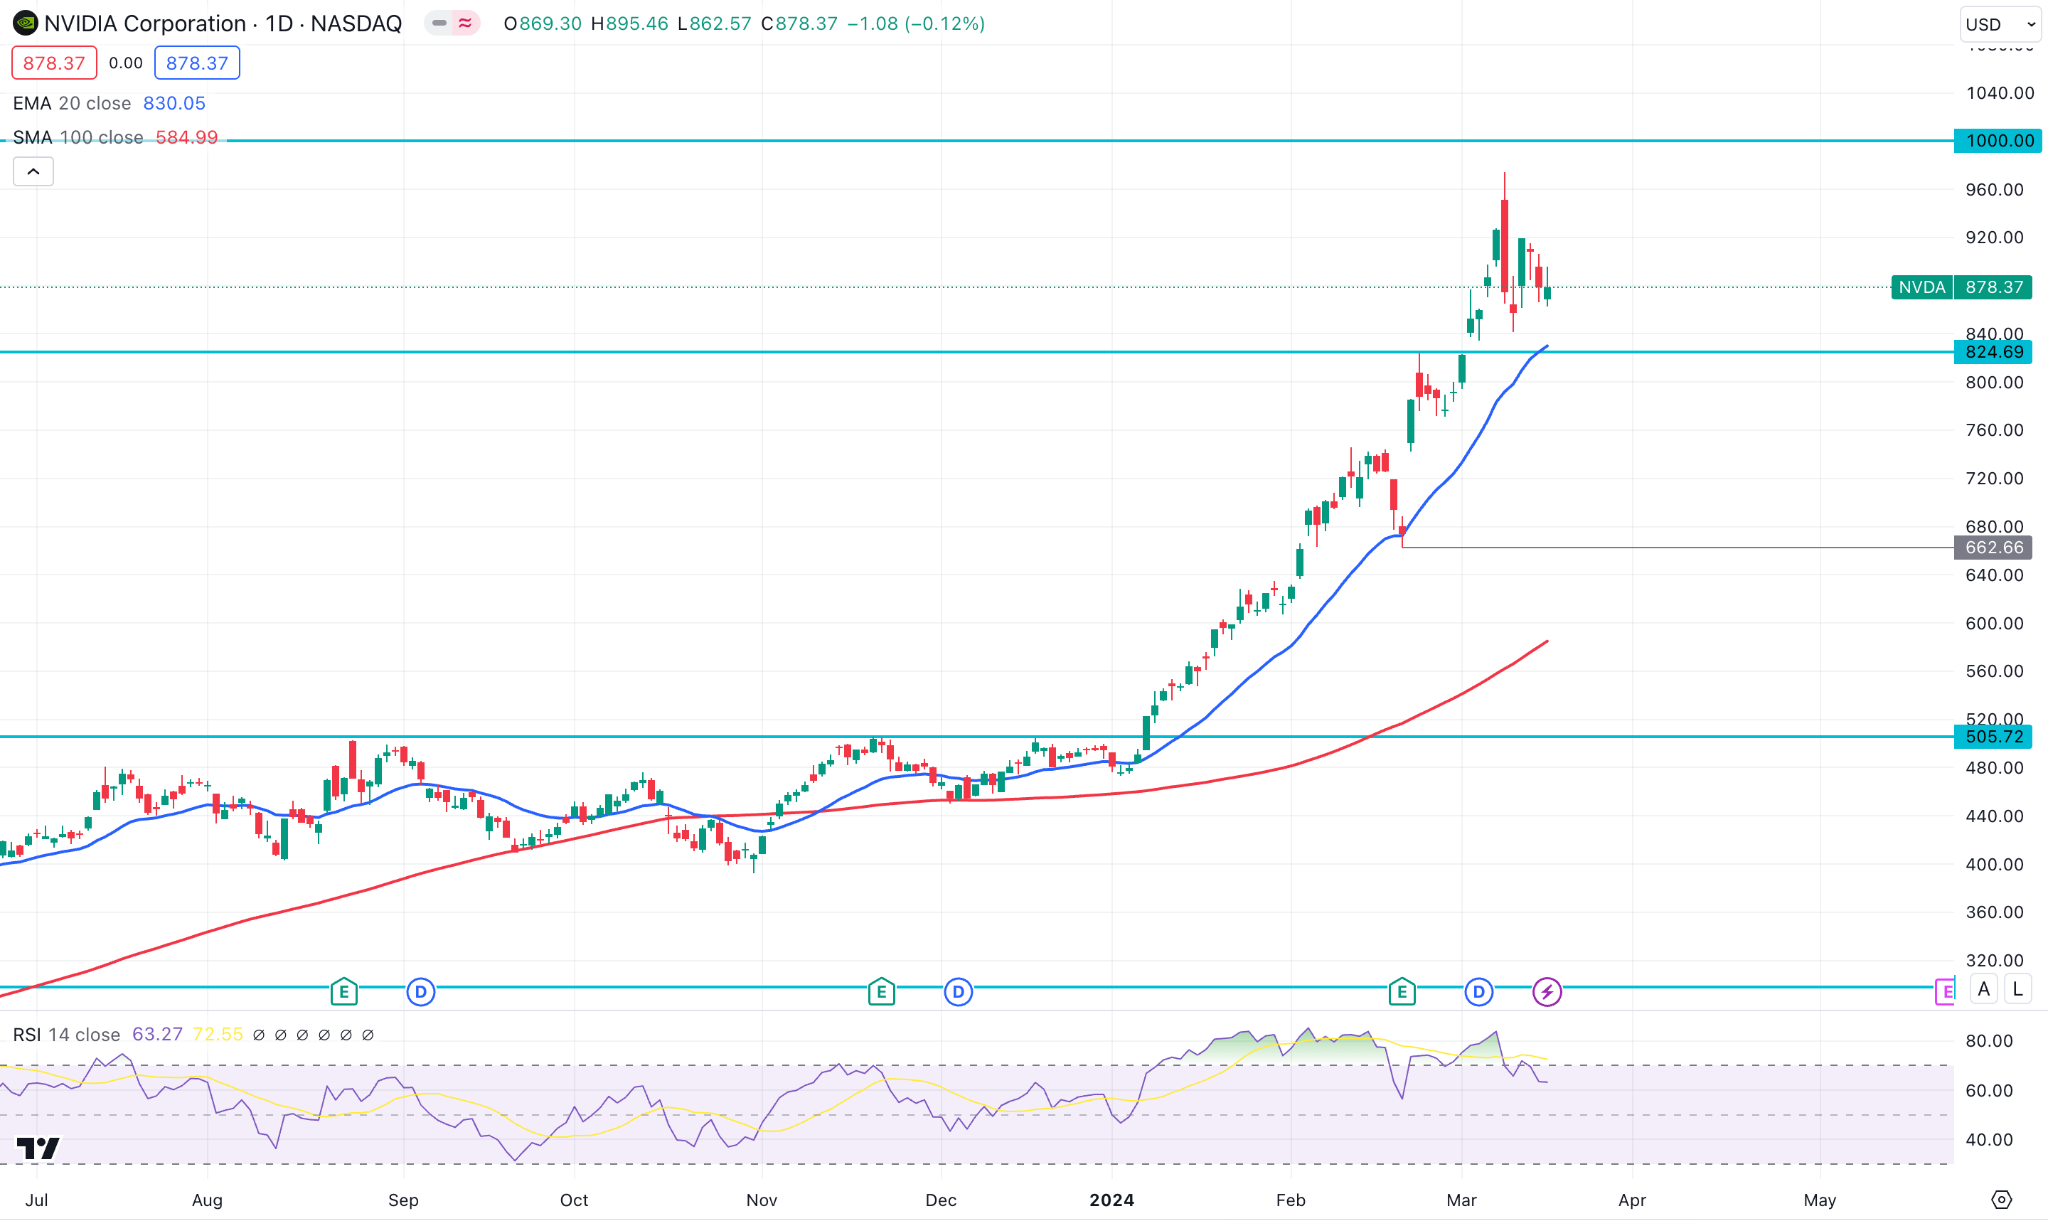
The weekly chart of NVDA stock shows a sharp uptrend, and the RSI window confirms the price remains at an overbought level.
The daily chart shows the price resting just below the recent high, near 974.00. The price can continue to uptrend as long as the positive vibe continues for this stock, and it can reach a new high, surpassing the recent peak.
On the other hand, the price can take a correction near the 825.00 (EMA 20) level or, if worse, reach a solid support level near 750 before reaching a new high.
Tesla Stock (TSLA)
Fundamental Perspective
On Friday, Tesla (TSLA), the automaker, said on its website that it will increase prices for all Model Y cars on April 1 by $1000 in the USA.
Tesla said on its website, "Prices will increase by $1,000 for all Model Y trims on April 1."
The company has also increased the prices of its long-range vehicles and Model Y rear-wheel on March 1 to $48,990 and $43,990, respectively.
Tesla did not explicitly clarify if the April increase would come on top of the March increase for the long-range and rear-wheel models.
In February, Tesla temporarily cut prices on some of its Model Y cars in the United States after a month of price slashing in China and Europe.
Elon Musk, the CEO, said, "This is the essential quandary of manufacturing: factories need continuous production for efficiency, but consumer demand is seasonal," in February, in reply to a post from Tesla on X saying in March, the price would go up.
Technical Perspective
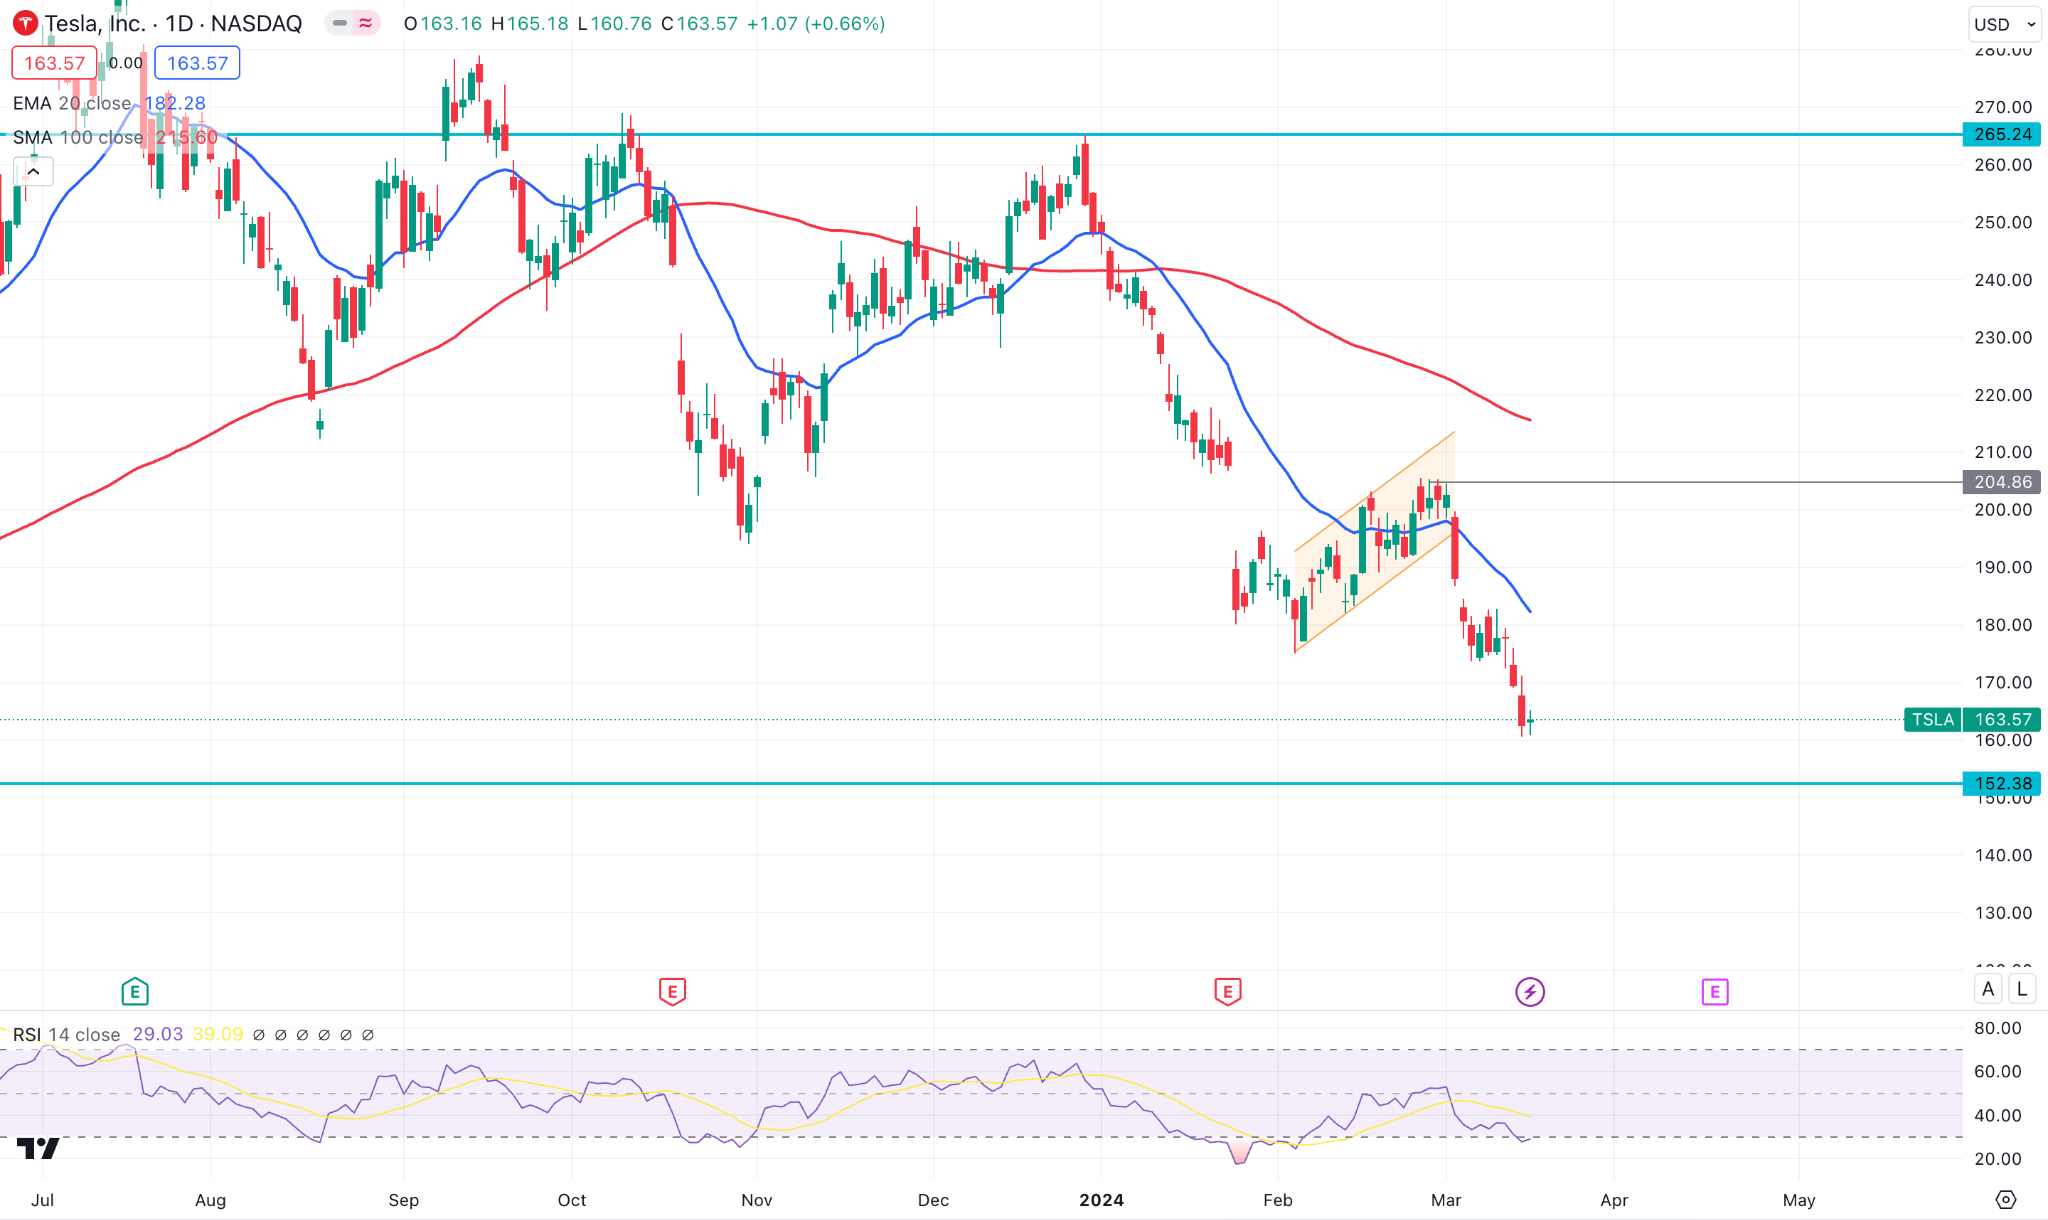
TSLA stock price has continuously declined for two weeks, ending in the red on the weekly candle.
However, the price sharply declines toward a crucial support zone near 154.7, which may trigger bullish pressure to regain its peak at 265.
Gold (XAUUSD)
Fundamental Perspective
On Monday, the market started slowly, and Gold competed to gather new directional momentum, closing with trivial gain. The Bureau of Labor Statistics (BLS) published the United States annual inflation on Tuesday, as measured by the Consumer Price Index (CPI) change, which increased in February to 3.2% compared to January 3.1%. Both CPI and core CPI increased by 4% on a monthly basis. After the data release, the 10-year US Treasury bond yield benchmark surged more than 1%, bringing XAU/USD down by 1% from consecutive nine-day winning.
Data showed in February, the PPI index increased by 1.6%, followed by a 1% increase in January, beating market expectations of 1.1%. Other data revealed that retail sales in February increased by 0.6% after dropping by 1.1% in January, while unemployment claims dropped slightly to 209,000. Investors started reevaluating the Fed's policy pivot timing following these data releases.
The chance of leaving the policy rate is 5.25%-5.% by the Fed in June, which just surged to 40% from 30% ahead of these data releases, according to the CME FedWatch Tool. The US 10-year yield advanced to its highest level at 4.3% in two weeks, continuing its uptrend. In the meantime, Gold dropped below $2,160, facing considerable sell pressure on the asset.
Gold recovered to the $2,170 area and regained traction early Friday, while the US 10-year yield faced downside correction. However, XAU/USD finished the week in negative territory by retracing its daily rebound.
On Wednesday, the Federal Reserve will publish a revised SEP and announce its monetary policy discussion. The Fed is widely expected to keep its monetary policy settings unchanged.
Technical Perspective
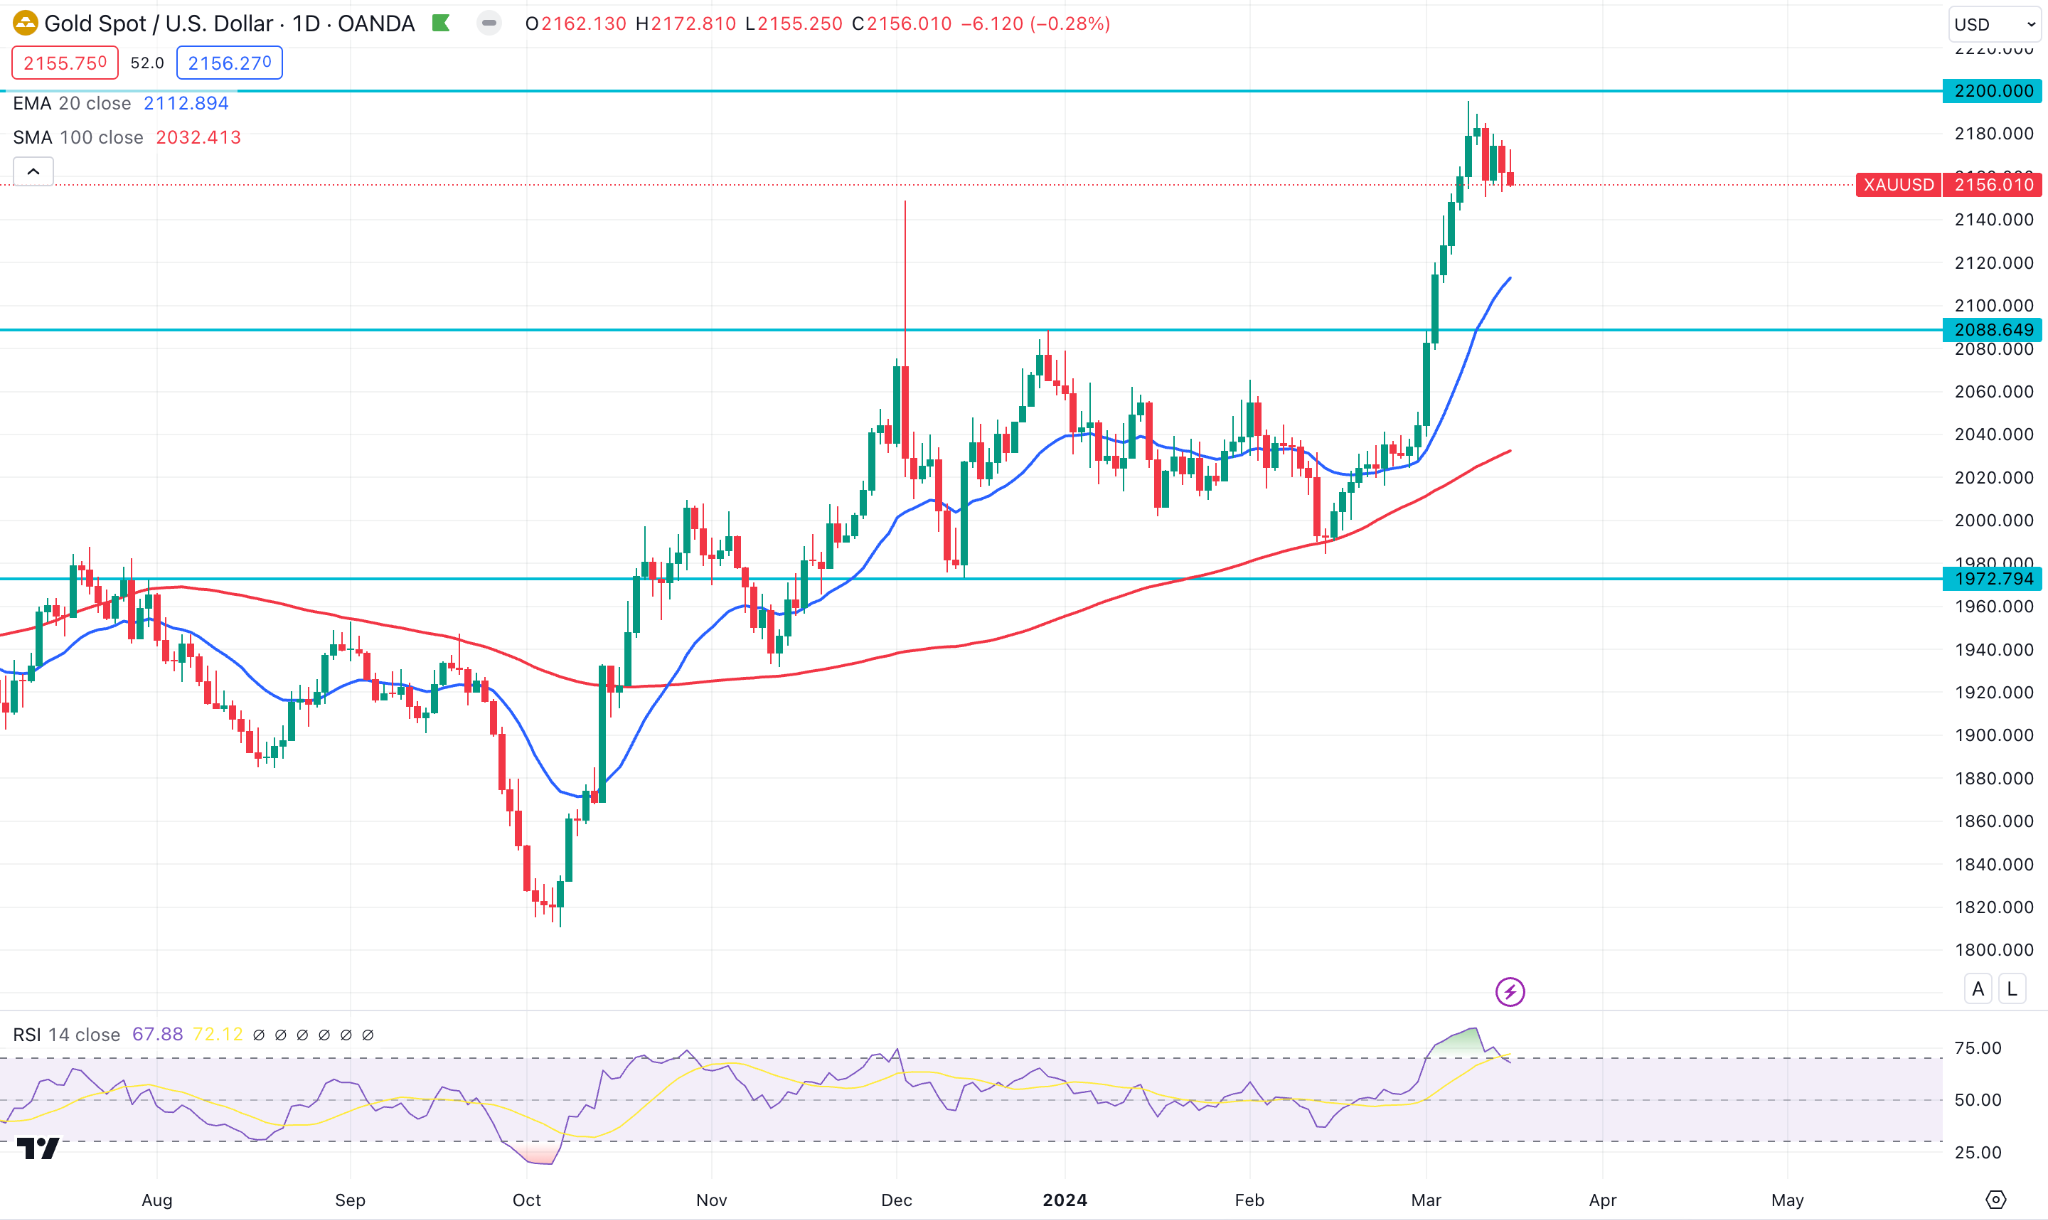
The weekly chart shows that XAU/USD reached just near $2,195 per ounce last week, following three winning weeks.
The daily chart shows bearish pressure after a bit of consolidation. The price can reach a record high of $2,250 after breaking the recent high near $2,195. On the other hand, it can retrace back to the recent support zone near $2,075.
WTI Crude Oil (USOUSD)
Fundamental Perspective
On Friday, oil prices dropped from the high for the first time since November, dropping from $85 per barrel. In contrast, it was expected to end 3% upside weekly due to increasing demand from the United States refiners fulfilling planned reshaping.
In the last month, the price was on consolidation between $80 and $85. Then, on Thursday, the International Energy Agency declared its oil demand view in 2024 for the fourth time since November last year due to Houthi attacks that have interrupted Red Sea shipping.
The IEA said in 2024, world oil demand will increase by 1.3 million bpd, up from last month's 110,000 bpd. It forecasts a little supply insufficiency this year, so OPEC+ members should endure their output cuts, having previously forecasted an additional.
An early indicator of future output, the oil and gas rig count increased in the week to 15 March by 7 to 629. Baker Hughes said oil rigs increased by six to 510 this week, their highest since September. Meanwhile, gas rigs increased by one to 116.
Despite strengthening the U.S. dollar, this week's gains have come at its fastest pace in eight weeks. A stronger dollar makes crude more expensive for users of other currencies.
Technical Perspective
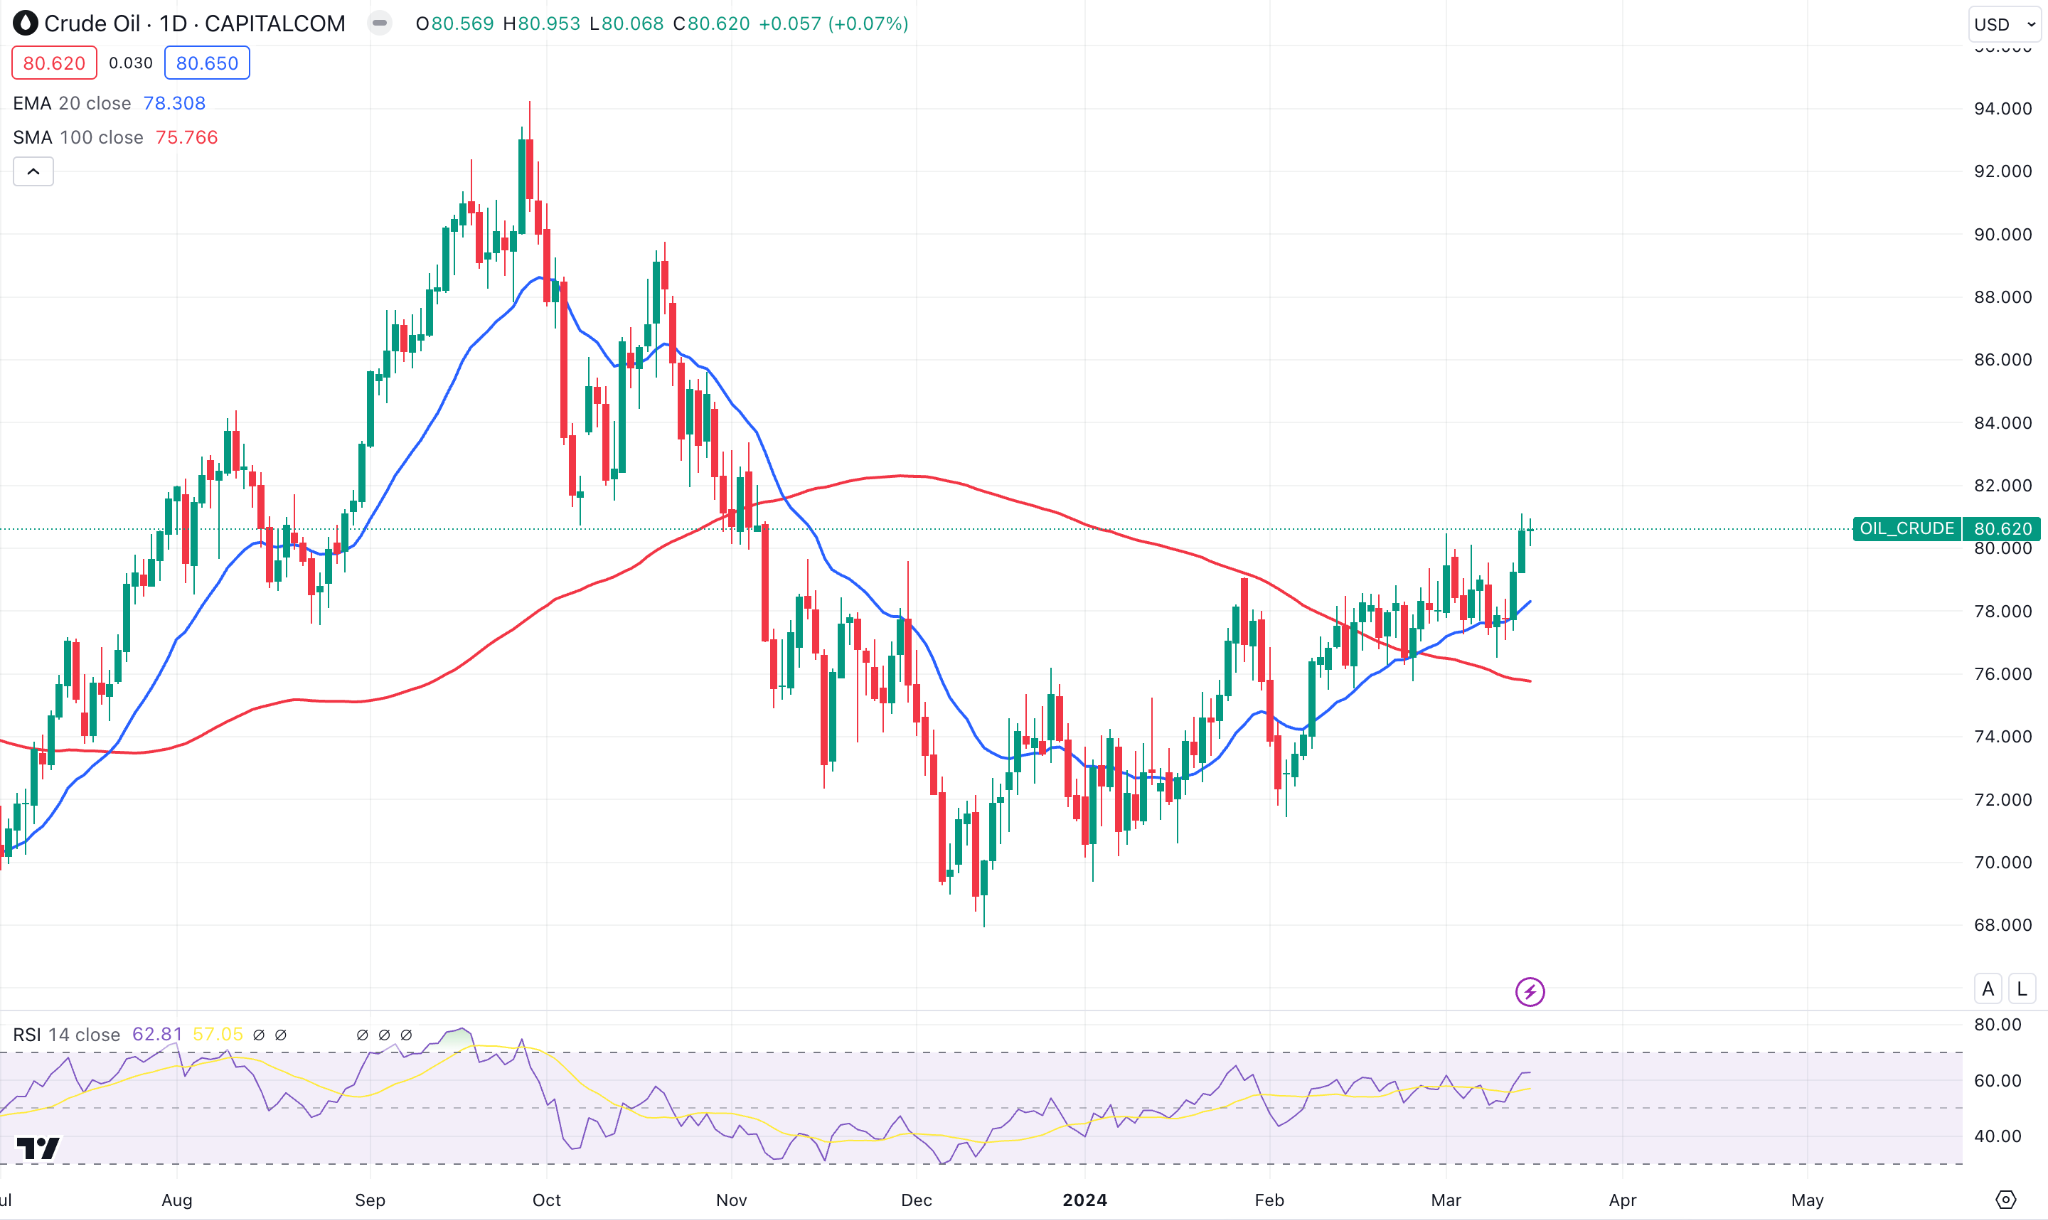
The weekly chart shows the price has been on an uptrend for several weeks. The daily chart shows the price remains above the recent peak of $80.
It can reach the next resistance near $90, followed by the next resistance near $100 in the upcoming week if the daily chart closes above $80. However, on the downside, the support level remains near $77, and a breakdown below that level can open the door to the next support near $72.5.


