Here are today's directional views from the global research desks of Trading Central! These are starting points for your own research to identify opportunities that make sense for you. Like what you see? Feel free to forward this to a friend!

Market Wrap: Stocks, Bonds, Commodities
On Wednesday, U.S. tech stocks posted losses, as the Nasdaq 100 fell 254 points (-1.75%) to 14,303, and the S&P 500 dropped 16 points (-0.38%) to 4,267. Meanwhile, the Dow Jones Industrial Average rose 91 points (+0.27%) to 33,665.
Investors felt uneasy after Australia's and Canada's central banks raised interest rates unexpectedly. Next week, latest U.S. inflation data will be released, and the Federal Reserve will decide on interest rates.
Software & services (-2.74%), media (-2.25%), and retailing (-2.1%) stock sectors lost the most, while energy (+2.65%), transportation (+2.23%), and capital goods (+1.98%) stock sectors outperformed the market.
Tesla (TSLA) once exceeded $230 before retreating to close at $224.57, still up 1.47% on day and posting a nine-session winning streak.
Ford Motor (F) gained 5.10%.
On the other hand, Microsoft (MSFT) fell 3.09%, Alphabet (GOOGL) dropped 3.78%, Amazon.com (AMZN) slid 4.25%, Meta Platforms (META) lost 2.77%, and Nvidia (NVDA) was down 3.05%.
Artificial intelligence (A.I.)-related stock Palantir Technologies (PLTR) surged 11% at open, only to reverse course and close 4.98% lower on day.
Meanwhile, Warner Bros Discovery (WBD) jumped 8.43%, Whirlpool Corp (WHR) rose 6.37%, Marathon Oil (MRO) climbed 4.87%, Phillips 66 (PSX) advanced 4.37%, and Halliburton (HAL) was up 4.23%.
The U.S. 10-year Treasury yield jumped 13.1 basis points to 3.791%
European stocks closed slightly lower. The DAX 40 fell 0.20%, the CAC 40 dropped 0.09%, and the FTSE 100 dipped 0.05%.
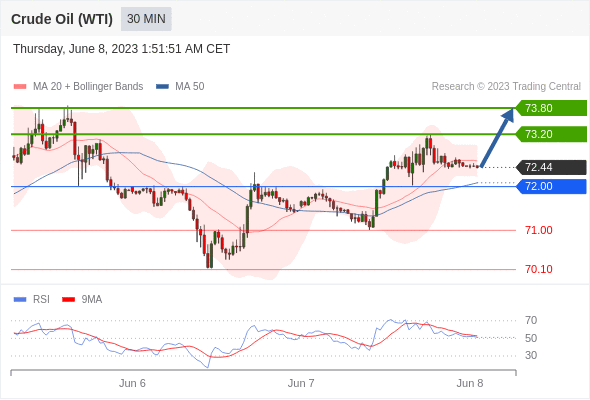
U.S. WTI crude futures increased $0.80 to $72.52 a barrel. The U.S. Energy Department reported a reduction of 452,000 barrels in crude-oil stockpiles (vs +1.02 million barrels expected).
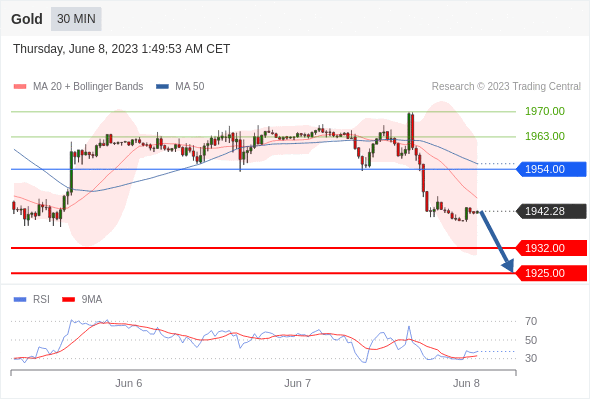
Gold price slid $22 to $1,940 an ounce.
Market Wrap: Forex
The U.S. dollar index stayed firm at 104.14.
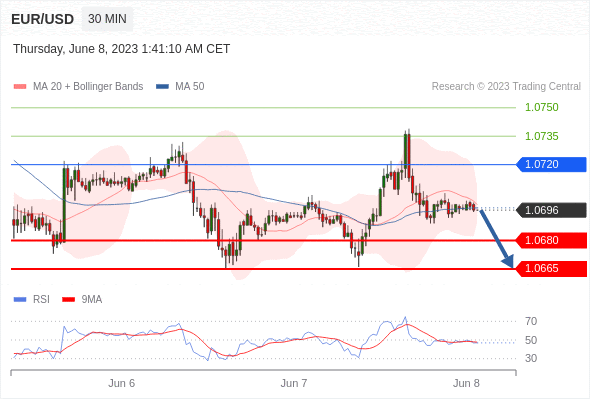
EUR/USD added 6 pips to 1.0699. Germany's data showed that industrial production grew 0.3% on month in April (vs +0.9% expected).
USD/JPY climbed 54 pips to 140.17.
GBP/USD gained 14 pips to 1.2438. In the U.K., the Halifax house price index was flat in May as compared to the previous month (vs -0.2% expected).
Also, the Royal Institute of Chartered Surveyors house price balance improved to -30% in May (vs -37% expected).
AUD/USD fell 19pips to 0.6652. Australia's data showed that gross domestic product grew 2.3% year over year in the first quarter (vs +2.4% expected).
USD/CHF rose 26 pips to 0.9102.
USD/CAD slid 30 pips to 1.3373. Canada's central bank raised its key interest rate by 25 basis points to 4.75%, compared to analyst expectations that it would keep rate unchanged at 4.50%.
Bitcoin slid over 3% back to $26,280.

Gold Intraday: the downside prevails.
Pivot:
1954.00
Our preference:
Short positions below 1954.00 with targets at 1932.00 & 1925.00 in extension.
Alternative scenario:
Above 1954.00 look for further upside with 1963.00 & 1970.00 as targets.
Comment:
The RSI is bearish and calls for further decline.

Crude Oil (WTI) (N3) Intraday: bullish bias above 72.00.
Pivot:
72.00
Our preference:
Long positions above 72.00 with targets at 73.20 & 73.80 in extension.
Alternative scenario:
Below 72.00 look for further downside with 71.00 & 70.10 as targets.
Comment:
Technically the RSI is above its neutrality area at 50.

EUR/USD Intraday: key resistance at 1.0720.
Pivot:
1.0720
Our preference:
Short positions below 1.0720 with targets at 1.0680 & 1.0665 in extension.
Alternative scenario:
Above 1.0720 look for further upside with 1.0735 & 1.0750 as targets.
Comment:
As long as 1.0720 is resistance, look for choppy price action with a bearish bias.

Bitcoin / Dollar intraday: the downside prevails as long as 26790 is resistance
26790 is our pivot point.
Our preference:
The downside prevails as long as 26790 is resistance.
Alternative scenario:
The upside breakout of 26790, would call for 27160 and 27370.
Comment:
The RSI is below its neutrality area at 50. The MACD is below its signal line and negative. The configuration is negative. Moreover, the price is trading under both its 20 and 50 period moving average (respectively at 26581 and 26813).

S&P 500 (CME) (M3) Intraday: the downside prevails.
Pivot:
4283.00
Our preference:
Short positions below 4283.00 with targets at 4268.00 & 4262.00 in extension.
Alternative scenario:
Above 4283.00 look for further upside with 4295.00 & 4305.00 as targets.
Comment:
The RSI is below its neutrality area at 50%

Tesla intraday: as long as 221.6 is support look for 232.6
Our pivot point stands at 221.6.
Our preference:
As long as 221.6 is support look for 232.6.
Alternative scenario:
The downside breakout of 221.6 would call for 217.8 and 215.8.
Comment:
The RSI is above 50. The MACD is positive and below its signal line. The price could retrace. Tesla is trading above both its 20 and 50 period moving average (respectively at 223.64 and 219.66).

*Disclaimer: The content of this article is for learning purposes only and does not represent the official position of VSTAR, nor can it be used as investment advice.


.png)


