Here are today's directional views from the global research desks of Trading Central! These are starting points for your own research to identify opportunities that make sense for you. Like what you see? Feel free to forward this to a friend!

Market Wrap: Stocks, Bonds, Commodities
On Thursday, U.S. stocks closed higher, led by technology shares. The Nasdaq 100 rose 181 points (+1.27%) to 14,484, the S&P 500 climbed 26 points (+0.62%) to 4,293, and the Dow Jones Industrial Average was up 168 points (+0.50%) to 33,833.
The latest number of initial jobless claims in the U.S. increased more than expected to 261,000 (vs 235,000 expected), indicating that the labor market is cooling, and that the Federal Reserve could pause hiking interest rates.
The U.S. 10-year Treasury Yield dropped 7.9 basis points to 3.716%.
Automobiles (+3.66%), semiconductors (+1.63%), and retailing (+1.5%) stock sectors were the top performers in the session.
Tesla (TSLA) gained 4.58% to $234.86, extending its winning streak to a tenth session, the longest one since 2021.
In after-market hours, the Tesla gained a further 5%, and General Motors (GM) was up 4%. Both companies announced a collaboration in which Tesla will open its fast-charging network in North America to General Motors electric vehicles.
Amazon.com (AMZN) rose 2.49% as the tech giant was rated "overweight" at Wells Fargo.
At the same time, Apple (AAPL) climbed 1.55%, Nvidia (NVDA) advanced 2.76%, and Netflix (NFLX) was up 2.40%.
GameStop (GME) plunged 17.89%. The videogame retailer reported a bigger-than-expected quarterly loss, and ousted its chief executive.
In Europe, the DAX 40 rose 0.18%, the CAC 40 gained 0.27%, while the FTSE 100 was down 0.32%.
U.S. WTI crude futures fell $1.60 to $70.92 a barrel.
Gold price rebounded $25 to $1,965 an ounce.
Market Wrap: Forex
The U.S. dollar weakened against other major currencies on signs that the labor market is cooling. The dollar index fell to 103.33.
EUR/USD gained 82 pips to 1.0781, and GBP/USD jumped 120 pips to 1.2558.
USD/JPY slid 120 pips to 138.93. This morning, the Bank of Japan reported that the M2 money stock grew 2.7% on year in May (vs +2.6% in April).
AUD/USD climbed 63 pips to 0.6715. Australia's data showed that the trade surplus declined to A$11.16 billion in April (vs A$12.40 billion expected) with exports shrinking 5.0% on month.
USD/CHF dropped 108 pips to 0.8993, and USD/CAD dipped 15 pips to 1.3355.
Bitcoin was little changed at $26,480.

Gold Intraday: bullish bias above 1954.00.
Pivot:
1954.00
Our preference:
Long positions above 1954.00 with targets at 1974.00 & 1983.00 in extension.
Alternative scenario:
Below 1954.00 look for further downside with 1947.00 & 1939.00 as targets.
Comment:
The RSI is bullish and calls for further advance.

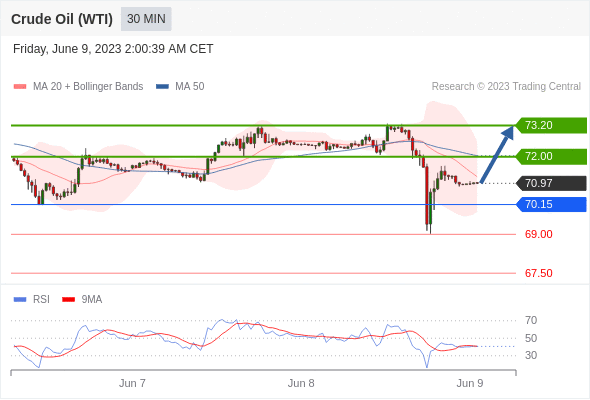
Crude Oil (WTI) (N3) Intraday: intraday support around 70.15.
Pivot:
70.15
Our preference:
Long positions above 70.15 with targets at 72.00 & 73.20 in extension.
Alternative scenario:
Below 70.15 look for further downside with 69.00 & 67.50 as targets.
Comment:
The next resistances are at 72.00 and then at 73.20.

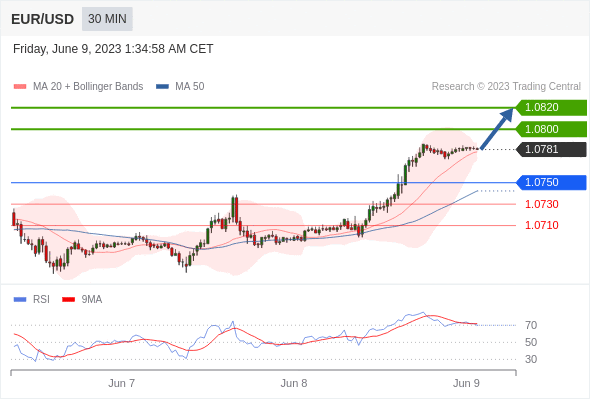
EUR/USD Intraday: the upside prevails.
Pivot:
1.0750
Our preference:
Long positions above 1.0750 with targets at 1.0800 & 1.0820 in extension.
Alternative scenario:
Below 1.0750 look for further downside with 1.0730 & 1.0710 as targets.
Comment:
The RSI is bullish and calls for further upside.

Bitcoin / Dollar intraday: target 25840
Our pivot point is at 26800.
Our preference:
Target 25840.
Alternative scenario:
Above 26800, look for 27170 and 27380.
Comment:
The RSI is below 50. The MACD is positive and below its signal line. The MACD must penetrate its zero line to expect further downside. Moreover, the price is trading under its 20 period moving average (26570) but above its 50 period moving average (26474).

S&P 500 (CME) (M3) Intraday: bullish bias above 4282.00.
Pivot:
4282.00
Our preference:
Long positions above 4282.00 with targets at 4305.00 & 4315.00 in extension.
Alternative scenario:
Below 4282.00 look for further downside with 4268.00 & 4262.00 as targets.
Comment:
The RSI is above its neutrality area at 50%.

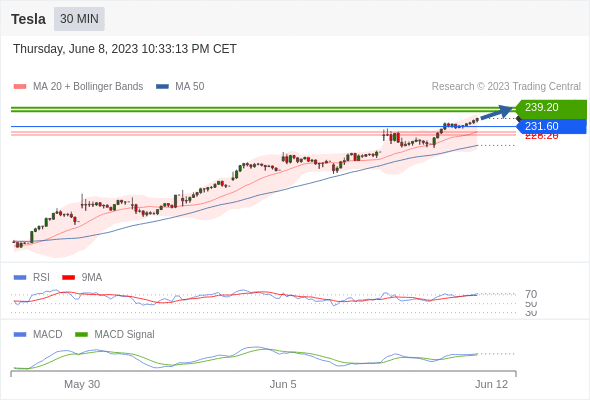
Tesla intraday: the upside prevails as long as 231.6 is support
Our pivot point stands at 231.6.
Our preference:
The upside prevails as long as 231.6 is support.
Alternative scenario:
The downside breakout of 231.6 would call for 229.4 and 228.2.
Comment:
The RSI is above 70. It could mean either that prices are in a lasting uptrend or just overbought and therefore bound to correct (look for bearish divergence in this case). The MACD is positive and above its signal line. The configuration is positive. Tesla is trading above both its 20 and 50 period moving average (respectively at 229.53 and 223.99).

*Disclaimer: The content of this article is for learning purposes only and does not represent the official position of VSTAR, nor can it be used as investment advice.


.png)


