Here are today's directional views from the global research desks of Trading Central! These are starting points for your own research to identify opportunities that make sense for you. Like what you see? Feel free to forward this to a friend!

Market Wrap: Stocks, Bonds, Commodities
U.S. markets were closed on Monday for the Juneteenth holiday.
This morning, futures of major U.S. stock indexes declined slightly.
Investors will be watching closely U.S. Federal Reserve Chair Jerome Powell's congressional testimony to be delivered on Wednesday and Thursday.
European stocks were lower at the close. The Dax 40 fell 0.96%, while the Cac 40 slid 1.01% and the FTSE 100 declined 0.71%.
U.S. crude futures fell $0.49 to $71.29 a barrel, and Brent crude settled $0.48 lower at $76.13 a barrel. Investors were concerned about China's weak economic growth.
Gold declined $7 to $1,950 an ounce.
Market Wrap: Forex
The U.S. dollar kept its strength against other major currencies. The dollar index climbed to 102.52.
EUR/USD fell 18 pips to 1.0919.
USD/JPY gained 15 pips to 141.97.
GBP/USD dropped 38 pips to 1.2779. U.K. house prices remained stable in June after rising 1.8% in May, according to online property agency Rightmove.
AUD/USD declined 29 pips to 0.6846.
USD/CHF rose 22 pips to 0.8960.
USD/CAD added 13 pips to 1.3213. Canada's data showed that producer prices fell 6.3% on year in May (vs -4.0% expected), the sharpest fall since October 2009.
Bitcoin advanced further striking $27,000 on the upside. Bitcoin investors are cheered up by the fact that BlackRock, the world’s biggest asset manager, applied to the U.S. Securities and Exchange Commission (SEC) for the formation of a spot Bitcoin exchange-traded fund (ETF). Meanwhile, market rumors suggest that Fidelity, the world’s third-largest asset manager, may also file for forming a Bitcoin spot ETF.

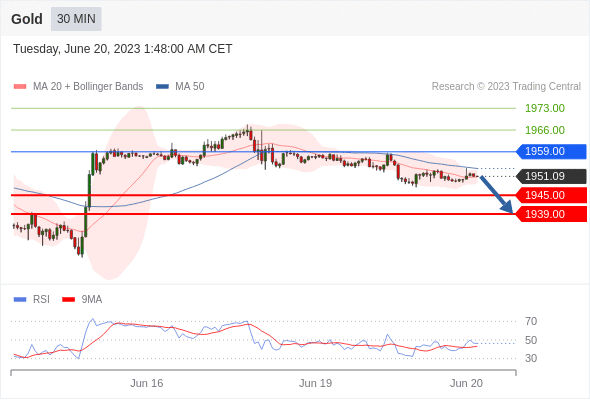
Gold Intraday: key resistance at 1959.00.
Pivot:
1959.00
Our preference:
Above 1959.00 look for further upside with 1966.00 & 1973.00 as targets.
Alternative scenario:
Below 1951.00 look for further downside with 1945.00 & 1939.00 as targets.
Comment:
As long as the resistance at 1959.00 is not surpassed, the risk of the break below 1945.00 remains high.

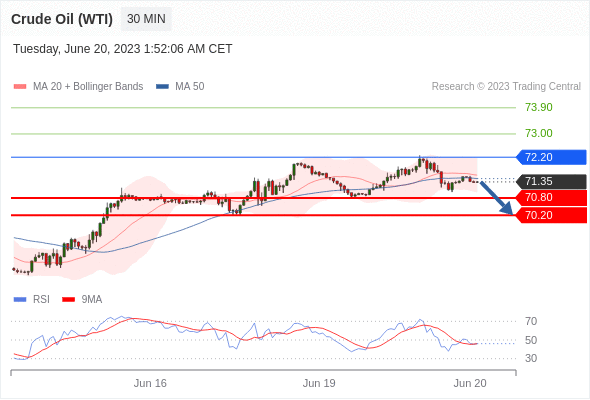
Crude Oil (WTI) (N3) Intraday: choppy.
Pivot:
72.20
Our preference:
Short positions below 72.20 with targets at 70.80 & 70.20 in extension.
Alternative scenario:
Above 72.20 look for further upside with 73.00 & 73.90 as targets.
Comment:
As long as 72.20 is resistance, look for choppy price action with a bearish bias.

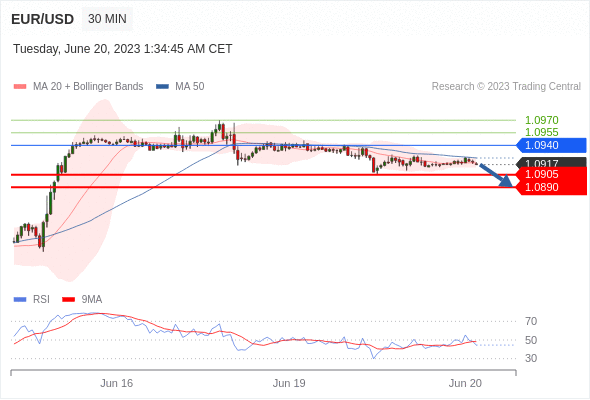
EUR/USD Intraday: watch 1.0890.
Pivot:
1.0940
Our preference:
Short positions below 1.0940 with targets at 1.0905 & 1.0890 in extension.
Alternative scenario:
Above 1.0940 look for further upside with 1.0955 & 1.0970 as targets.
Comment:
The RSI advocates for further downside.

Bitcoin / Dollar intraday: the upside prevails as long as 26280 is support
Our pivot point stands at 26280.
Our preference:
The upside prevails as long as 26280 is support.
Alternative scenario:
Below 26280, expect 25910 and 25680.
Comment:
The RSI is above 50. The MACD is positive and above its signal line. The configuration is positive. Moreover, the price is trading above both its 20 and 50 period moving average (respectively at 26515 and 26464).

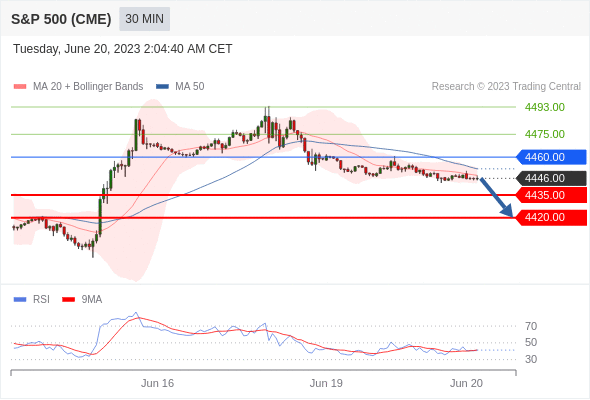
S&P 500 (CME) (M3) Intraday: key resistance at 4460.00.
Pivot:
4460.00
Our preference:
Short positions below 4460.00 with targets at 4435.00 & 4420.00 in extension.
Alternative scenario:
Above 4460.00 look for further upside with 4475.00 & 4493.00 as targets.
Comment:
The RSI is below its neutrality area at 50%

Tesla intraday: as long as 258.06 is support look for 266.18
Our pivot point stands at 258.06
Our preference:
as long as 258.06 is support look for 266.18
Alternative scenario:
Below 258.06, expect 254.9 and 253.02.
Comment:
The RSI is above its neutrality area at 50. The MACD is positive and below its signal line. The price could retrace. Tesla is trading above both its 20 and 50 period moving average (respectively at 259.41 and 258.19).

*Disclaimer: The content of this article is for learning purposes only and does not represent the official position of VSTAR, nor can it be used as investment advice.


.png)


