Here are today's directional views from the global research desks of Trading Central! These are starting points for your own research to identify opportunities that make sense for you. Like what you see? Feel free to forward this to a friend!

Market Wrap: Stocks, Bonds, Commodities
On Friday, U.S. stocks closed under pressure after the S&P 500 declined 33 points (-0.77%) to 4,348, the Nasdaq 100 dropped 150 points (-1.00%) to 14,891 and the Dow Jones Industrial Average fell 219 points (-0.65%) to 33,727.
The Automobiles & Components (-2.73%), Semiconductors & Semiconductor Equipment (-1.77%), and Utilities (-1.51%) sectors underperformed the most.
On the equity front, Tesla (TSLA), the electric-vehicle maker, lost 3.03% after it was downgraded to "sell" from "buy" at DZ Bank, while Under Armour (UAA), the athletic apparel company, declined 2.86% as it was downgraded to "equal-weight" from "overweight" at Wells Fargo.
In earnings news, Accenture (ACN), a leading global professional services company, dropped 2.87% after issuing a disappointing sales growth forecast, while CarMax (KMX), a car and light truck retail chain, jumped 10.07% after topping first-quarter earnings per share expectations.
On the economic data front, the S&P Global Manufacturing Purchasing Manager Index was reported at 46.3, below 48.7 initially expected, while the Services PMI was released at 54.1, above 53.0 estimated.
The U.S. 10-year treasury yield dropped 6 basis points to 3.735%.
European stocks were broadly lower. The Dax 40 fell 0.99%, the Cac 40 slid 0.55% and the FTSE 100 dropped 0.54%.
WTI crude futures slipped 0.5% to $69.16.
Spot gold was up $5.9 to $1,920.
Market Wrap: Forex
The U.S. dollar index gained 0.5% to 102.88.
EUR/USD fell 63 pips to 1.0893. In Europe, manufacturing purchasing managers index for the eurozone, Germany and France fell to their lowest level in more than a year in June and below expectations. The eurozone declined to 43.6, the German one slid to 41.0, and France to 45.7.
GBP/USD dipped 31 pips to 1.2717. The U.K. manufacturing purchasing managers index slipped to 46.2 in June, slightly below 46.5 expected. Meanwhile, retail sales rose by 0.3% on month in May, compared with a decline of 0.3% expected.
USD/JPY jumped 65 pips to 143.76 and USD/CHF rose 22 pips to 0.8970.
AUD/USD dropped 77 pips to 0.6679, while USD/CAD added 34 pips to 1.3185.
Bitcoin advanced 2.6% to $30,884.

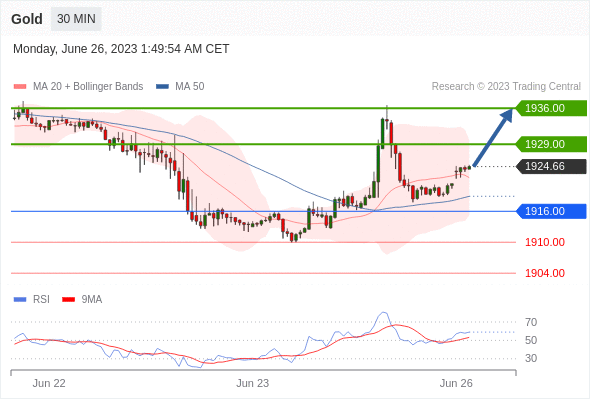
Gold Intraday: rebound expected.
Pivot:
1916.00
Our preference:
Long positions above 1916.00 with targets at 1929.00 & 1936.00 in extension.
Alternative scenario:
Long positions above 1916.00 with targets at 1929.00 & 1936.00 in extension.
Comment:
Long positions above 1916.00 with targets at 1929.00 & 1936.00 in extension.

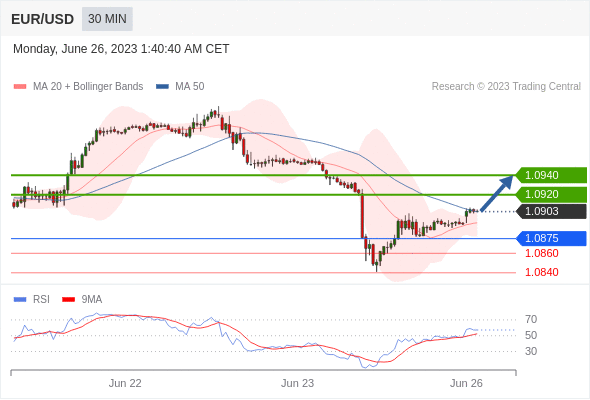
EUR/USD Intraday: towards 1.0940.
Pivot:
1.0875
Our preference:
Long positions above 1.0875 with targets at 1.0920 & 1.0940 in extension.
Alternative scenario:
Below 1.0875 look for further downside with 1.0860 & 1.0840 as targets.
Comment:
The RSI calls for a rebound.

Crude Oil (WTI) (Q3) Intraday: continuation of the rebound.
Pivot:
68.65
Our preference:
Long positions above 68.65 with targets at 70.90 & 71.60 in extension.
Alternative scenario:
Below 68.65 look for further downside with 68.10 & 67.35 as targets.
Comment:
The RSI advocates for further upside.

Bitcoin / Dollar intraday: below its lower Bollinger band
Our pivot point stands at 30730.
Our preference:
The downside prevails as long as 30730 is resistance.
Alternative scenario:
The upside breakout of 30730, would call for 31130 and 31370.
Comment:
The RSI is below its neutrality area at 50. The MACD is below its signal line and negative. The configuration is negative. Moreover, the price is trading under both its 20 and 50 period moving average (respectively at 30566 and 30631). Finally, the Bitcoin / Dollar is trading below its lower Bollinger band (standing at 30368).

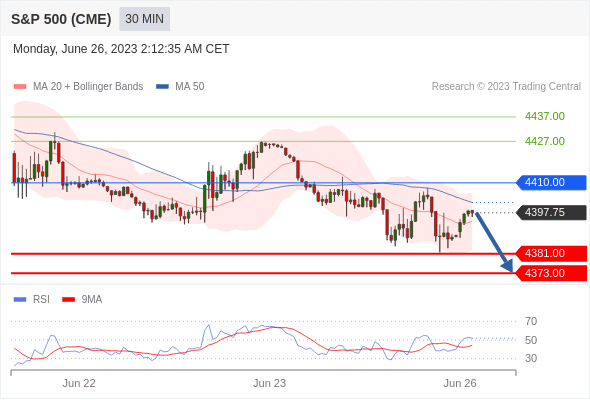
S&P 500 (CME) (M3) Intraday: consolidation.
Pivot:
4410.00
Our preference:
Short positions below 4410.00 with targets at 4381.00 & 4373.00 in extension.
Alternative scenario:
Above 4410.00 look for further upside with 4427.00 & 4437.00 as targets.
Comment:
As long as 4410.00 is resistance, look for choppy price action with a bearish bias.

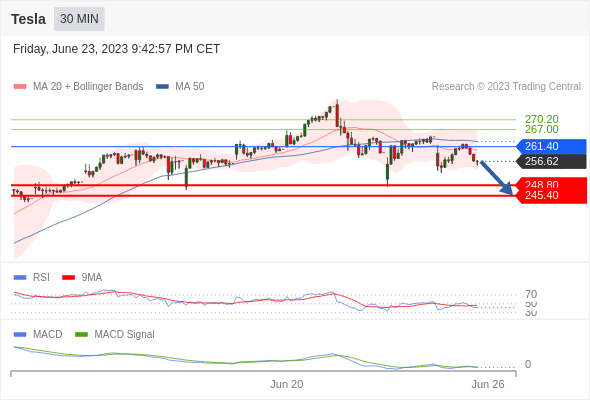
Tesla intraday:the downside prevails as long as 261.4 is resistance
Our pivot point stands at 275
Our preference:
The downside prevails as long as 261.4 is resistance.
Alternative scenario:
Above 261.4, look for 267 and 270.2.
Comment:
The RSI is below its neutrality area at 50. The MACD is below its signal line and negative. The configuration is negative. Tesla stands below its 20 and 50 period moving average (respectively at 260.27 and 263.07).

*Disclaimer: The content of this article is for learning purposes only and does not represent the official position of VSTAR, nor can it be used as investment advice.


.png)


