Here are today's directional views from the global research desks of Trading Central! These are starting points for your own research to identify opportunities that make sense for you. Like what you see? Feel free to forward this to a friend!

Market Wrap: Stocks, Bonds, Commodities
On Thursday, major U.S. stock indexes closed mixed. The Dow Jones Industrial Average rose 269 points (+0.80%) to 34,122, the S&P 500 climbed 19 points (+0.45%) to 4,396, while the Nasdaq 100 declined 24 points (-0.16%) to 14,939.
Banks (+2.62%), insurance (+1.50%), and materials (+1.27%) stock sectors were the top performers, while media (-0.81%) and food & staples retailing (-0.47%) stock sectors lagged behind.
Bank stocks rallied as major banks passed the Federal Reserve's annual stress test. JPMorgan Chase (JPM) rose 3.49%, Bank of America (BAC) climbed 2.10%, and Wells Fargo (WFC) gained 4.51%.
Occidental Petroleum (OXY) added 1.84% after Berkshire Hathaway Inc (BRKA) reported a higher stake of over 25% in the energy company.
On the other hand, Micron Technology (MU) fell 4.09%, Intel (INTC) dropped 1.97%, and Nvidia (NVDA) was down 0.72%.
Uber Technologies (UBER) slid 3.75% on reports that the company's chief executive sold 100,000 shares in the company.
Stronger-than-expected economic data raised expectations that the Federal Reserve would keep interest rates higher for longer. The latest number of initial jobless claims fell to 239,000 (vs 266,000 expected).
First-quarter gross domestic product growth was confirmed at an annualized rate of 2.0% (vs +1.3% previously estimated).
The U.S. 10-year Treasury yield jumped 13.3 basis points to 3.840%.
European stocks closed mixed. The DAX 40 was flat, while the CAC 40 rose 0.36%, and the FTSE 100 was down 0.38%.
U.S. WTI crude futures rose $0.30 to $69.86 a barrel.
Gold was little changed at $1,908 an ounce.
Market Wrap: Forex
The U.S. dollar index rose to a two-week high of 103.35.
EUR/USD declined 46 pips to 1.0867. Germany's inflation rate remained stable at 6.4% on year in June (as expected).
USD/JPY climbed 32 pips to 144.80. This morning, Japan's data showed that the jobless rate remained stable at 2.6% in May (as expected), and industrial production declined 1.6% on month (vs +0.1% expected).
Tokyo's core inflation rate was steady at 3.2% on year in June (as expected).
GBP/USD lost 24 pips to 1.2610.
AUD/USD added 19 pips to 0.6619.
USD/CHF gained 26 pips to 0.8995, while USD/CAD dipped 9 pips to 1.3249.
Bitcoin remained firm gaining over 1% to $30,500.

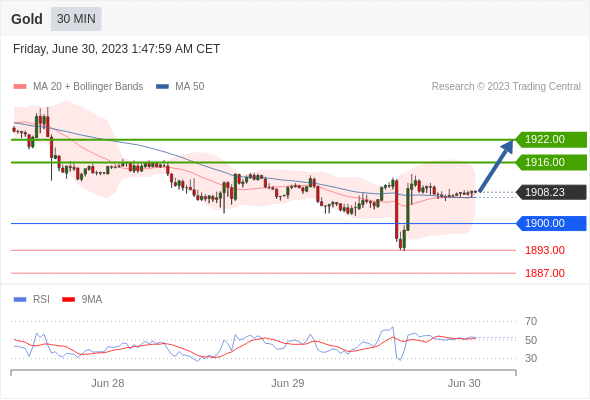
Gold Intraday: bullish bias above 1900.00.
Pivot:
1900.00
Our preference:
Long positions above 1900.00 with targets at 1916.00 & 1922.00 in extension.
Alternative scenario:
Below 1900.00 look for further downside with 1893.00 & 1887.00 as targets.
Comment:
The RSI calls for a rebound.

Crude Oil (WTI) (Q3) Intraday: intraday support around 69.10.
Pivot:
69.10
Our preference:
Long positions above 69.10 with targets at 70.60 & 71.20 in extension.
Alternative scenario:
Below 69.10 look for further downside with 68.40 & 67.70 as targets.
Comment:
The RSI is above its neutrality area at 50%.

EUR/USD Intraday: under pressure.
Pivot:
1.0895
Our preference:
Short positions below 1.0895 with targets at 1.0840 & 1.0820 in extension.
Alternative scenario:
Above 1.0895 look for further upside with 1.0910 & 1.0925 as targets.
Comment:
The RSI calls for a new downleg.

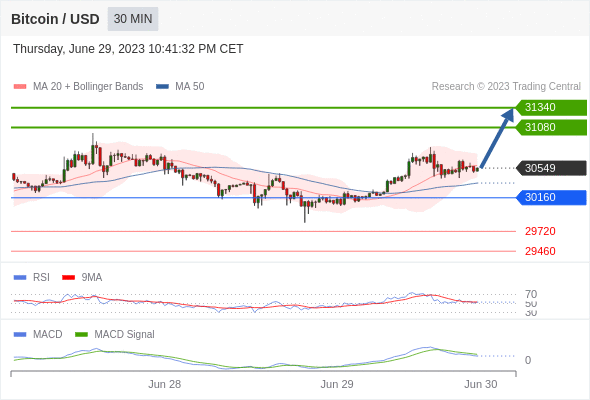
Bitcoin / Dollar intraday: as long as 30160 is support look for 31340
Our pivot point stands at 30160.
Our preference:
As long as 30160 is support look for 31340.
Alternative scenario:
Below 30160, expect 29720 and 29460.
Comment:
The RSI is above its neutrality area at 50. The MACD is below its signal line and positive. The price could retrace. Moreover, the price is trading under its 20 period moving average (30584) but above its 50 period moving average (30353).

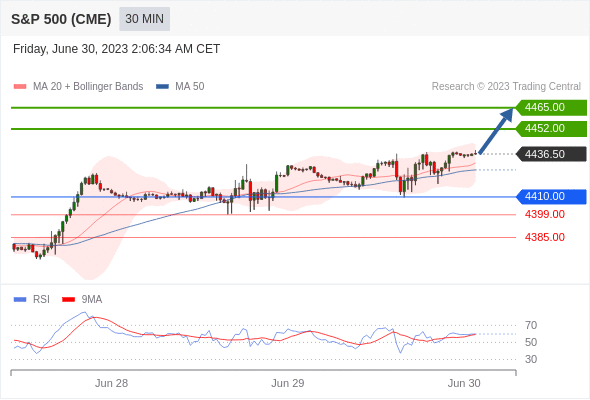
S&P 500 (CME) (M3) Intraday: look for 4465.00.
Pivot:
4410.00
Our preference:
Long positions above 4410.00 with targets at 4452.00 & 4465.00 in extension.
Alternative scenario:
Below 4410.00 look for further downside with 4399.00 & 4385.00 as targets.
Comment:
The RSI is bullish and calls for further upside.

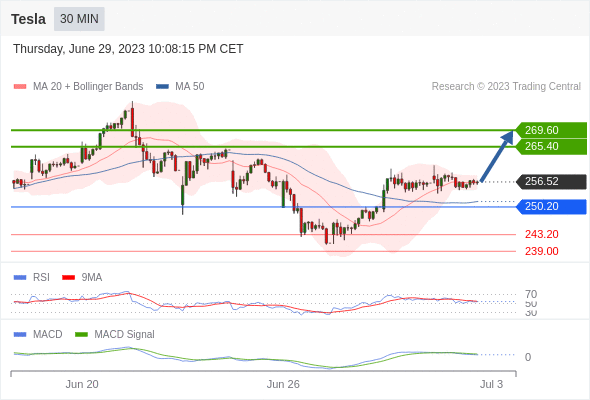
Tesla intraday: as long as 250.2 is support look for 269.6
Our pivot point stands at 250.2
Our preference:
As long as 250.2 is support look for 269.6
Alternative scenario:
Below 250.2, expect 243.2 and 239.
Comment:
The RSI is above 50. The MACD is below its signal line and positive. The price could retrace. Tesla is trading above both its 20 and 50 period moving average (respectively at 256.42 and 251.57).

*Disclaimer: The content of this article is for learning purposes only and does not represent the official position of VSTAR, nor can it be used as investment advice.


.png)


