


Here are today's directional views from the global research desks of Trading Central! These are starting points for your own research to identify opportunities that make sense for you. Like what you see? Feel free to forward this to a friend!

Market Wrap: Stocks, Bonds, Commodities
On Thursday, U.S. indices closed under pressure after recent ADP employment data was higher than previously forecasted, alarming investors of potentially greater-than-expected policy tightening by the Federal Reserve. The S&P 500 fell 35 points (-0.79%) to 4,411, the Nasdaq 100 slid 114 points (-0.75%) to 15,089 and the Dow Jones Industrial Average dropped 366 points (-1.07%) to 33,922.
The Energy (-2.45%) and Consumer Durables & Apparel (-1.93%) sectors led the decline, while the Technology Hardware & Equipment (+0.13%) and Software & Services (+0.13%) sectors outperformed.
Exxon Mobil (XOM), an oil and gas company , slid 3.73% after providing a second-quarter earnings guidance that missed estimates.
Meta Platforms (META), a social technology company, fell 0.81% after the company launched Threads, an app to rival Twitter. Alphabet (GOOGL), Google's holding company, lost 1.35% after delaying the release of its fully custom phone chip until 2025, according to The Information.
On the other hand, Keurig Dr Pepper (KDP) rose 1.42% after it was upgraded to "overweight" from "equal-weight" at Morgan Stanley.
On the U.S. economic data front, ADP employment soared by 497,000 in June, well above 160,000 estimated, while the ISM Services Purchasing Managers Index was released at 53.9, compared to 50.0 expected.
Later today, investors would keep an eye on the nonfarm payrolls for June, with an increase of 250,000 expected, while jobless rate is estimated to be stable at 3.7%.
The U.S. 10-year Treasury Yield jumped 10 basis points to a 4-month high at 4.031%.
European stocks were broadly under pressure. The Dax 40 sank 2.57%, the Cac 40 plunged 3.13% and the FTSE 100 slid 2.17%.
WTI Crude Futures closed flat at $71.80. The Energy Information Administration reported that U.S. crude oil inventories dropped 1.51 million barrels for the week ending June 30.
Spot gold was down $5 to $1,911.
Market Wrap: Forex
The U.S. dollar index eased 0.2% to 103.14, despite surprisingly strong ADP employment data, as investors remained cautious ahead of the official nonfarm payrolls due later in the day.
EUR/USD rose 35 pips to 1.0889. The eurozone's retail sales were flat on month in May, compared with an estimated growth of 0.3%. Meanwhile, German factory orders rose 6.4% on month in May, above 1.5% expected.
GBP/USD gained 33 pips to 1.2737.
USD/JPY declined 53 pips to 144.13 and USD/CHF fell 33 pips to 0.8955.
AUD/USD dropped 30 pips to 0.6625, while USD/CAD rose 88 pips to 1.337. Canada's trade deficit totaled 3.44 billion Canadian dollars in May, compared with a surplus of 1.50 billion Canadian dollars expected. Later today, Canada's employment is anticipated to drop 10,000 in June, while jobless rate is expected to climb to 5.4%.
Bitcoin traded lower to $30,298.

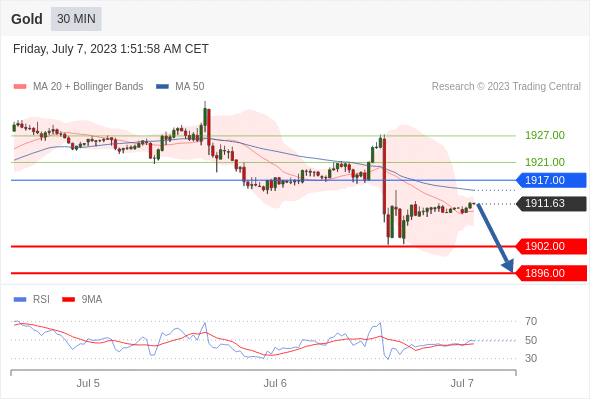
Gold Intraday: key resistance at 1917.00.
Pivot:
1917.00
Our preference:
Short positions below 1917.00 with targets at 1902.00 & 1896.00 in extension.
Alternative scenario:
Above 1917.00 look for further upside with 1921.00 & 1927.00 as targets.
Comment:
As long as the resistance at 1917.00 is not surpassed, the risk of the break below 1902.00 remains high.
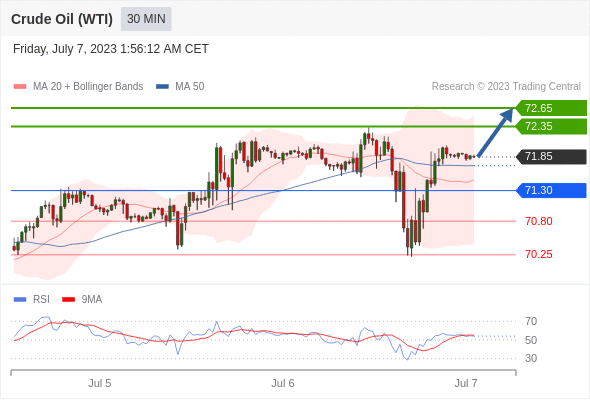
Crude Oil (WTI) (Q3) Intraday: intraday support around 71.30.
Pivot:
71.30
Our preference:
Long positions above 71.30 with targets at 72.35 & 72.65 in extension.
Alternative scenario:
Below 71.30 look for further downside with 70.80 & 70.25 as targets.
Comment:
The next resistances are at 72.35 and then at 72.65.
EUR/USD Intraday: further advance.
Pivot:
1.0865
Our preference:
Long positions above 1.0865 with targets at 1.0905 & 1.0925 in extension.
Alternative scenario:
Below 1.0865 look for further downside with 1.0850 & 1.0835 as targets.
Comment:
The RSI is bullish and calls for further upside.

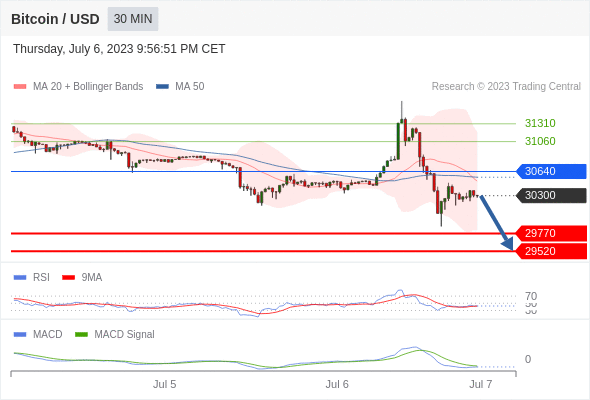
Bitcoin / Dollar intraday: the downside prevails as long as 30640 is resistance
Our pivot point stands at 30640.
Our preference:
The downside prevails as long as 30640 is resistance
Alternative scenario:
Above 30640, look for 31060 and 31310.
Comment:
The RSI is below 50. The MACD is negative and below its signal line. The configuration is negative. Moreover, the price is trading under both its 20 and 50 period moving average (respectively at 30505 and 30559).
S&P 500 (CME) (M3) Intraday: under pressure.
Pivot:
4466.00
Our preference:
Short positions below 4466.00 with targets at 4420.00 & 4400.00 in extension.
Alternative scenario:
Above 4466.00 look for further upside with 4480.00 & 4493.00 as targets.
Comment:
The RSI has just struck against its neutrality area at 50% and is reversing down.

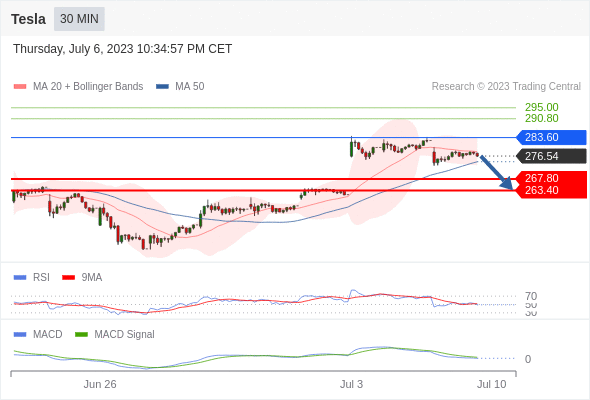
Tesla intraday: target 263.4
Our pivot point stands at 283.6
Our preference:
Target 263.4
Alternative scenario:
The upside breakout of 283.6, would call for 290.8 and 295.
Comment:
The RSI is below 50. The MACD is below its signal line and positive. The MACD must penetrate its zero line to expect further downside. Tesla is trading under its 20 period moving average (278.21) but above its 50 period moving average (274.37).
*Disclaimer: The content of this article is for learning purposes only and does not represent the official position of VSTAR, nor can it be used as investment advice.


.png)


