Here are today's directional views from the global research desks of Trading Central! These are starting points for your own research to identify opportunities that make sense for you. Like what you see? Feel free to forward this to a friend!

Market Wrap: Stocks, Bonds, Commodities
Following newly released jobs data, U.S. stocks finished under pressure on Friday after a strong rally during the morning part of the session that was quickly subsided in afternoon trading. The S&P 500 fell 12 points (-0.29%) to 4,398, the Nasdaq 100 declined 52 points (-0.35%) to 15,036 and the Dow Jones slid 187 points (-0.55%) to 33,734.
The Energy (+2.06%) and Banks (+0.97%) sectors were the top performers, while the Telecommunication Services (-2.04%) and Household & Personal Products (-1.86%) sectors underperformed the most.
Alibaba (BABA), the e-commerce giant, rose 8.00% as China's central bank announced a 71.23 billion yuan fine for the company's Ant Group, potentially signaling an end to the fintech sector rectification.
On the other hand, Levi Strauss & Co (LEVI), a designer and seller of a variety of clothing products, sank 7.73% after cutting full-year earnings guidance.
Humana (HUM), a health insurance provider, fell 2.46% as it was downgraded to "neutral" from "overweight" at JPMorgan. Also, Rivian Automotive (RIVN), the automotive technology company, surged 14.25% after the stock's price target was raised to $30 from $25 at Wedbush.
On the U.S. economic data front, nonfarm payrolls were released at 209,000 for June, against an expected increase of 250,000, while the unemployment rate fell to 3.6% in June, compared with 3.7% forecasted and 3.7% reported in May.
The U.S. 10-year Treasury Yield climbed 3.3 basis points to 4.062%.
The closing bell on Friday also saw European stocks closing mostly higher. The Dax 40 rose 0.48% and the Cac 40 gained 0.42%, while the FTSE 100 was down 0.32%.
WTI Crude Futures rose $2.06 to $73.86.
Spot Gold gained $14 to $1,925.
Market Wrap: Forex
The U.S. dollar index dropped 0.9% to 102.27, amid lower-than-expected nonfarm payrolls growth in June.
EUR/USD gained 77 pips to 1.0966. German industrial production fell 0.2% on month in May as expected.
GBP/USD jumped 95 pips to 1.2835. U.K. house prices slipped 0.1% on month in June as expected, according to Halifax.
USD/JPY plunged 196 pips to 142.11 and USD/CHF slid 59 pips to 0.8893.
AUD/USD rose 63 pips to 0.6689, while USD/CAD declined 91 pips to 1.3277. Official data showed that the Canadian economy added 59,900 jobs in June, well above 5,000 estimated, while jobless rate climbed to 5.4% as expected, from 5.2% in May. Also, Canada's Ivey purchasing managers index dropped to 50.2 in June from 53.5 in May, below 52.3 anticipated.
Bitcoin traded lower to $30,295.

Gold Intraday: the bias remains bullish.
Pivot:
1918.00
Our preference:
Long positions above 1918.00 with targets at 1934.00 & 1939.00 in extension.
Alternative scenario:
Below 1918.00 look for further downside with 1912.00 & 1904.00 as targets.
Comment:
Even though a continuation of the consolidation cannot be ruled out, its extent should be limited.

Crude Oil (WTI) (Q3) Intraday: intraday support around 72.70.
Pivot:
72.70
Our preference:
Long positions above 72.70 with targets at 74.40 & 75.10 in extension.
Alternative scenario:
Below 72.70 look for further downside with 72.25 & 71.45 as targets.
Comment:
The RSI is above its neutrality area at 50%.

EUR/USD Intraday: 1.1000 in sight.
Pivot:
1.0930
Our preference:
Long positions above 1.0930 with targets at 1.0980 & 1.1000 in extension.
Alternative scenario:
Below 1.0930 look for further downside with 1.0915 & 1.0900 as targets.
Comment:
The RSI advocates for further upside.

Bitcoin / Dollar intraday: the downside prevails as long as 30600 is resistance
Our pivot point stands at 30600.
Our preference:
The downside prevails as long as 30600 is resistance
Alternative scenario:
Above 30600, look for 31020 and 31270.
Comment:
The RSI is below 50. The MACD is negative and below its signal line. The configuration is negative. Moreover, the price stands below its 20 and 50 period moving average (respectively at 30300 and 30277).

S&P 500 (CME) (M3) Intraday: the downside prevails.
Pivot:
4450.00
Our preference:
Short positions below 4450.00 with targets at 4420.00 & 4400.00 in extension.
Alternative scenario:
Above 4450.00 look for further upside with 4466.00 & 4480.00 as targets.
Comment:
A break below 4420.00 would trigger a drop towards 4400.00.

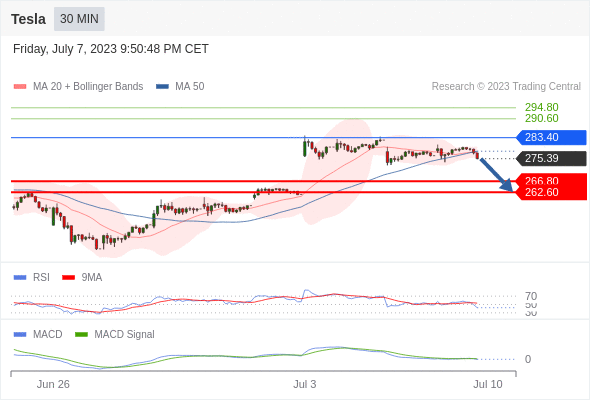
Tesla intraday: below its lower Bollinger band
Our pivot point stands at 283.4
Our preference:
Under pressure below 283.4.
Alternative scenario:
Above 283.4, look for 290.6 and 294.8.
Comment:
The RSI is below 50. The MACD is positive and below its signal line. The MACD must penetrate its zero line to expect further downside. Tesla stands below its 20 and 50 period moving average (respectively at 277.77 and 278.25). Finally, the Tesla has penetrated its lower Bollinger band (275.44).

*Disclaimer: The content of this article is for learning purposes only and does not represent the official position of VSTAR, nor can it be used as investment advice.


.png)


