Here are today's directional views from the global research desks of Trading Central! These are starting points for your own research to identify opportunities that make sense for you. Like what you see? Feel free to forward this to a friend!

Market Wrap: Stocks, Bonds, Commodities
On Thursday, U.S. stocks closed in positive territory, as the latest producer inflation data reinforced expectations that the Federal Reserve is nearing the end of rate hikes cycle. The S&P 500 rose 37 points (+0.85%) to 4,509, the Nasdaq 100 jumped 264 points (+1.73%) to 15,571 and the Dow Jones Industrial Average added 47 points (+0.14%) to 34,395.
The Media (+2.63%) and Semiconductors & Semiconductor Equipment (+2.62%) sectors were the top performers, while the Insurance (-1.4%) and Energy (-0.45%) sectors underperformed the most.
Alphabet (GOOGL) gained 4.72% after the tech giant's price target was raised to $140 from $135 at TD Cowen, and the company announced that its AI chatbot Bard is available in Europe and Brazil as well as accessible in over 40 languages.
Amazon.com (AMZN), the world's largest online retailer and web services provider, increased 2.68% as the company reported that consumers spent 12.7 billion dollars during its Prime Day sales in the U.S., which is a 6.1% growth compared to last year and the biggest Prime Day event ever.
Pepsico (PEP), the international beverage and food company, rose 2.38% after raising its full-year organic sales growth guidance to 10% from a previous guidance of 8%, while its second quarter earnings also topped expectations.
On the other hand, Progressive (PGR), an insurance company, plunged 13.12% after releasing second-quarter adjusted EPS and net premiums earned figures that missed estimates.
Also, Fastenal (FAST), a construction supplies distributor, declined 3.46% after reporting that second quarter EPS was up to 0.52 dollar, in-line with estimates, from 0.50 dollar a year earlier, on sales up 5.9% to 1.88 billion dollars.
Delta Air Lines (DAL), one of the world's largest airlines, fell 0.5% despite its upgrade of full-year adjusted EPS forecast.
On the U.S. economic data front, the producer prices index grew 0.1% year over year in June, against a growth of 0.4% anticipated and down from 0.9% in May. Meanwhile, weekly initial jobless claims for the week ended July 8 were released at 237,000, against 241,000 forecasted.
The U.S. 10-year Treasury Yield dropped 9.8 basis points to 3.76%.
European indexes extended their rallies for a fourth-consecutive session. The Dax 40 increased 0.74%, the Cac 40 rose 0.50% and the FTSE 100 gained 0.32%.
WTI Crude Futures rose $1.14 to $76.89, a fresh high since late April.
Spot gold was up $2.7 to $1,960.
Market Wrap: Forex
The U.S. dollar index was down from a sixth straight session, dropping 0.7% to 99.75, the lowest level since April last year.
EUR/USD climbed 99 pips to 1.1228. The eurozone's industrial production grew 0.2% in May, below 0.4% expected. Meanwhile, France's final reading of consumer price index was up 4.5% on year in June, as expected.
GBP/USD jumped 148 pips to 1.3136. The U.K. gross domestic producer was down 0.1% on month in May, vs -0.2% expected, while industrial production fell 0.6%, vs -0.2% expected. Also, the goods trade deficit totaled 18.7 billion pounds, against 15.4 billion pounds expected.
USD/JPY fell 46 pips to 138.04 and USD/CHF slid 87 pips to 0.8587, both posting a 6-day decline.
AUD/USD jumped 101 pips to 0.6888, while USD/CAD lost 76 pips to 1.3111.
Bitcoin advanced to $31,600.

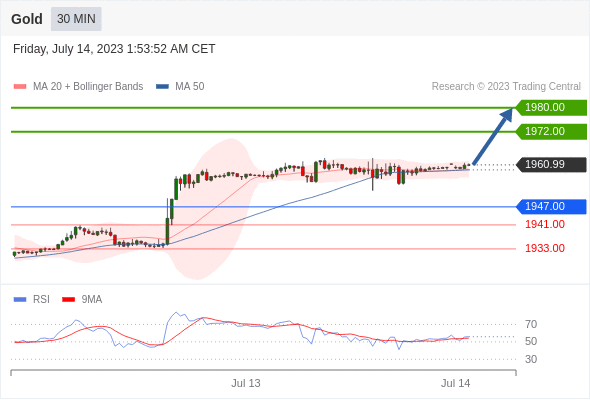
Gold Intraday: bullish bias above 1947.00.
Pivot:
1947.00
Our preference:
Long positions above 1947.00 with targets at 1972.00 & 1980.00 in extension.
Alternative scenario:
Below 1947.00 look for further downside with 1941.00 & 1933.00 as targets.
Comment:
The immediate trend remains up but the momentum is weak.
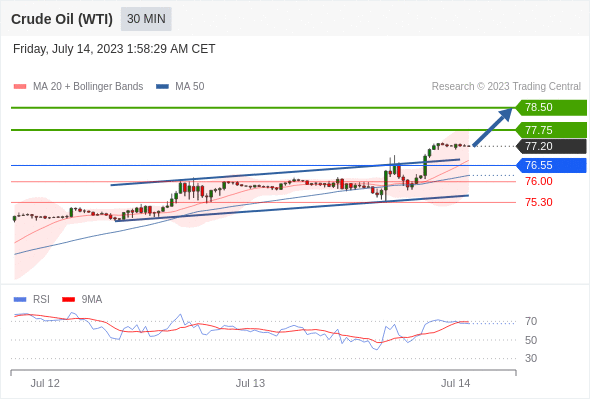
Crude Oil (WTI) (Q3) Intraday: bullish bias above 76.55.
Pivot:
76.55
Our preference:
Long positions above 76.55 with targets at 77.75 & 78.50 in extension.
Alternative scenario:
Below 76.55 look for further downside with 76.00 & 75.30 as targets.
Comment:
The break above the resistance at 76.55 triggered an upward acceleration to 77.75.
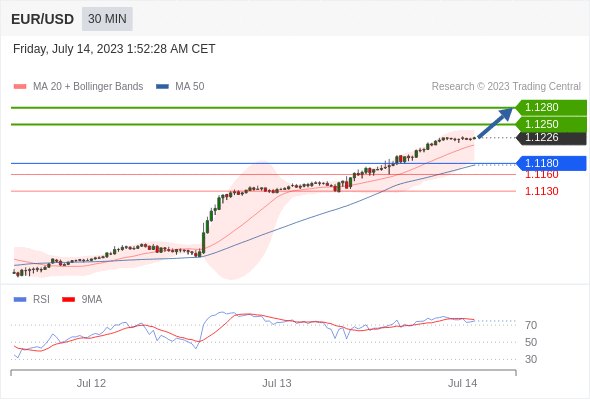
EUR/USD Intraday: further advance.
Pivot:
1.1180
Our preference:
Long positions above 1.1180 with targets at 1.1250 & 1.1280 in extension.
Alternative scenario:
Below 1.1180 look for further downside with 1.1160 & 1.1130 as targets.
Comment:
The RSI is bullish and calls for further upside.
Bitcoin / Dollar intraday: the RSI is overbought
Our pivot point stands at 31190.
Our preference:
The upside prevails as long as 31190 is support.
Alternative scenario:
The downside breakout of 31190 would call for 30760 and 30510.
Comment:
The RSI is above 70. It could mean either that the price is in a lasting uptrend or just overbought and therefore bound to correct (look for bearish divergence in this case). The MACD is above its signal line and positive. The configuration is positive. Moreover, the price is above its 20 and 50 period moving average (respectively at 30851 and 30558). Finally, the Bitcoin / Dollar has crossed above its upper Bollinger band (31589).

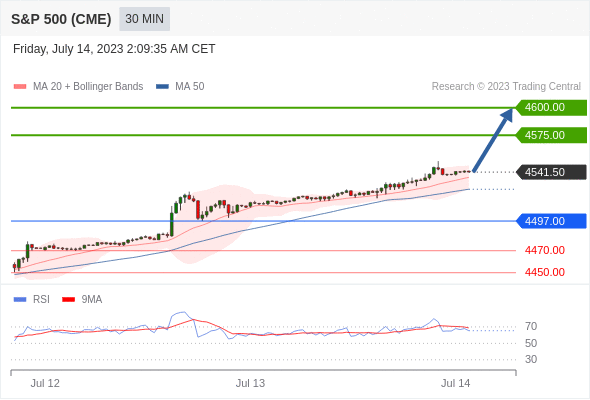
S&P 500 (CME) (M3) Intraday: intraday support around 4497.00.
Pivot:
4497.00
Our preference:
Long positions above 4497.00 with targets at 4575.00 & 4600.00 in extension.
Alternative scenario:
Below 4497.00 look for further downside with 4470.00 & 4450.00 as targets.
Comment:
The next resistances are at 4575.00 and then at 4600.00.
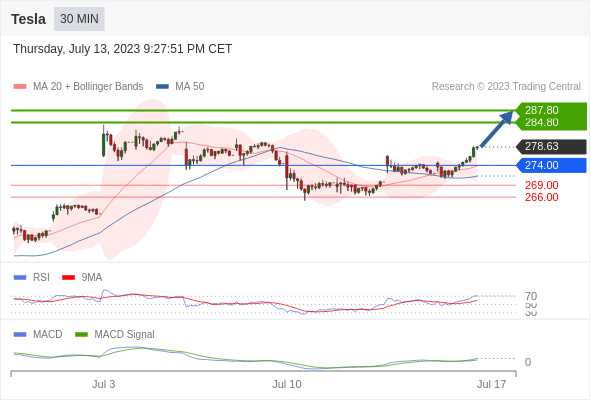
Tesla intraday: above its upper Bollinger band
Our pivot point stands at 274
Our preference:
The upside prevails as long as 274 is support.
Alternative scenario:
Below 274, expect 269 and 266.
Comment:
The RSI is trading above 70. This could mean that either prices are in a lasting uptrend or just overbought and that therefore a correction could shape (look for bearish divergence in this case). The MACD is above its signal line and positive. The configuration is positive. Tesla is trading above both its 20 and 50 period moving average (respectively at 273.86 and 271.3). Finally, the Tesla has crossed above its upper Bollinger band (277.9).
*Disclaimer: The content of this article is for learning purposes only and does not represent the official position of VSTAR, nor can it be used as investment advice.


.png)


