


Here are today's directional views from the global research desks of Trading Central! These are starting points for your own research to identify opportunities that make sense for you. Like what you see? Feel free to forward this to a friend!

Market Wrap: Stocks, Bonds, Commodities
On Friday, major U.S. stock indexes closed mixed. The Dow Jones Industrial Average gained 113 points (+0.33%) to 34,509, while the S&P 500 declined 4 points (-0.10%) to 4,505, and the Nasdaq 100 dipped 6.38 points (-0.04%) to 15,565.
Regarding U.S. economic data, the University of Michigan consumer sentiment index rose to 72.6 in July (vs 64.5 expected), the highest level since September 2021.
Import prices tumbled 6.1% on year in June, the biggest annual drop since May 2020.
Meanwhile, the U.S. 10-year Treasury yield climbed 6.3 basis points to 3.826%.
Health-care equipment & services (+2.32%), pharmaceuticals & biotechnology (+0.89%), and automobiles (+0.79%) stock sectors emerged as the top performers, while energy (-2.75%), telecoms services (-2.29%), and semiconductors (-1.00%) sectors underperformed the market.
UnitedHealth (UNH) jumped 7.24%. The private health insurance provider posted upbeat second-quarter sales and earnings.
Microsoft (MSFT) ended with a modest gain of 0.75%. The software giant was upgraded to "buy" at UBS.
On the other hand, Citigroup (C) fell 4.05% as the bank's quarterly results missed expectations.
Also, State Street (STT), an investment services firm, plunged 12.08%.
Alcoa (AA) dropped 5.91%. The major American aluminum producer was downgraded to "neutral" at JPMorgan.
AT&T (T) sank 4.10%. The major U.S. wireless communication carrier was downgraded to "neutral" at JPMorgan.
European stocks also closed mixed. The DAX 40 fell 0.22%, the FTSE 100 dipped 0.08%, while the CAC 40 edged up 0.06%.
U.S. WTI crude futures dropped $1.70 to $75.24 a barrel.
Gold fell $5 to $1,955 an ounce.
Market Wrap: Forex
The U.S. dollar index showed sign of stabilization after sinking for six sessions, but was still below the key level of 100.00.
EUR/USD was little changed at 1.1226, GBP/USD retreated 43 pips to 1.3093.
USD/JPY rebounded 81 pips to 138.86 halting a six-session losing streak.
AUD/USD slipped 55 pips to 0.6834.
USD/CHF climbed 35 pips to 0.8623, and USD/CAD jumped 113 pips to 1.3223.
Bitcoin saw volatile trading, as it once advanced to $31,645 before reversing course to slide to $30,330.

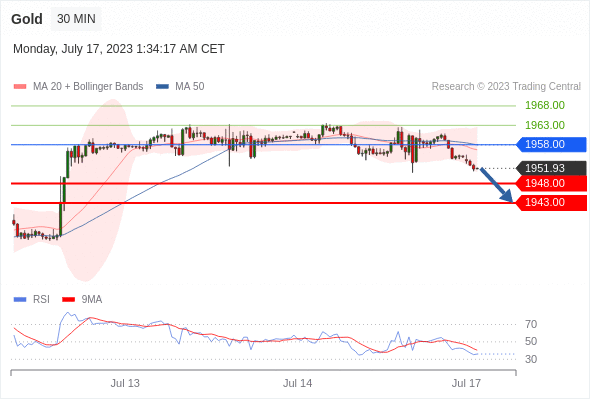
Gold Intraday: towards 1943.00.
Pivot:
1958.00
Our preference:
Short positions below 1958.00 with targets at 1948.00 & 1943.00 in extension.
Alternative scenario:
Above 1958.00 look for further upside with 1963.00 & 1968.00 as targets.
Comment:
The RSI is bearish and calls for further downside.
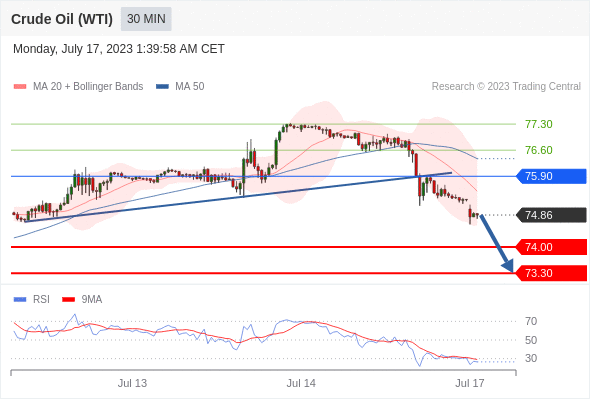
Crude Oil (WTI) (Q3) Intraday: the downside prevails.
Pivot:
75.90
Our preference:
Short positions below 75.90 with targets at 74.00 & 73.30 in extension.
Alternative scenario:
Above 75.90 look for further upside with 76.60 & 77.30 as targets.
Comment:
The RSI has broken down its 30 level.
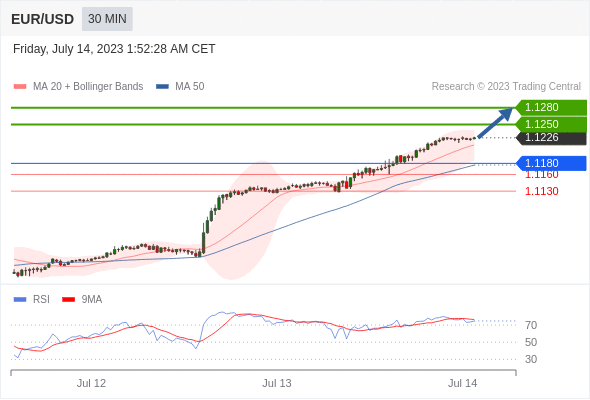
EUR/USD Intraday: bullish bias above 1.1205.
Pivot:
1.1205
Our preference:
Long positions above 1.1205 with targets at 1.1245 & 1.1265 in extension.
Alternative scenario:
Below 1.1205 look for further downside with 1.1180 & 1.1160 as targets.
Comment:
Even though a continuation of the consolidation cannot be ruled out, its extent should be limited.
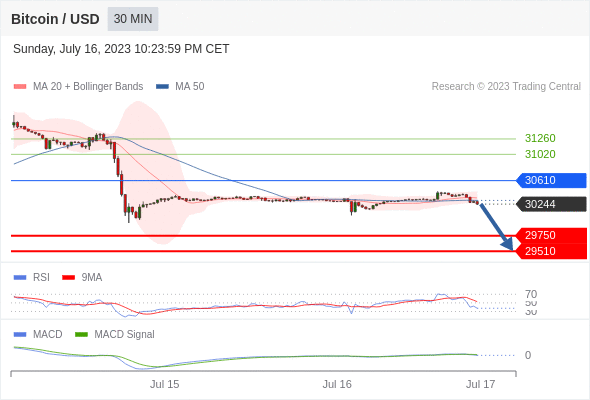
Bitcoin / Dollar intraday: under pressure below 30610
Our pivot point stands at 30610.
Our preference:
Under pressure below 30610
Alternative scenario:
Above 30610, look for 31020 and 31260.
Comment:
The RSI is below its neutrality area at 50. The MACD is positive and below its signal line. The MACD must penetrate its zero line to expect further downside. Moreover, the price stands below its 20 and 50 period moving average (respectively at 30341 and 30302).
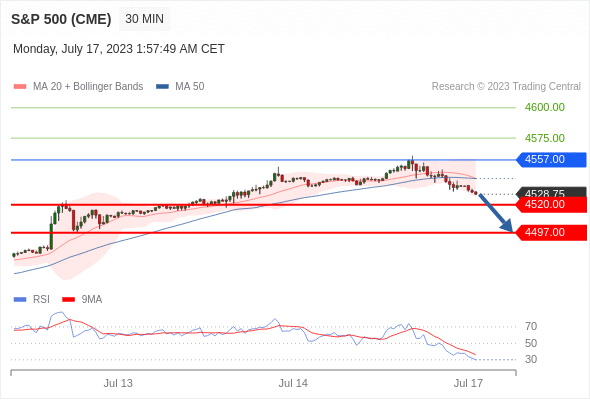
S&P 500 (CME) (U3) Intraday: the downside prevails.
Pivot:
4557.00
Our preference:
Short positions below 4557.00 with targets at 4520.00 & 4497.00 in extension.
Alternative scenario:
Above 4557.00 look for further upside with 4575.00 & 4600.00 as targets.
Comment:
The RSI has broken down its 30 level.
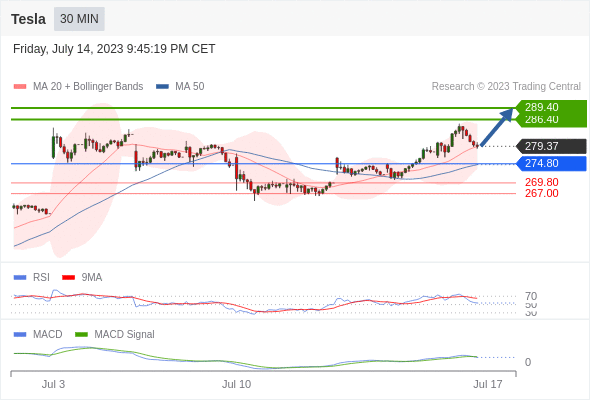
Tesla intraday: as long as 274.8 is support look for 289.4
Our pivot point stands at 274.8
Our preference:
As long as 274.8 is support look for 289.4
Alternative scenario:
The downside breakout of 274.8 would call for 269.8 and 267.
Comment:
The RSI is above its neutrality area at 50. The MACD is positive and below its signal line. The price could retrace. Tesla is trading above both its 20 and 50 period moving average (respectively at 279.3 and 274.58).
*Disclaimer: The content of this article is for learning purposes only and does not represent the official position of VSTAR, nor can it be used as investment advice.


.png)


