Here are today's directional views from the global research desks of Trading Central! These are starting points for your own research to identify opportunities that make sense for you. Like what you see? Feel free to forward this to a friend!

Market Wrap: Stocks, Bonds, Commodities
On Thursday, U.S. stocks closed lower after a choppy session. The Dow Jones Industrial Average retreated 237 points (-0.67%) to 35,282 halting a 13-session rally, the longest one since 1987.
The S&P 500 fell 29 points (-0.64%) to 4,537, and the Nasdaq 100 ended 34 points lower (-0.22%) at 15,464.
The U.S. 10-year Treasury yield climbed back to level above 4%, as U.S. economic data came out stronger than expected. U.S. gross domestic product (GDP) growth accelerated to an annualized rate of 2.4% on quarter in the second quarter (vs +1.8% expected).
The latest number of initial jobless claims declined to 221,000 (vs 231,000 expected), and durable goods orders jumped 4.7% on month in June (vs +0.6% expected).
Automobiles (-2.62%), telecom services (-2.03%), and real estate (-1.90%) stock sectors lost the most.
Tesla (TSLA) fell 3.27%, Netflix (NFLX) dropped 2.25%, and Microsoft (MSFT) was down 2.09%.
Meta Platforms (META) rose 4.40%, and AbbVie (ABBV) gained 4.90%. Both companies posted upbeat quarterly results.
Ebay (EBAY) slumped 10.53%, Chipotle Mexican Grill (CMG) sank 9.81%, and Southwest Airlines (LUV) dropped 8.94%. These companies' quarterly results missed market expectations.
In after-market hours, Intel (INTC) jumped over 7% after the chip-maker's second-quarter results showed a return to profitability after two straight quarters of losses.
European stocks closed higher. The DAX 40 rose 1.70%, the CAC 40 gained 2.05%, and the FTSE 100 was up 0.21%.
U.S. WTI crude futures added $1.10 to $79.85 a barrel.
Gold price tumbled $27 to $1,944 an ounce.
Market Wrap: Forex
Backed by strong economic data, the U.S. dollar regained some strength against other major currencies. The dollar index rebounded to 101.79.
EUR/USD plunged 117 pips to 1.0969, even though the European Central Bank raised its key interest rate by 25 basis points, as widely expected, to 3.75%.
Germany's GfK consumer confidence index ticked higher to -24.4 for August (vs -24.0 expected).
USD/JPY declined 82 pips to 139.42. Later today the Bank of Japan is expected to maintain its ultra-loose monetary-policy stance (key interest rate at negative -0.100%).
GBP/USD slid 151 pips to 1.2790.
AUD/USD fell 54 pips to 0.6704.
USD/CHF gained 89 pips to 0.8697, and USD/CAD rose 23 pips to 1.3231.
Bitcoin failed to rebound further, and slipped back to $29,160.

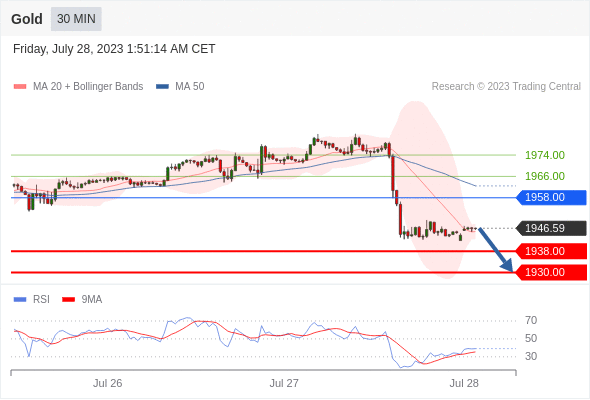
Gold Intraday: under pressure.
Pivot:
1958.00
Our preference:
Short positions below 1958.00 with targets at 1938.00 & 1930.00 in extension.
Alternative scenario:
Above 1958.00 look for further upside with 1966.00 & 1974.00 as targets.
Comment:
The RSI is bearish and calls for further decline.
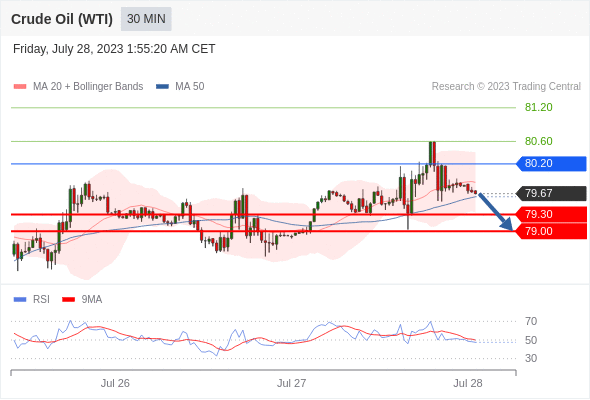
Crude Oil (WTI) (Q3) Intraday: consolidation in place.
Pivot:
80.20
Our preference:
Short positions below 80.20 with targets at 79.30 & 79.00 in extension.
Alternative scenario:
Above 80.20 look for further upside with 80.60 & 81.20 as targets.
Comment:
As long as 80.20 is resistance, expect a return to 79.30.
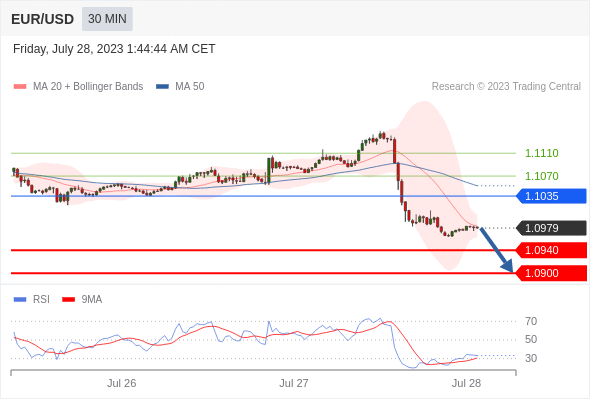
EUR/USD Intraday: under pressure.
Pivot:
1.1035
Our preference:
Short positions below 1.1035 with targets at 1.0940 & 1.0900 in extension.
Alternative scenario:
Above 1.1035 look for further upside with 1.1070 & 1.1110 as targets.
Comment:
The RSI is bearish and calls for further downside.
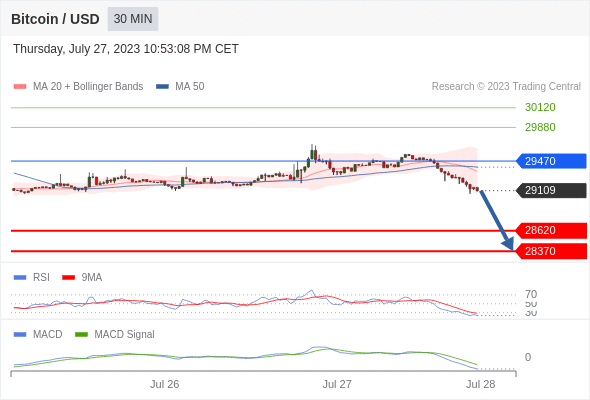
Bitcoin / Dollar intraday: the RSI is oversold
Our pivot point stands at 29470.
Our preference:
he downside prevails as long as 29470 is resistance.
Alternative scenario:
Above 29470, look for 29880 and 30120.
Comment:
The RSI is trading below 30. This could mean that either the price is in a lasting downtrend or just oversold and that therefore a rebound could shape (look for bullish divergence in this case). The MACD is negative and below its signal line. The configuration is negative. Moreover, the price is trading under both its 20 and 50 period moving average (respectively at 29342 and 29396).
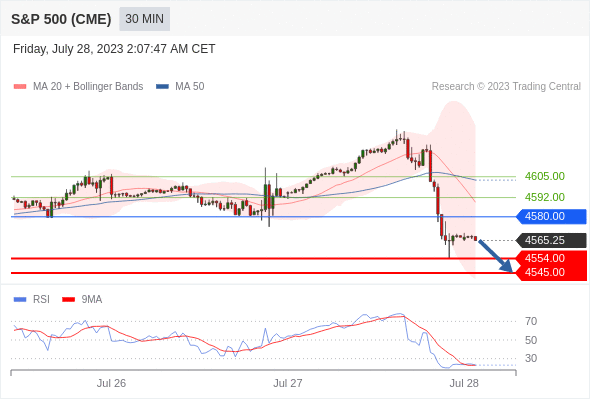
S&P 500 (CME) (U3) Intraday: under pressure.
Pivot:
4590.00
Our preference:
Short positions below 4580.00 with targets at 4554.00 & 4545.00 in extension.
Alternative scenario:
Above 4580.00 look for further upside with 4592.00 & 4605.00 as targets.
Comment:
The RSI has broken down its 30 level.
Tesla intraday: below its lower Bollinger band
Our pivot point stands at 263.6
Our preference:
The downside prevails as long as 263.6 is resistance.
Alternative scenario:
The upside breakout of 263.6, would call for 270.6 and 274.8.
Comment:
The RSI is below 50. The MACD is negative and below its signal line. The configuration is negative. Tesla stands below its 20 and 50 period moving average (respectively at 263.62 and 265.86). Finally, the Tesla has penetrated its lower Bollinger band (258).

*Disclaimer: The content of this article is for learning purposes only and does not represent the official position of VSTAR, nor can it be used as investment advice.


.png)


