Here are today's directional views from the global research desks of Trading Central! These are starting points for your own research to identify opportunities that make sense for you. Like what you see? Feel free to forward this to a friend!

Market Wrap: Stocks, Bonds, Commodities
On Monday, U.S. stocks ended slightly higher at the last trading day of July. The Dow Jones Industrial Average rose 100 points (+0.28%) to 35,559, the S&P 500 gained 6 points (+0.15%) to 4,588, and the Nasdaq 100 was up 6 points (+0.04%) to 15,757.
Energy (+2.00%), consumer durables & apparel (+0.75%), and retailing (+0.72%) stock sectors gained the most.
Palantir Technologies (PLTR), a data mining company, surged another 11.40% after jumping 10% in the prior session.
Exxon Mobil (XOM) rose 2.96%. According to Bloomberg News, the energy company is in talks with automakers including Tesla (TSLA) and Ford Motor (F) on supplying them with lithium.
Johnson & Johnson (JNJ) fell 3.98%. A judge dismissed the bankruptcy case of the pharmaceutical firm's unit, making the company face claims of billions of dollars related to its baby powder products.
After posting quarterly results, SoFi Technologies (SOFI) surged 19.9%, and ON Semiconductor (ON) climbed 2.53%.
Chevron (CVX) rose 3.02% as the stock was upgraded to "buy" at Goldman Sachs.
Adobe (ADBE) increased 3.27% after being upgraded to "overweight" at Morgan Stanley.
XPeng (XPEV) slumped 10.56% after it was downgraded to "neutral" at UBS.
The U.S. 10-year Treasury yield added 1.4 basis points to 3.965%.
Regarding U.S. economic data, the Chicago purchasing managers index climbed to 42.8 in July (vs 43.0 expected), and the Dallas Fed manufacturing Index improved to -20 (vs -18 expected).
In Europe, the DAX 40 declined 0.14%, while the CAC 40 rose 0.28%, and the FTSE 100 edged up 0.07%.
U.S. WTI crude futures rose 1.63% to $81.89 a barrel, a fresh three-month high.
Gold price increased $6 to $1,965 an ounce.
Market Wrap: Forex
EUR/USD dropped 21 pips to 1.0995. The Eurozone's data showed that gross domestic product grew 0.6% on year in the second quarter (as expected), the inflation rate slowed to 5.3% on year in July (vs 5.2% expected).
Germany's retail sales fell 0.8% on month in June (vs +0.0% expected).
USD/JPY rebounded 110 pips to 142.26. This morning, Japan's data showed that the jobless rate declined to 2.5% in June (vs 2.6% expected).
GBP/USD slid 15 pips to 1.2836.
AUD/USD increased 68 pips to 0.6718.
USD/CHF added 20 pips to 0.8718, while USD/CAD fell 45 pips to 1.3192.
Bitcoin kept going nowhere, trading at levels around $29,200.

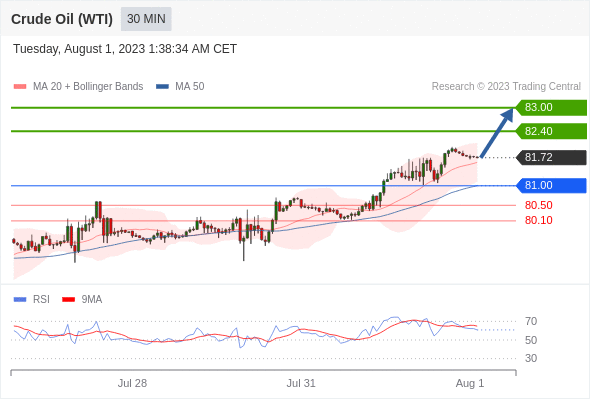
Crude Oil (WTI) (Q3) Intraday: watch 83.00.
Pivot:
81.00
Our preference:
Long positions above 81.00 with targets at 82.40 & 83.00 in extension.
Alternative scenario:
Below 81.00 look for further downside with 80.50 & 80.10 as targets.
Comment:
The RSI is bullish and calls for further upside.

EUR/USD Intraday: under pressure.
Pivot:
1.1025
Our preference:
Short positions below 1.1025 with targets at 1.0965 & 1.0940 in extension.
Alternative scenario:
Above 1.1025 look for further upside with 1.1050 & 1.1075 as targets.
Comment:
Technically the RSI is above its neutrality area at 50.

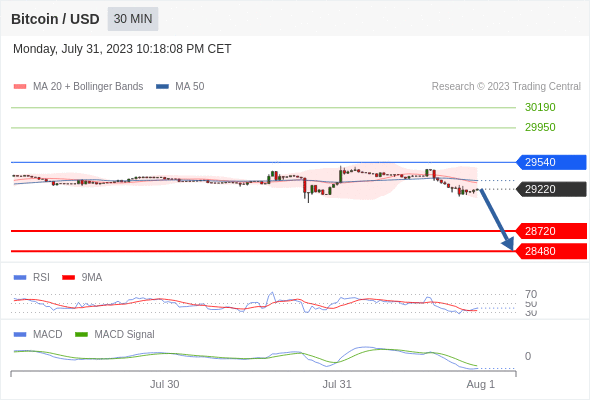
Bitcoin / Dollar intraday: the downside prevails as long as 29540 is resistance
Our pivot point stands at 29540.
Our preference:
The downside prevails as long as 29540 is resistance
Alternative scenario:
The upside breakout of 29540, would call for 29950 and 30190.
Comment:
The RSI is below 50. The MACD is negative and below its signal line. The configuration is negative. Moreover, the price stands below its 20 and 50 period moving average (respectively at 29296 and 29322).

Gold Intraday: bullish bias above 1956.00.
Pivot:
1956.00
Our preference:
Long positions above 1956.00 with targets at 1972.00 & 1981.00 in extension.
Alternative scenario:
Below 1956.00 look for further downside with 1949.00 & 1942.00 as targets.
Comment:
The next resistances are at 1972.00 and then at 1981.00.

S&P 500 (CME) (U3) Intraday: towards 4650.00.
Pivot:
4590.00
Our preference:
Long positions above 4590.00 with targets at 4634.00 & 4650.00 in extension.
Alternative scenario:
Below 4590.00 look for further downside with 4575.00 & 4558.00 as targets.
Comment:
The RSI advocates for further advance.

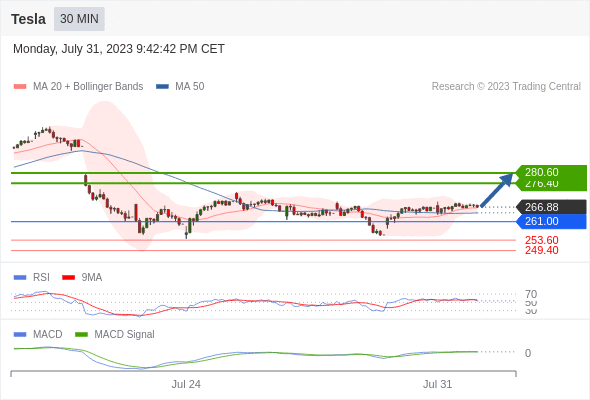
Tesla intraday: the upside prevails as long as 261 is support
Our pivot point stands at 259.54
Our preference:
The upside prevails as long as 261 is support
Alternative scenario:
Below 261, expect 253.6 and 249.4.
Comment:
The RSI is above 50. The MACD is positive and above its signal line. The configuration is positive. Tesla is trading above both its 20 and 50 period moving average (respectively at 266.54 and 264.55).

*Disclaimer: The content of this article is for learning purposes only and does not represent the official position of VSTAR, nor can it be used as investment advice.


.png)


