Here are today's directional views from the global research desks of Trading Central! These are starting points for your own research to identify opportunities that make sense for you. Like what you see? Feel free to forward this to a friend!

Market Wrap: Stocks, Bonds, Commodities
On Thursday, major U.S. stock indexes pared most of their gains seen earlier in the session to close slightly higher. The Dow Jones Industrial Average rose 52 points (+0.15%) to 35,176, the S&P 500 added 1 point (+0.03%) to 4,468, and the Nasdaq 100 was up 27 points (+0.18%) to 15,128.
U.S. data showed that the inflation rate ticked up to 3.2% on year in July, compared to 3.1% expected and 3.0% in June. The latest number of initial jobless claims increased to 248,000 (vs 229,000 expected).
Meanwhile, the U.S. 10-year Treasury yield rebounded 8.6 basis points to 4.094%.
Consumer services (+0.6%) and media (+0.45%) stock sectors ended higher, while consumer durables & apparel (-1.59%), capital goods (-0.45%), and semiconductors (-0.39%) sectors were under pressure.
Walt Disney (DIS) rose 4.88%. The entertainment and media giant posted better-than-expected quarterly earnings, and announced plans to raise prices of its Disney+ video-streaming services.
General Motors (GM) fell 5.79%, and Ford Motor (F) dropped 4.48%, as investors feared that demands from unions could send the car-makers' labor costs soaring.
Tapestry (TPR), the parent company of luxury clothing & accessories brand Coach, said it has agreed to acquire Capri Holdings (CPRI), the owner of brand Michael Kors, in an $8.5 billion deal. Tapestry's share price plunged 15.93%, while Capri Holdings surged 55.74%.
Alibaba (BABA) gained 4.60%, as the Chinese e-commerce giant's quarterly sales exceeded expectations.
European stocks also closed higher. The DAX 40 rose 0.91%, the CAC 40 climbed 1.52%, and the FTSE 100 was up 0.41%.
U.S. WTI crude futures retreated $1.50 to $82.88 a barrel.
Gold price declined $2 to $1,912 an ounce.
Market Wrap: Forex
The U.S. dollar held onto its recent strength. The dollar index climbed to 102.65.
USD/JPY jumped 105 pips to 144.78, the highest level since July 3.
EUR/USD added 7 pips to 1.0981.
GBP/USD dropped 42 pips to 1.2677. In the U.K., the Royal Institute of Chartered Surveyors house price index declined to -53% in July (vs -48% expected).
AUD/USD edged down 6 pips to 0.6522.
USD/CHF dipped 5 pips to 0.8768, while USD/CAD rose 23 pips to 1.3442.
Bitcoin traded slightly lower to $29,440.

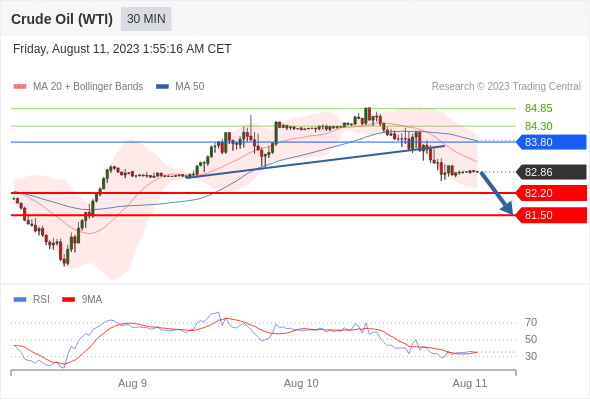
Crude Oil (WTI) (Q3) Intraday: look for 81.50.
Pivot:
83.80
Our preference:
Short positions below 83.80 with targets at 82.20 & 81.50 in extension.
Alternative scenario:
Above 83.80 look for further upside with 84.30 & 84.85 as targets.
Comment:
The RSI is below its neutrality area at 50%
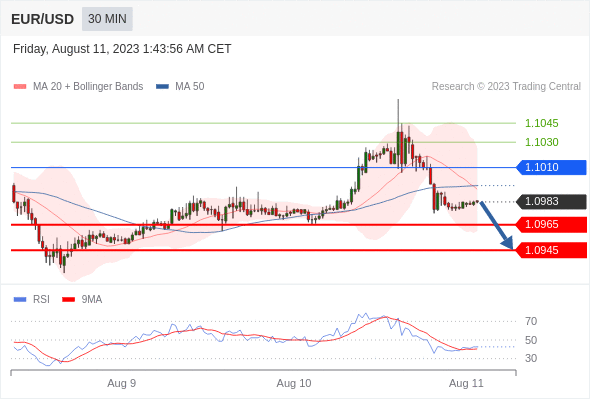
EUR/USD Intraday: the downside prevails.
Pivot:
1.1010
Our preference:
Short positions below 1.1010 with targets at 1.0965 & 1.0945 in extension.
Alternative scenario:
Above 1.1010 look for further upside with 1.1030 & 1.1045 as targets.
Comment:
The RSI calls for a new downleg.
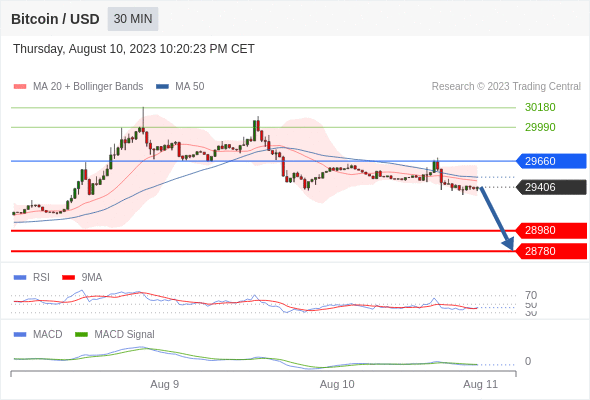
Bitcoin / Dollar intraday: the downside prevails as long as 29660 is resistance
Our pivot point stands at 29660.
Our preference:
The downside prevails as long as 29660 is resistance
Alternative scenario:
The upside breakout of 29660, would call for 29990 and 30180.
Comment:
The RSI is below 50. The MACD is below its signal line and negative. The configuration is negative. Moreover, the price stands below its 20 and 50 period moving average (respectively at 29467 and 29503).
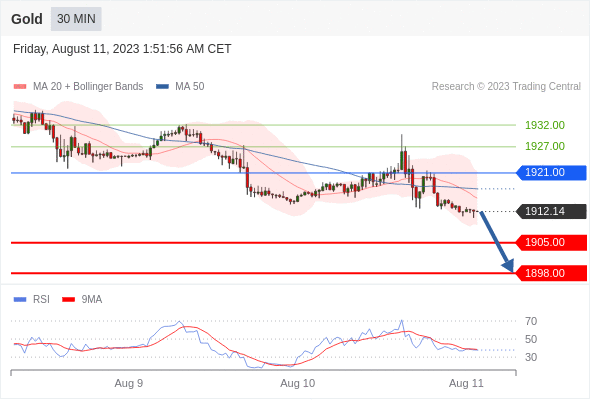
Gold Intraday: under pressure.
Pivot:
1921.00
Our preference:
Short positions below 1921.00 with targets at 1905.00 & 1898.00 in extension.
Alternative scenario:
Above 1921.00 look for further upside with 1927.00 & 1932.00 as targets.
Comment:
The RSI is bearish and calls for further decline.
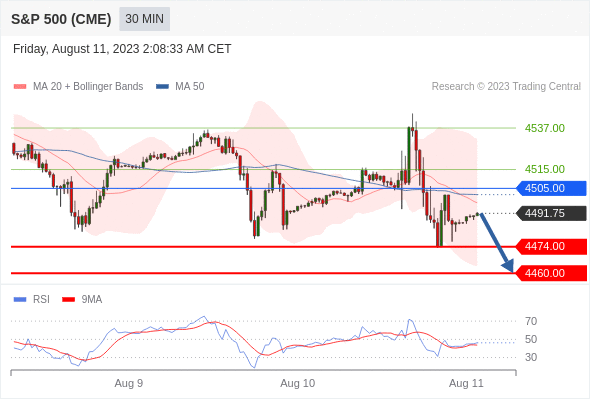
S&P 500 (CME) (U3) Intraday: the downside prevails.
Pivot:
4505.00
Our preference:
Short positions below 4505.00 with targets at 4474.00 & 4460.00 in extension.
Alternative scenario:
Above 4505.00 look for further upside with 4515.00 & 4537.00 as targets.
Comment:
The RSI is below its neutrality area at 50%
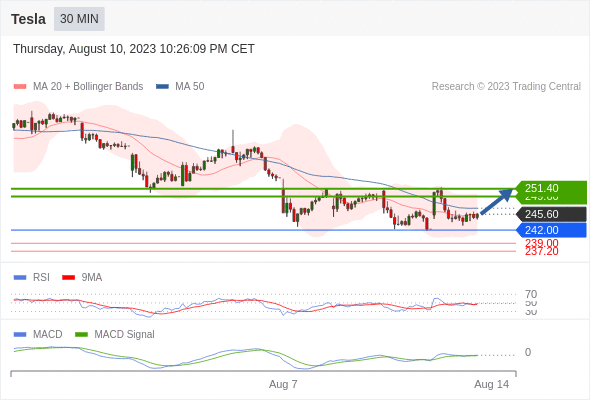
Tesla intraday: short term rebound towards 251.4
Our pivot point stands at 242
Our preference:
Short term rebound towards 251.4
Alternative scenario:
The downside breakout of 242 would call for 239 and 237.2.
Comment:
The RSI is below its neutrality area at 50. The MACD is above its signal line and negative. The configuration is mixed. Tesla stands below its 20 and 50 period moving average (respectively at 245.62 and 246.96).
*Disclaimer: The content of this article is for learning purposes only and does not represent the official position of VSTAR, nor can it be used as investment advice.


.png)


