


Here are today's directional views from the global research desks of Trading Central! These are starting points for your own research to identify opportunities that make sense for you. Like what you see? Feel free to forward this to a friend!

Market Wrap: Stocks, Bonds, Commodities
On Friday, U.S. stocks were mixed as the S&P 500 fell 4 points (-0.11%) to 4,464 and the Nasdaq 100 declined 100 points (-0.67%) to 15,028, while the Dow Jones Industrial Average rose 105 points (+0.3%) to 35,281.
The Energy (+1.56%) and Telecommunication Services (+1.01%) sectors were the top performers, while the Semiconductors & Semiconductor Equipment (-2.56%) and Automobiles & Components (-1.14%) sectors underperformed the most during the trading session.
Nvidia (NVDA), a leading designer of graphics processors, fell 3.62% after Cathie Wood's Ark Invest sold more shares of the semiconductor company. Peer Advanced Micro Devices (AMD), a producer of microprocessors, also fell 2.41% during the trading session.
News Corp (NWS), a media conglomerate, rose 4.73% after posting a quarterly earnings beat.
On the U.S. economic data front, the producer prices index increased 0.8% on year in July, above 0.7% expected, while the Michigan Consumer Sentiment Index dropped to 71.2 in August, below 71.3 estimated.
The U.S. 10-year Treasury Yield gained 5.3 basis points to 4.158%.
European stocks were under pressure. The Dax 40 fell 1.03%, the Cac 40 slid 1.26% and the FTSE 100 dropped 1.24%.
WTI Crude Future (September) rose $0.37 (+0.45%) to $83.19.
Spot gold was broadly flat at $1,913.
Market Wrap: Forex
The U.S. dollar index rose 0.3% to 102.85.
EUR/USD slid 32 pips to 1.0949. France's final readings of consumer price index for July was up 4.3% on year, as expected, while the jobless rate for the second quarter edged up to 7.2%, in-line with estimates.
GBP/USD increased 25 pips to 1.2701. U.K. gross domestic product grew 0.2% on year in the second quarter, above 0.1% expected, while industrial production was up 1.8% on month in June, against 0.1% expected. Also, goods trade deficit in June amounted to 15.46 billion pounds, compared to 17.20 billion pounds estimated.
USD/JPY gained 19 pips to 144.94, while USD/CHF fell 4 pips to 0.8764.
AUD/USD dropped 21 pips to 0.6494, while USD/CAD was little changed at 1.3448.
Bitcoin traded lower to $29,377.

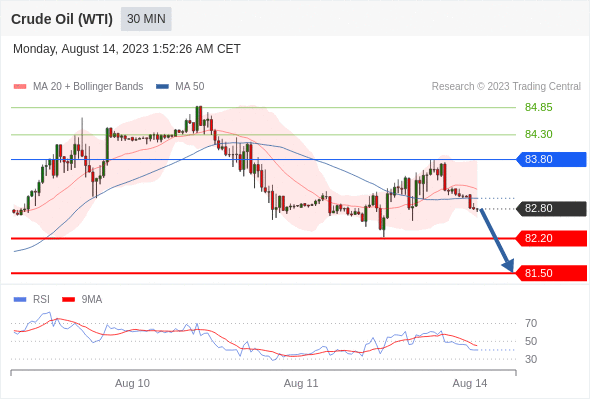
Crude Oil (WTI) (Q3) Intraday: look for 81.50.
Pivot:
83.80
Our preference:
Short positions below 83.80 with targets at 82.20 & 81.50 in extension.
Alternative scenario:
Above 83.80 look for further upside with 84.30 & 84.85 as targets.
Comment:
The RSI calls for a drop.
EUR/USD Intraday: 1.0900 in sight.
Pivot:
1.0975
Our preference:
Short positions below 1.0975 with targets at 1.0920 & 1.0900 in extension.
Alternative scenario:
Above 1.0975 look for further upside with 1.0990 & 1.1005 as targets.
Comment:
The RSI is bearish and calls for further decline.

Bitcoin / Dollar intraday: above its upper Bollinger band
Our pivot point stands at 29130.
Our preference:
The upside prevails as long as 29130 is support.
Alternative scenario:
The downside breakout of 29130 would call for 28810 and 28610.
Comment:
The RSI is above 50. The MACD is positive and above its signal line. The configuration is positive. Moreover, the price is trading above both its 20 and 50 period moving average (respectively at 29373 and 29390). Finally, the Bitcoin / Dollar has crossed above its upper Bollinger band (29411).

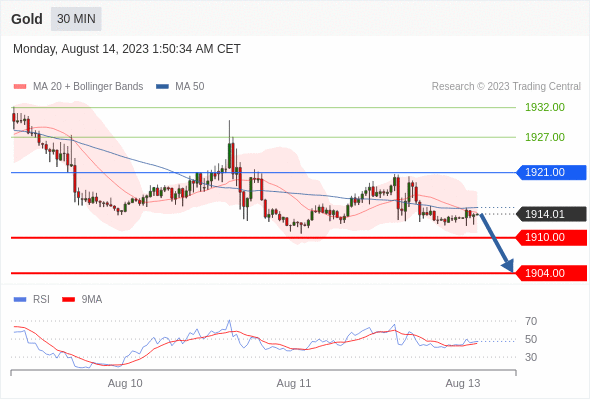
Gold Intraday: the downside prevails.
Pivot:
1921.00
Our preference:
Short positions below 1921.00 with targets at 1910.00 & 1904.00 in extension.
Alternative scenario:
Above 1921.00 look for further upside with 1927.00 & 1932.00 as targets.
Comment:
As long as the resistance at 1921.00 is not surpassed, the risk of the break below 1910.00 remains high.
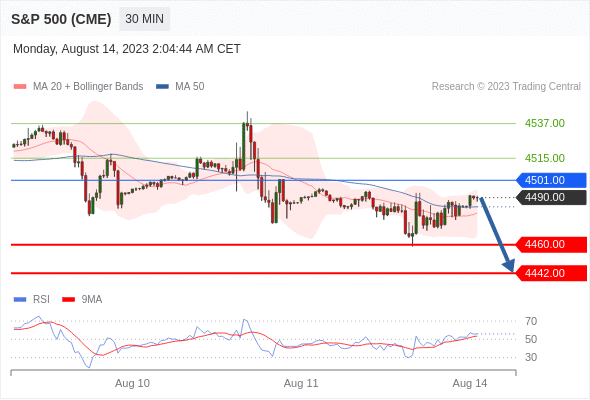
S&P 500 (CME) (U3) Intraday: choppy.
Pivot:
4501.00
Our preference:
Short positions below 4501.00 with targets at 4460.00 & 4442.00 in extension.
Alternative scenario:
Above 4501.00 look for further upside with 4515.00 & 4537.00 as targets.
Comment:
Intraday technical indicators are mixed and call for caution.
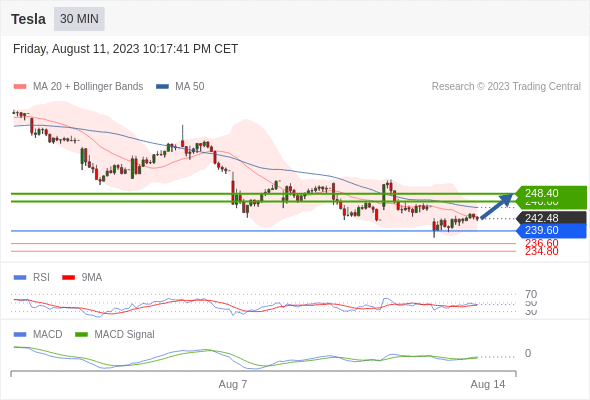
Tesla intraday: short term rebound towards 248.4
Our pivot point stands at 239.6
Our preference:
Short term rebound towards 248.4
Alternative scenario:
Below 239.6, expect 236.6 and 234.8.
Comment:
The RSI is below its neutrality area at 50. The MACD is above its signal line and negative. The configuration is mixed. Tesla is trading under both its 20 and 50 period moving average (respectively at 242.97 and 245.15).
*Disclaimer: The content of this article is for learning purposes only and does not represent the official position of VSTAR, nor can it be used as investment advice.


.png)


