


Here are today's directional views from the global research desks of Trading Central! These are starting points for your own research to identify opportunities that make sense for you. Like what you see? Feel free to forward this to a friend!

Market Wrap: Stocks, Bonds, Commodities
On Thursday, U.S. stocks closed in negative territory for a third consecutive trading session amid growing concerns on additional Fed rate hikes. The S&P 500 slid 34 points (-0.77%) to 4,370, the Nasdaq 100 declined 161 points (-1.08%) to 14,715 and the Dow Jones Industrial Average slid 291 points (-0.84%) to 34,474.
The Automobiles & Components (-2.31%), Consumer Durables & Apparel (-2.28%), and Health Care Equipment & Services (-1.98%) sectors underperformed the most during the trading session.
Mega-cap companies suffered heavy losses, Meta Platforms (META), a social technology company, slid 3.13% and Tesla (TSLA), the electric-vehicle maker, dropped 2.83%.
In earnings news, Walmart (WMT), the retail giant, fell 2.24% despite posting quarterly earnings above expectations and raising full-year adjusted EPS guidance.
Cisco Systems (CSCO), a leading global supplier of network hardware and software, rose 3.34% after posting fourth-quarter top and bottom-line figures that beat estimates.
Wolfspeed (WOLF), a leader in Silicon Carbide technology, plunged 17.06% as its quarterly loss was wider than expected.
On the U.S. economic data front, initial jobless claims for the week ended August 12 were posted at 239,000, against 241,000 expected and 250,000 in the prior week. Meanwhile, the Philadelphia Fed Manufacturing Index jumped to 12 in August from -13.5 in July, above -8.0 forecasted. Also, the Leading Index dropped 0.4% on month in July, as anticipated.
The U.S. 10-year Treasury Yield climbed for a sixth consecutive day, gaining 3.2 basis points to 4.282%.
European stocks were broadly lower. The Dax 40 fell 0.71%, the Cac 40 slid 0.94% and the FTSE 100 dropped 0.63%.
WTI Crude Futures (September) rebounded $1.01 to $80.39, following a 3-day decline.
Spot gold was down for a fourth straight session, dropping $3 to $1,889.
Market Wrap: Forex
The U.S. dollar index was relatively stable at 103.42.
EUR/USD dipped 7 pips to 1.0872. The eurozone's trade surplus for June was released at 23 billion euros, against 600 million euros expected.
GBP/USD added 13 pips to 1.2745. Later today, U.K. retail sales are expected to be down 0.3% on month in July.
USD/JPY lost 55 pips to 145.80 and USD/CHF fell 16 pips to 0.8784.
AUD/USD dropped 21 pips to 0.6403. The Australian economy shed 14,600 jobs in July, compared with an expected increase of 25,100, while the jobless rate climbed to 3.7%, above 3.5% estimated.
USD/CAD rose 12 pips to 1.3545. Canada's producer prices index for July, due later in the day, is estimated to drop 3.1% on year.
Bitcoin sank to its lowest level in nearly 2 months at $25,166.

Crude Oil (WTI) (U3) Intraday: 79.45 expected.
Pivot:
80.60
Our preference:
Short positions below 80.60 with targets at 79.45 & 78.90 in extension.
Alternative scenario:
Above 80.60 look for further upside with 81.10 & 81.90 as targets.
Comment:
The RSI calls for a drop.

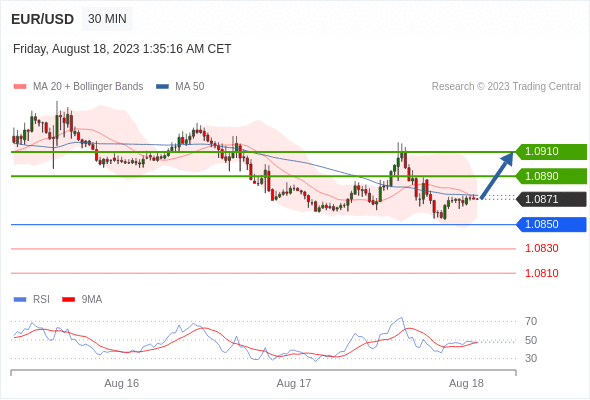
EUR/USD Intraday: bullish bias above 1.0850.
Pivot:
1.0850
Our preference:
Long positions above 1.0850 with targets at 1.0890 & 1.0910 in extension.
Alternative scenario:
Below 1.0850 look for further downside with 1.0830 & 1.0810 as targets.
Comment:
Even though a continuation of the consolidation cannot be ruled out, its extent should be limited.
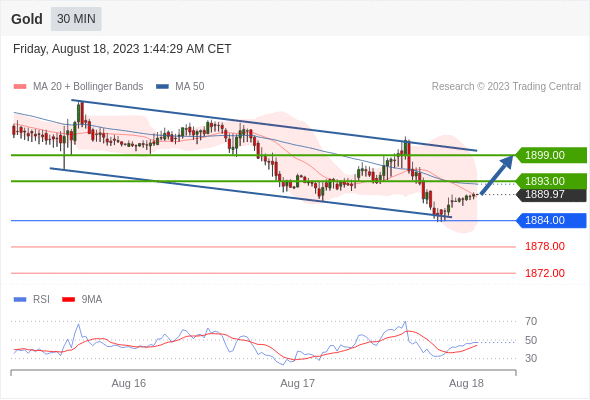
Gold Intraday: technical rebound in a bearish trend.
Pivot:
1884.00
Our preference:
Long positions above 1884.00 with targets at 1893.00 & 1899.00 in extension.
Alternative scenario:
Below 1884.00 look for further downside with 1878.00 & 1872.00 as targets.
Comment:
The RSI is posting a bullish divergence (not confirmed yet).
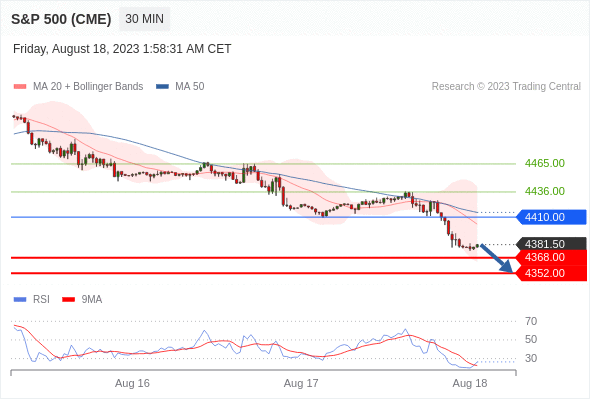
S&P 500 (CME) (U3) Intraday: under pressure.
Pivot:
4442.00
Our preference:
Short positions below 4410.00 with targets at 4368.00 & 4352.00 in extension.
Alternative scenario:
Above 4410.00 look for further upside with 4436.00 & 4465.00 as targets.
Comment:
A break below 4368.00 would trigger a drop towards 4352.00.
Tesla intraday: the RSI is oversold
Our pivot point stands at 223.2
Our preference:
The downside prevails as long as 223.2 is resistance.
Alternative scenario:
The upside breakout of 223.2, would call for 225.4 and 226.8.
Comment:
The RSI is below 30. It could either mean that prices are in a lasting downtrend or just oversold and therefore bound to retrace (look for bullish divergence in this case). The MACD is below its signal line and negative. The configuration is negative. Tesla is trading under both its 20 and 50 period moving average (respectively at 225.01 and 230.91). Finally, the Tesla is trading below its lower Bollinger band (standing at 219.71).

*Disclaimer: The content of this article is for learning purposes only and does not represent the official position of VSTAR, nor can it be used as investment advice.


.png)


