Here are today's directional views from the global research desks of Trading Central! These are starting points for your own research to identify opportunities that make sense for you. Like what you see? Feel free to forward this to a friend!
Market Wrap: Stocks, Bonds, Commodities
On Friday, U.S. stocks closed slightly higher. The Dow Jones Industrial Average rose 75 points (+0.22%) to 34,576, the S&P 500 gained 6 points (+0.14%) to 4,457, and the Nasdaq 100 was up 21 points (+0.14%) to 15,280.
The U.S. 10-year Treasury yield edged up 1 basis point to 4.254%.
Investors should be turning their focus to August U.S. inflation data to be released Wednesday.
Energy (+0.97%), utilities (+0.96%), and software & services (+0.79%) stock sectors gained the most, while telecoms services (-0.86%), automobiles (-0.77%), and semiconductors (-0.74%) lagged behind.
Kroger (KR) rose 3.10% to $46.94, and Albertsons Companies (ACI) gained 2.47% to $23.63. Both companies announced plans to sell 413 stores and 8 distribution centers to C&S Wholesale Grocers for $1.9 billion in cash, aiming to secure U.S. regulatory clearance for their proposed $24.5 billion merger.
Eli Lilly (LLY) gained 2.31% to $586.46. The pharmaceutical producer's diabetes drug Mounjaro was endorsed by U.K. National Institute for Health and Care Excellence.
RH (RH) plunged 15.63% to $310.95. The home furnishing retailer's third-quarter revenue forecast missed market expectations.
Gilead Sciences (GILD) rose 2.79% to $76.00. The biopharmaceutical firm was upgrade to "buy" at Bank of America.
European stocks also closed higher. The DAX 40 rose 0.14%, the CAC 40 gained 0.62%, and the FTSE 100 was up 0.49%.
U.S. WTI crude futures rose $0.64 to $87.51 a barrel.
Gold price was stable at $1,919 an ounce.

Market Wrap: Forex
The U.S. dollar index was flat at 105.05.
EUR/USD added 5 pips to 1.0701. France's data showed that industrial production grew 0.8% on month in July (vs no growth expected).
USD/JPY gained 50 pips to 147.80, the highest daily close since November.
GBP/USD dropped 10 pips to 1.2462.
AUD/USD was little changed at 0.6377.
USD/CHF edged up 2 pips to 0.8930.
USD/CAD slid 44 pips to 1.3641. Canada's jobless rate remained stable at 5.5% in August (vs 5.7% expected).
Bitcoin pulled back to $25,880.

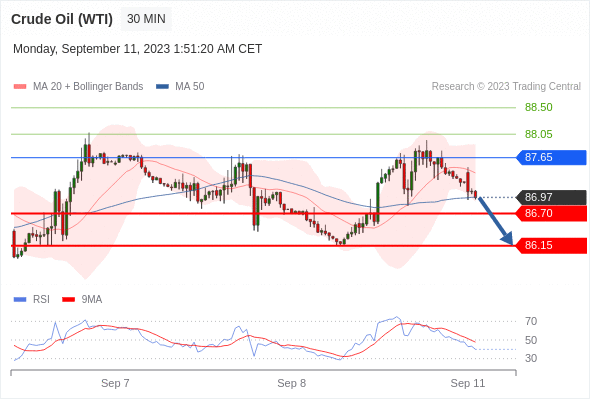
Crude Oil (WTI) (V3) Intraday: watch 86.15.
Pivot:
87.65
Our preference:
Short positions below 87.65 with targets at 86.70 & 86.15 in extension.
Alternative scenario:
Above 87.65 look for further upside with 88.05 & 88.50 as targets.
Comment:
As long as the resistance at 87.65 is not surpassed, the risk of the break below 86.70 remains high.
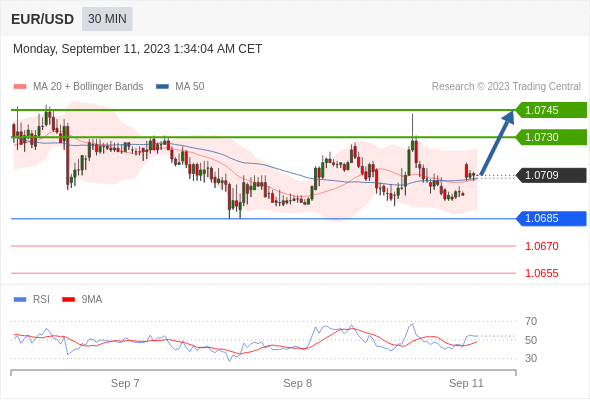
EUR/USD Intraday: the bias remains bullish.
Pivot:
1.0685
Our preference:
Long positions above 1.0685 with targets at 1.0730 & 1.0745 in extension.
Alternative scenario:
Below 1.0685 look for further downside with 1.0670 & 1.0655 as targets.
Comment:
The RSI calls for a bounce.
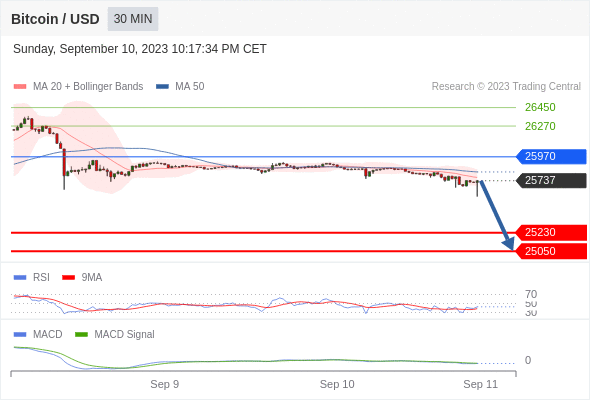
Bitcoin / Dollar intraday: the downside prevails as long as 25970 is resistance
Our pivot point stands at 25970.
Our preference:
The downside prevails as long as 25970 is resistance
Alternative scenario:
Above 25970, look for 26270 and 26450.
Comment:
The RSI is below 50. The MACD is negative and below its signal line. The configuration is negative. Moreover, the price stands below its 20 and 50 period moving average (respectively at 25769 and 25823).
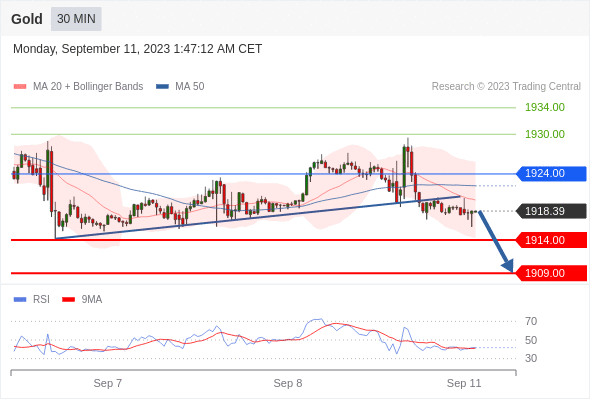
Gold Intraday: watch 1909.00.
Pivot:
1924.00
Our preference:
Short positions below 1924.00 with targets at 1914.00 & 1909.00 in extension.
Alternative scenario:
Above 1924.00 look for further upside with 1930.00 & 1934.00 as targets.
Comment:
The RSI advocates for further downside.
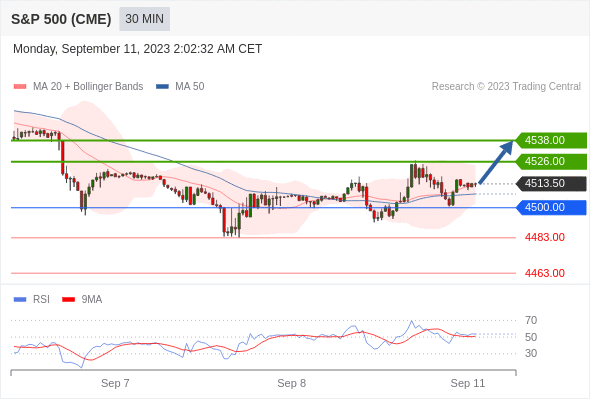
S&P 500 (CME) (U3) Intraday: intraday support around 4500.00.
Pivot:
4500.00
Our preference:
Long positions above 4500.00 with targets at 4526.00 & 4538.00 in extension.
Alternative scenario:
Below 4500.00 look for further downside with 4483.00 & 4463.00 as targets.
Comment:
The next resistances are at 4526.00 and then at 4538.00.
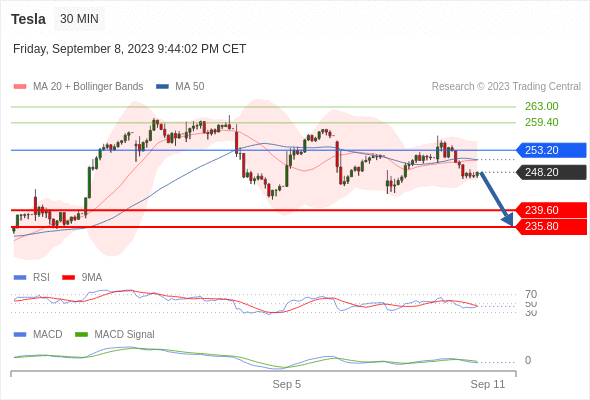
Tesla intraday: the downside prevails as long as 253.2 is resistance
Our pivot point stands at 253.2
Our preference:
The downside prevails as long as 253.2 is resistance
Alternative scenario:
The upside breakout of 253.2, would call for 259.4 and 263.
Comment:
The RSI is below 50. The MACD is below its signal line and negative. The configuration is negative. Tesla stands below its 20 and 50 period moving average (respectively at 250.81 and 251.06).
*Disclaimer: The content of this article is for learning purposes only and does not represent the official position of VSTAR, nor can it be used as investment advice.


.png)


