


Here are today's directional views from the global research desks of Trading Central! These are starting points for your own research to identify opportunities that make sense for you. Like what you see? Feel free to forward this to a friend!
Market Wrap: Stocks, Bonds, Commodities
On Tuesday, U.S. stocks came under pressure ahead of closely-watched inflation data to be released on Wednesday. The Dow Jones Industrial Average dipped 17 points (-0.05%) to 34,645, the S&P 500 fell 25.56 points (-0.57%) to 4,461, and the Nasdaq 100 slid 172 points (-1.11%) to 15,289.
The U.S. 10-year Treasury yield declined 1.6 basis points to 4.272%.
Energy (+2.31%), banks (+2.01%), and insurance (+0.90%) stock sectors did well during the session, while software & services (-2.51%), household & personal products (-2.00%), and automobiles (-1.54%) sectors los the most.
Apple (AAPL) fell 1.71% to $176.30 after the tech giant unveiled the new iPhone 15 model.
Oracle (ORCL) sank 13.5% to $109.61, as the software company reported slowing cloud sales growth in the second quarter.
RTX Corp (RTX) dropped 1.74% to $75.56 after losing nearly 8% in the prior session. The stock was downgraded to "equal-weight" at Barclays.
WestRock (WRK) gained 2.76% to $35.00. The packaging maker agreed to be acquired by Smurfit Kappa Group in an $11.2 billion deal.
Regarding U.S. economic data, the National Federation of Independent Business (NFIB) business optimism index ticked down to 91.3 in August (vs 91.7 expected).
European stocks closed mixed. The DAX 40 fell 0.54%, the CAC 40 dropped 0.35%, while the FTSE 100 rose 0.41%.
U.S. WTI crude futures added $1.60 to $88.89 a barrel, the highest close since November.
Gold price declined $9 to $1,913 an ounce.

Market Wrap: Forex
The U.S. dollar was stable against other major currencies, as investors awaited the latest reading on inflation. The dollar index stepped up to 104.73.
EUR/USD fell 15 pips to 1.0735. In Germany, the ZEW economic sentiment index posted at -11.4 for September (vs -14.0 expected, -12.3 in August).
GBP/USD dropped 16 pips to 1.2493. U.K. data showed that the latest jobless rate rose to 4.3% (vs 4.2% expected).
USD/JPY rebounded 54 pips to 147.13. This morning Japan's data showed that producer prices increased 3.2% on year in August (as expected).
AUD/USD dipped 8 pips to 0.6423.
USD/CHF added 7 pips to 0.8915, while USD/CAD slipped 15 pips to 1.3558.
Bitcoin rebounded over 3% to levels around $26,000.

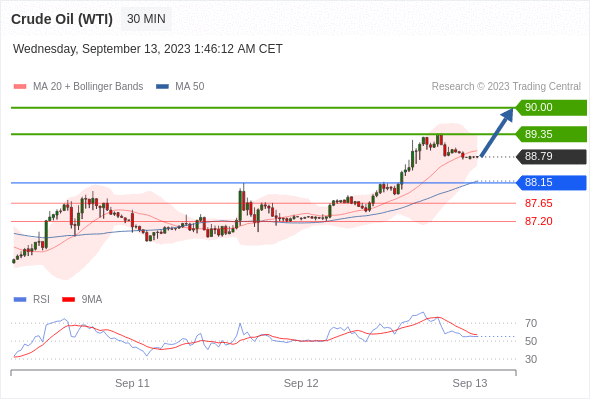
Crude Oil (WTI) (V3) Intraday: the bias remains bullish.
Pivot:
88.15
Our preference:
Long positions above 88.15 with targets at 89.35 & 90.00 in extension.
Alternative scenario:
Below 88.15 look for further downside with 87.65 & 87.20 as targets.
Comment:
Technically the RSI is above its neutrality area at 50.
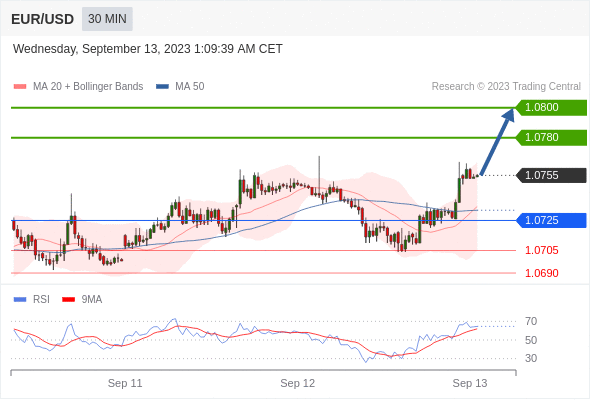
EUR/USD Intraday: continuation of the rebound.
Pivot:
1.0725
Our preference:
Long positions above 1.0725 with targets at 1.0780 & 1.0800 in extension.
Alternative scenario:
Below 1.0725 look for further downside with 1.0705 & 1.0690 as targets.
Comment:
The RSI is bullish and calls for further upside.
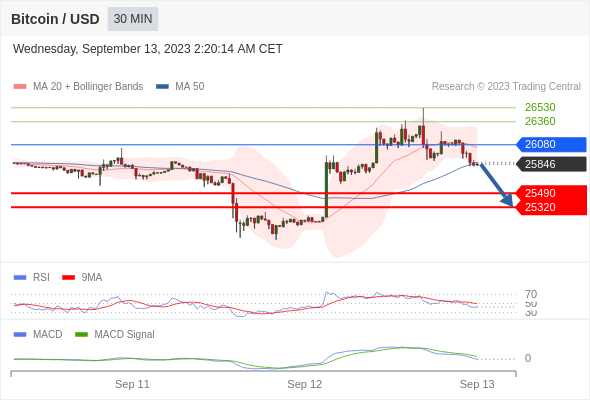
Bitcoin / Dollar intraday: the downside prevails as long as 26080 is resistance
Our pivot point stands at 26080.
Our preference:
The downside prevails as long as 26080 is resistance
Alternative scenario:
Above 26080, look for 26360 and 26530.
Comment:
The RSI is below its neutrality area at 50. The MACD is below its signal line and negative. The configuration is negative. Moreover, the price stands below its 20 and 50 period moving average (respectively at 26046 and 25867).
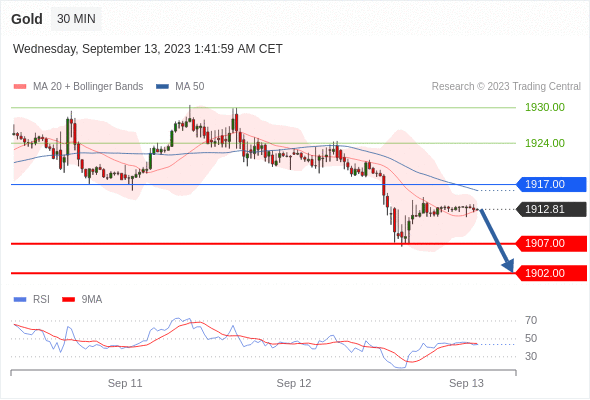
Gold Intraday: key resistance at 1917.00.
Pivot:
1917.00
Our preference:
Short positions below 1917.00 with targets at 1907.00 & 1902.00 in extension.
Alternative scenario:
Above 1917.00 look for further upside with 1924.00 & 1930.00 as targets.
Comment:
As long as the resistance at 1917.00 is not surpassed, the risk of the break below 1907.00 remains high.
S&P 500 (CME) (U3) Intraday: under pressure.
Pivot:
4524.00
Our preference:
Short positions below 4524.00 with targets at 4502.00 & 4492.00 in extension.
Alternative scenario:
Above 4524.00 look for further upside with 4540.00 & 4552.00 as targets.
Comment:
Technically the RSI is below its neutrality area at 50.

Tesla intraday: target 255
Our pivot point stands at 273.4
Our preference:
Target 255
Alternative scenario:
Above 273.4, look for 280.2 and 284.2.
Comment:
The RSI is below 50. The MACD is below its signal line and positive. The MACD must penetrate its zero line to expect further downside. Tesla is trading under its 20 period moving average (271.48) but above its 50 period moving average (261.43).

*Disclaimer: The content of this article is for learning purposes only and does not represent the official position of VSTAR, nor can it be used as investment advice.


.png)


