


Here are today's directional views from the global research desks of Trading Central! These are starting points for your own research to identify opportunities that make sense for you. Like what you see? Feel free to forward this to a friend!
Market Wrap: Stocks, Bonds, Commodities
On Friday, U.S. stocks reversed to the downside. The Dow Jones Industrial Average fell 288 points (-0.83%) to 34,618, the S&P 500 dropped 54 points (-1.22%) to 4,450, and the Nasdaq 100 slumped 271 points (-1.75%) to 15,202.
Regarding U.S. economic data, the University of Michigan consumer sentiment index declined to 67.7 in September (vs 70.0 expected), while the New York State manufacturing index improved to 1.9 in September (vs -8.0 expected).
And industrial production grew 0.4% on month in August (vs +0.2% expected).
The U.S. 10-year Treasury yield gained 4.4 basis points to 4.330%.
Investors are widely expecting the Federal Reserve to keep its key interest rates unchanged on Wednesday (September 20).
Semiconductors (-3.15%), retailing (-2.64%), and software & services (-2.25%) stock sectors lost the most on Friday.
Taiwan Semiconductor (TSM) dropped 2.43% on news reports that the chip-maker told major suppliers to delay the delivery of high-end chip-making equipment on customer demand concerns .
Also impacted by the news, Nvidia (NVDA) declined 3.69%, Advanced Micro Devices (AMD) fell 4.82%, and Marvell Technology (MRVL) lost 2.42%.
Meta Platforms (META) dropped 3.66%, Amazon.com (AMZN) slid 2.99%, and Microsoft (MSFT) was down 2.50%.
Adobe (ADBE) slipped 4.21%, as the software developer gave a lower-than-expected fourth-quarter sales guidance.
European stocks closed higher. The DAX 40 rose 0.56%, the CAC 40 gained 0.96%, and the FTSE 100 was up 0.50%.
U.S. WTI crude futures added $1.10 to $91.21 a barrel, a fresh 10-month high. As a result, oil prices posted a third weekly gain.
Gold price rose $13 to $1,923 an ounce.

Market Wrap: Forex
The U.S. dollar remained steady against other major currencies. The dollar index was little changed at 105.34.
EUR/USD gained 15 pips to 1.0658.
USD/JPY rose 41 pips to 147.88, still among highest levels since November. Japan's central bank is widely expected to keep its key interest rate unchanged at -0.100% on Friday (September 22).
GBP/USD declined 28 pips to 1.2381. The Bank of England is expected to hike its key interest rate by 25 basis points to 5.50% on Thursday (September 21).
AUD/USD slipped 13 pips to 0.6427
USD/CHF climbed 21 pips to 0.8977, and USD/CAD increased 20 pips to 1.3528.
Over the weekend, Bitcoin continued to trade at levels around $26,600.

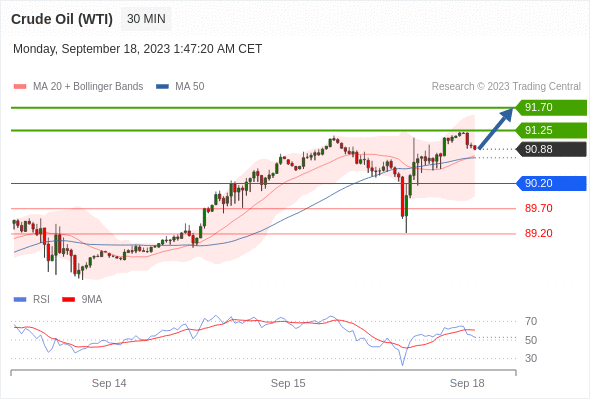
Crude Oil (WTI) (V3) Intraday: bullish bias above 90.20.
Pivot:
90.20
Our preference:
Long positions above 90.20 with targets at 91.25 & 91.70 in extension.
Alternative scenario:
Below 90.20 look for further downside with 89.70 & 89.20 as targets.
Comment:
The RSI calls for a bounce.
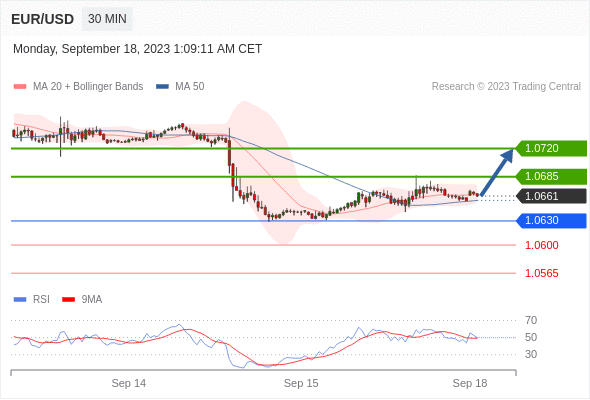
EUR/USD Intraday: bullish bias above 1.0630.
Pivot:
1.0630
Our preference:
Long positions above 1.0630 with targets at 1.0685 & 1.0720 in extension.
Alternative scenario:
Below 1.0630 look for further downside with 1.0600 & 1.0565 as targets.
Comment:
A support base at 1.0630 has formed and has allowed for a temporary stabilisation.
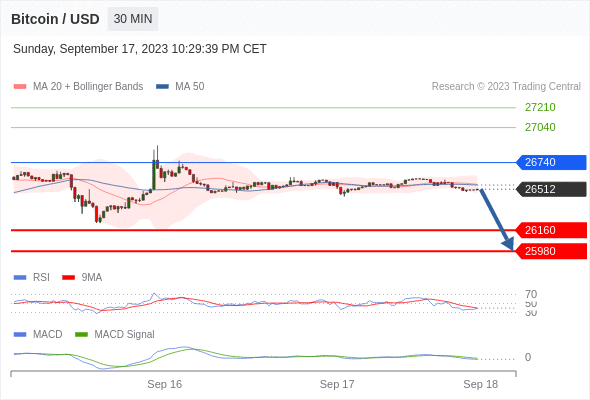
Bitcoin / Dollar intraday: the downside prevails as long as 26740 is resistance
Our pivot point stands at 26740.
Our preference:
The downside prevails as long as 26740 is resistance
Alternative scenario:
The upside breakout of 26740, would call for 27040 and 27210.
Comment:
The RSI is below 50. The MACD is below its signal line and negative. The configuration is negative. Moreover, the price stands below its 20 and 50 period moving average (respectively at 26553 and 26548).
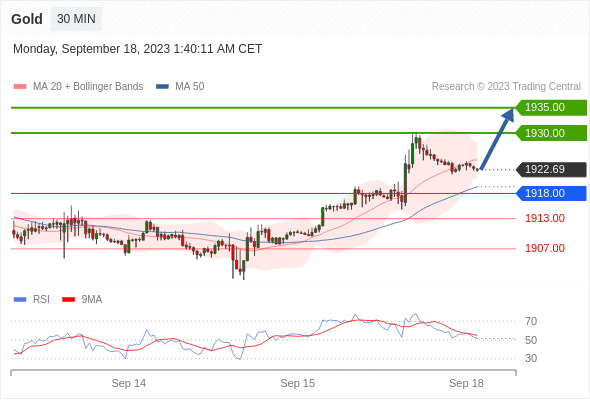
Gold Intraday: bullish bias above 1918.00.
Pivot:
1918.00
Our preference:
Long positions above 1918.00 with targets at 1930.00 & 1935.00 in extension.
Alternative scenario:
Below 1918.00 look for further downside with 1913.00 & 1907.00 as targets.
Comment:
Technically the RSI is above its neutrality area at 50.
S&P 500 (CME) (U3) Intraday: the downside prevails.
Pivot:
4517.00
Our preference:
Short positions below 4517.00 with targets at 4484.00 & 4472.00 in extension.
Alternative scenario:
Above 4517.00 look for further upside with 4528.00 & 4545.00 as targets.
Comment:
As long as 4517.00 is resistance, look for choppy price action with a bearish bias.

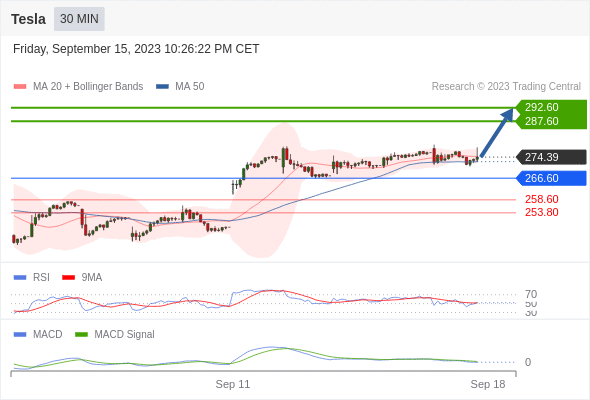
Tesla intraday: as long as 266.6 is support look for 292.6
Our pivot point stands at 266.6
Our preference:
As long as 266.6 is support look for 292.6
Alternative scenario:
Below 266.6, expect 258.6 and 253.8.
Comment:
The RSI is above 50. The MACD is positive and below its signal line. The price could retrace. Tesla is trading under its 20 period moving average (274.62) but above its 50 period moving average (272.7).
*Disclaimer: The content of this article is for learning purposes only and does not represent the official position of VSTAR, nor can it be used as investment advice.


.png)


