


Here are today's directional views from the global research desks of Trading Central! These are starting points for your own research to identify opportunities that make sense for you. Like what you see? Feel free to forward this to a friend!
Market Wrap: Stocks, Bonds, Commodities
On Wednesday, U.S. stocks closed lower after the Federal Reserve kept interest rates steady. The Dow Jones Industrial Average fell 76 points (-0.22%) to 34,440, the S&P 500 dropped 41 points (-0.94%) to 4,402, and the Nasdaq 100 tumbled 221 points (-1.46%) to 14,969.
As widely expected, the Fed maintained its policy rate in the 5.25%-5.50% range. However, the central bank indicated the possibility of one more rate hike before the year-end of the year, and of keeping rates significantly tighter through 2024 than previously expected.
The U.S. 10-year Treasury yield rose 3.4 basis points to 4.393%, and the 2-year yield surged to a 17-year high of 5.238%.
Media (-2.20%), semiconductors (-2.17%), and technology hardware & equipment (-1.74%) stock sectors lost the most.
Alphabet (GOOGL) sank 3.12%, Nvidia (NVDA) fell 2.94%, Microsoft (MSFT) dropped 2.40%, and Apple (AAPL) was down 2.00%.
Maplebear (CART) slid 10.68% after gaining 12% on its listing debut in the prior session.
On the other hand, Pinterest (PINS) rose 3.09%, as the stock was upgraded to "buy" at Citi.
International Business Machines (IBM) climbed 2.26% after being rated "outperform" at RBC Capital Markets.
European stocks closed higher. The DAX 40 rose 0.75%, the CAC 40 climbed 0.67%, and the FTSE 100 was up 0.93%.
U.S. WTI crude futures retreated $1.20 to $89.30 a barrel. The U.S. Energy Department reported a reduction of 2.14 million barrels in crude-oil stockpiles (vs a reduction of 2.20 million barrels expected).
Gold price once jumped up to $1,947 an ounce before retreating to $1,930, relatively flat as compared to the prior session.

Market Wrap: Forex
The U.S. dollar strengthened against other major currencies, as the Federal Reserve stiffened its hawkish stance on interest rates. The dollar index advanced to 105.34.
EUR/USD fell 19 pips to 1.0660. Germany's producer prices fell 12.6% on year in August (vs -12.7% expected).
GBP/USD dropped 49 pips to 1.2343. U.K. data showed that the inflation rate ticked down to 6.7% on year in August (vs 7.1% expected).
USD/JPY rose by 42 pips to 148.28, the highest level since November.
AUD/USD dipped 7 pips to 0.6447.
USD/CHF gained 9 pips to 0.8987, and USD/CAD added 16 pips to 1.3464.
Meanwhile, Bitcoin managed to hold the $27,000 level.

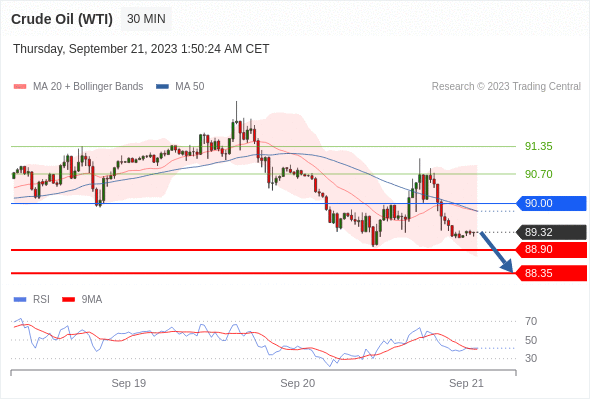
Crude Oil (WTI) (X3) Intraday: under pressure.
Pivot:
90.00
Our preference:
Short positions below 90.00 with targets at 88.90 & 88.35 in extension.
Alternative scenario:
Above 90.00 look for further upside with 90.70 & 91.35 as targets.
Comment:
The RSI is below its neutrality area at 50%
EUR/USD Intraday: under pressure.
Pivot:
1.0685
Our preference:
Short positions below 1.0685 with targets at 1.0630 & 1.0610 in extension.
Alternative scenario:
Above 1.0685 look for further upside with 1.0710 & 1.0735 as targets.
Comment:
The RSI has broken down its 30 level.

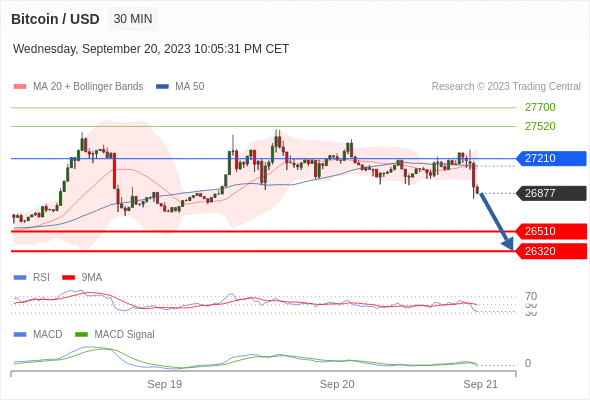
Bitcoin / Dollar intraday: below its lower Bollinger band
Our pivot point stands at 27210.
Our preference:
The downside prevails as long as 27210 is resistance.
Alternative scenario:
The upside breakout of 27210, would call for 27520 and 27700.
Comment:
The RSI is below its neutrality area at 50. The MACD is negative and below its signal line. The configuration is negative. Moreover, the price is trading under both its 20 and 50 period moving average (respectively at 27116 and 27139). Finally, the Bitcoin / Dollar is trading below its lower Bollinger band (standing at 26930).
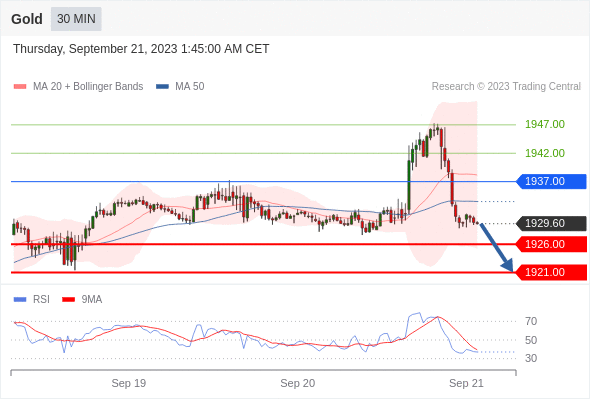
Gold Intraday: consolidation.
Pivot:
1937.00
Our preference:
Short positions below 1937.00 with targets at 1926.00 & 1921.00 in extension.
Alternative scenario:
Above 1937.00 look for further upside with 1942.00 & 1947.00 as targets.
Comment:
The RSI is bearish and calls for further decline.
S&P 500 (CME) (Z3) Intraday: the downside prevails.
Pivot:
4468.00
Our preference:
Short positions below 4468.00 with targets at 4428.00 & 4412.00 in extension.
Alternative scenario:
Above 4468.00 look for further upside with 4484.00 & 4505.00 as targets.
Comment:
The RSI has broken down its 30 level.

Tesla intraday: the upside prevails as long as 263.8 is support
Our pivot point stands at 263.8
Our preference:
The upside prevails as long as 263.8 is support
Alternative scenario:
Below 263.8, expect 257 and 253.
Comment:
The RSI is above its neutrality area at 50. The MACD is above its signal line and positive. The configuration is positive. Tesla is above its 20 and 50 period moving average (respectively at 267.7 and 268.21).

*Disclaimer: The content of this article is for learning purposes only and does not represent the official position of VSTAR, nor can it be used as investment advice.


.png)


