


EURUSD
Fundamental Perspective
The recent Federal Reserve monetary policy meeting maintained interest rates within the expected range, mentioning a balancing act between a slight inflation uptick and slowing growth. While Chairman Powell hinted at the possibility of rate cuts under certain conditions, his overall stance remained cautious. Despite positive indicators such as job additions in the private sector, concerns arose from metrics like the Nonfarm Payrolls report, which fell below expectations. This mixed data painted a complex picture of the US labor market, leaving the Fed room to avoid immediate rate hikes.
US economic data further reflected this complexity, with the ISM Manufacturing PMI signaling contraction in April and the ISM Services PMI unexpectedly shrinking. These developments tempered market optimism but did not significantly impact the demand for the US Dollar.
Conversely, the Eurozone saw generally positive economic indicators, including steady Consumer Confidence and a rise in the Harmonized Index of Consumer Prices. However, Germany's economy contracted in the first quarter despite surpassing inflation expectations.
The market focus will be on upcoming EU data releases, particularly the final April Services and Composite PMIs, along with potential ECB actions. In the US, attention will turn to indicators like the preliminary estimate of the May Michigan Consumer Sentiment Index and speeches from Fed officials for further insights into monetary policy direction.
EURUSD Forecast Technical Perspective
The weekly chart posted three consecutive green candles, revealing that buyers are slightly more confident than sellers. Although the upper wicks declare bears are also active, the next candle can be another green one.
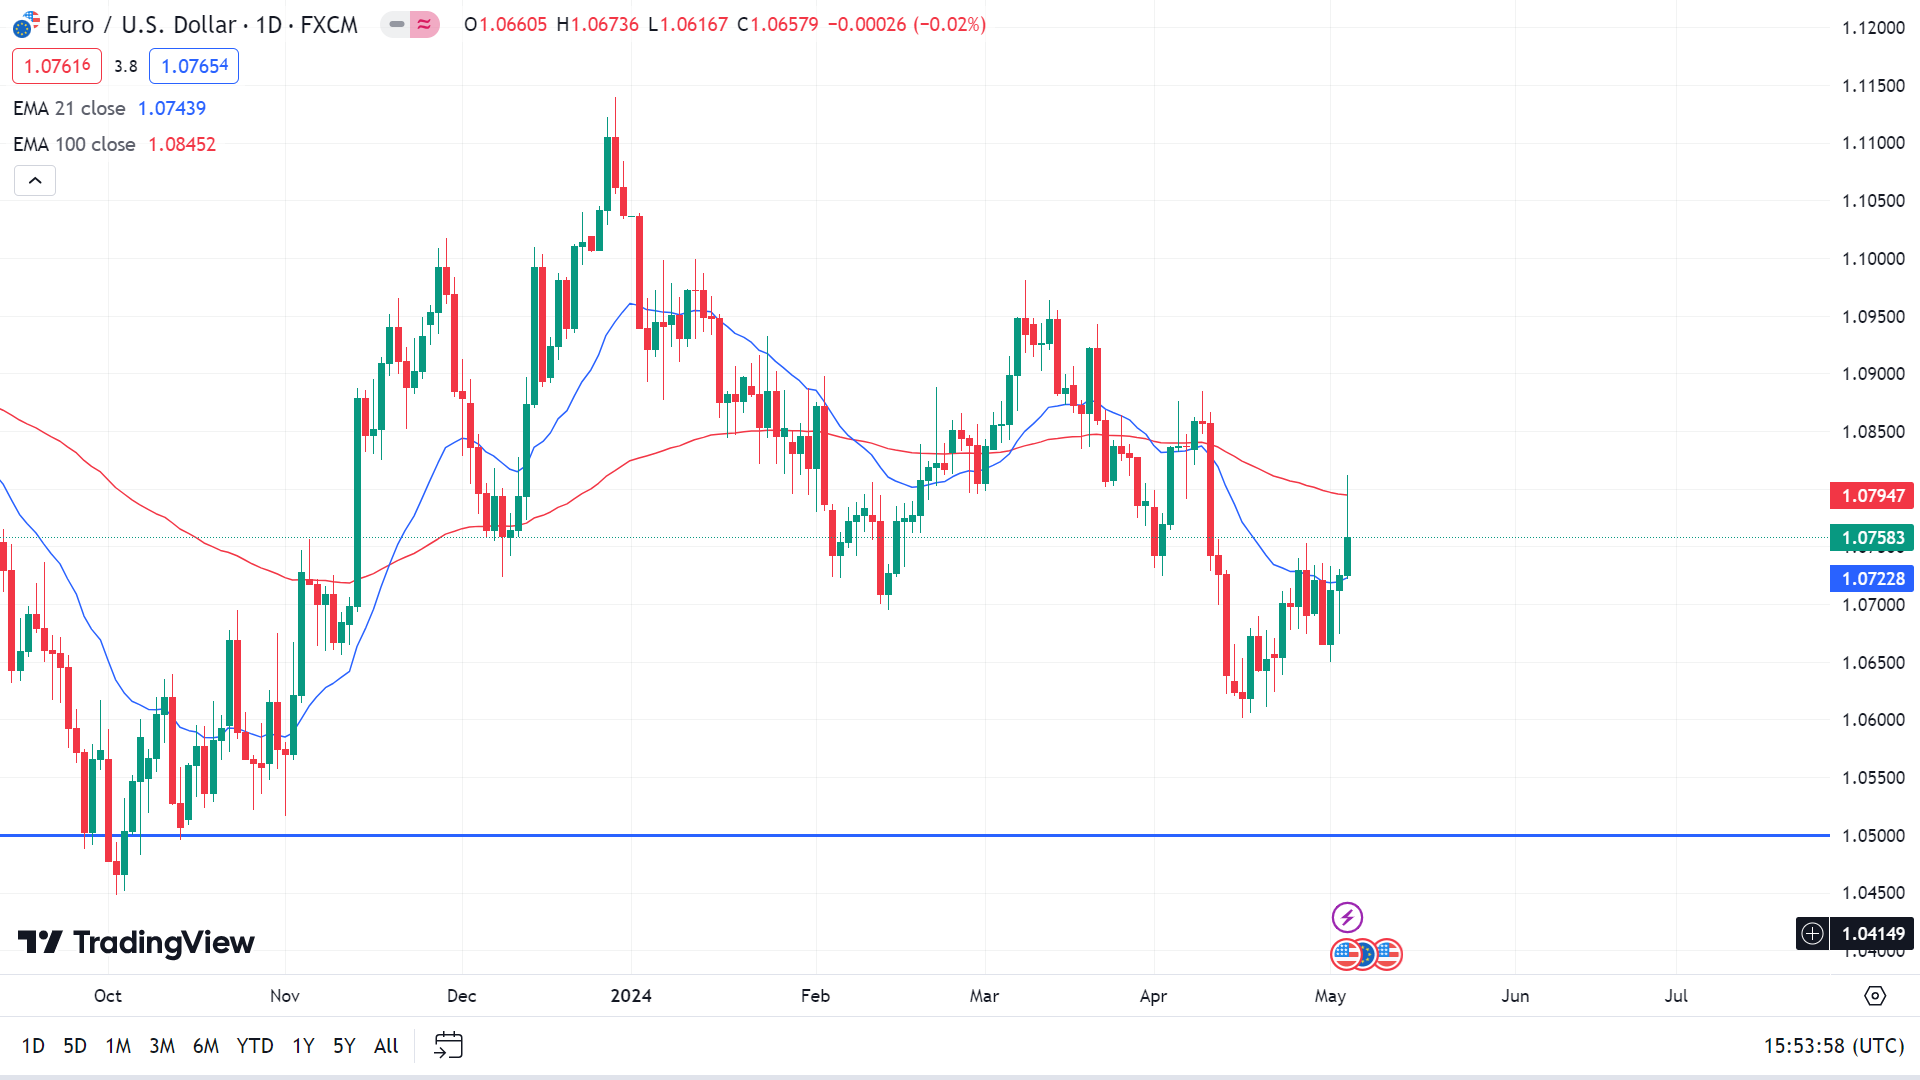
The price remains above the EMA 21, indicating bullish pressure on the daily chart. So, the price can reach the current resistance level of 1.0885, followed by the next support level of 1.0946.
Meanwhile, the price pullback after reaching EMA 100 indicates sell pressure on the asset price. So, the price can reach the primary support level of 1.0601, and any valid break below that level can trigger the price to get long-term support near 1.0500.
GBPJPY
Fundamental Perspective
Amid suspicions of direct intervention by the Bank of Japan (BoJ) in the foreign exchange (FX) markets, the GBPJPY pair has maintained a steady position near the 192.00 mark. Reports suggest the BoJ intervened twice within a short period to bolster the Japanese Yen (JPY). This is evident in the significant expenditure on uncategorized financing operations disclosed by the central bank, totaling approximately 9 trillion Yen. Despite this, official confirmation or denial of these actions is awaited.
The focus shifts to the Bank of England (BoE), which is poised to announce its latest interest rate decision alongside an economic outlook statement. Additionally, the upcoming week brings fresh insights into UK economic growth by releasing quarterly Gross Domestic Product (GDP) figures. Expectations point to a rebound in UK quarter-on-quarter GDP to 0.4%, indicating potential momentum compared to the previous quarter.
As Japanese markets resume activity following the holidays, attention remains on any official pronouncements from the BoJ regarding market operations. It underscores the importance of central bank actions and economic indicators in shaping currency market dynamics amidst ongoing global economic uncertainties.
GBPJPY Forecast Technical Perspective
On the weekly chart, the last candle closed solid red, declaring sell pressure on the asset price. So, the next candle can be another red one.

On the daily chart, the ADX value confirms bullish pressure on the asset price. So, the price can reach the primary resistance near 196.27, followed by the next resistance near 200.00.
Meanwhile, Stochastic signal lines near the oversold level suggest selling pressure on the asset price. So, a downside correction towards the current support level of 190.46 is possible, while a valid break below that level can trigger the price to reach nearly 187.90.
Nasdaq 100 (NAS100)
Fundamental Perspective
Last week, investors experienced bullish pressure spurred by hawkish comments from Fed Governor Bowman. Bowman suggested that extended elevated inflation and openness to interest rate hikes if inflationary pressures persist or reverse sparked market caution. Adding to market unease, concerns about stagflation emerged as the April ISM services index unexpectedly contracted by its largest margin in 16 months, alongside a higher-than-anticipated increase in the April ISM services prices paid sub-index.
Corporate setbacks also weighed on sentiment, notably with Expedia Group plummeting over 15% due to Q1 gross bookings falling short of consensus and Fortinet declining more than 9% following disappointing Q1 billings.
In economic indicators, April's average hourly earnings in the United States saw a modest 0.2% month-on-month rise and a 3.9% year-on-year increase, slightly below forecasts. The unexpected decline in the April ISM services index to 49.4, contrasting with expectations of an increase to 52.0, marked the sharpest contraction in 16 months.
Conversely, the April ISM services prices paid sub-index surged by 5.8 to 59.2, surpassing expectations and indicating robust pricing pressures.
Technical Perspective
The weekly candle closed as a bullish hammer after creating a valid Bullish Harami pattern, confirming buyers' domination at the asset price. So maybe the next candle will be another green one.
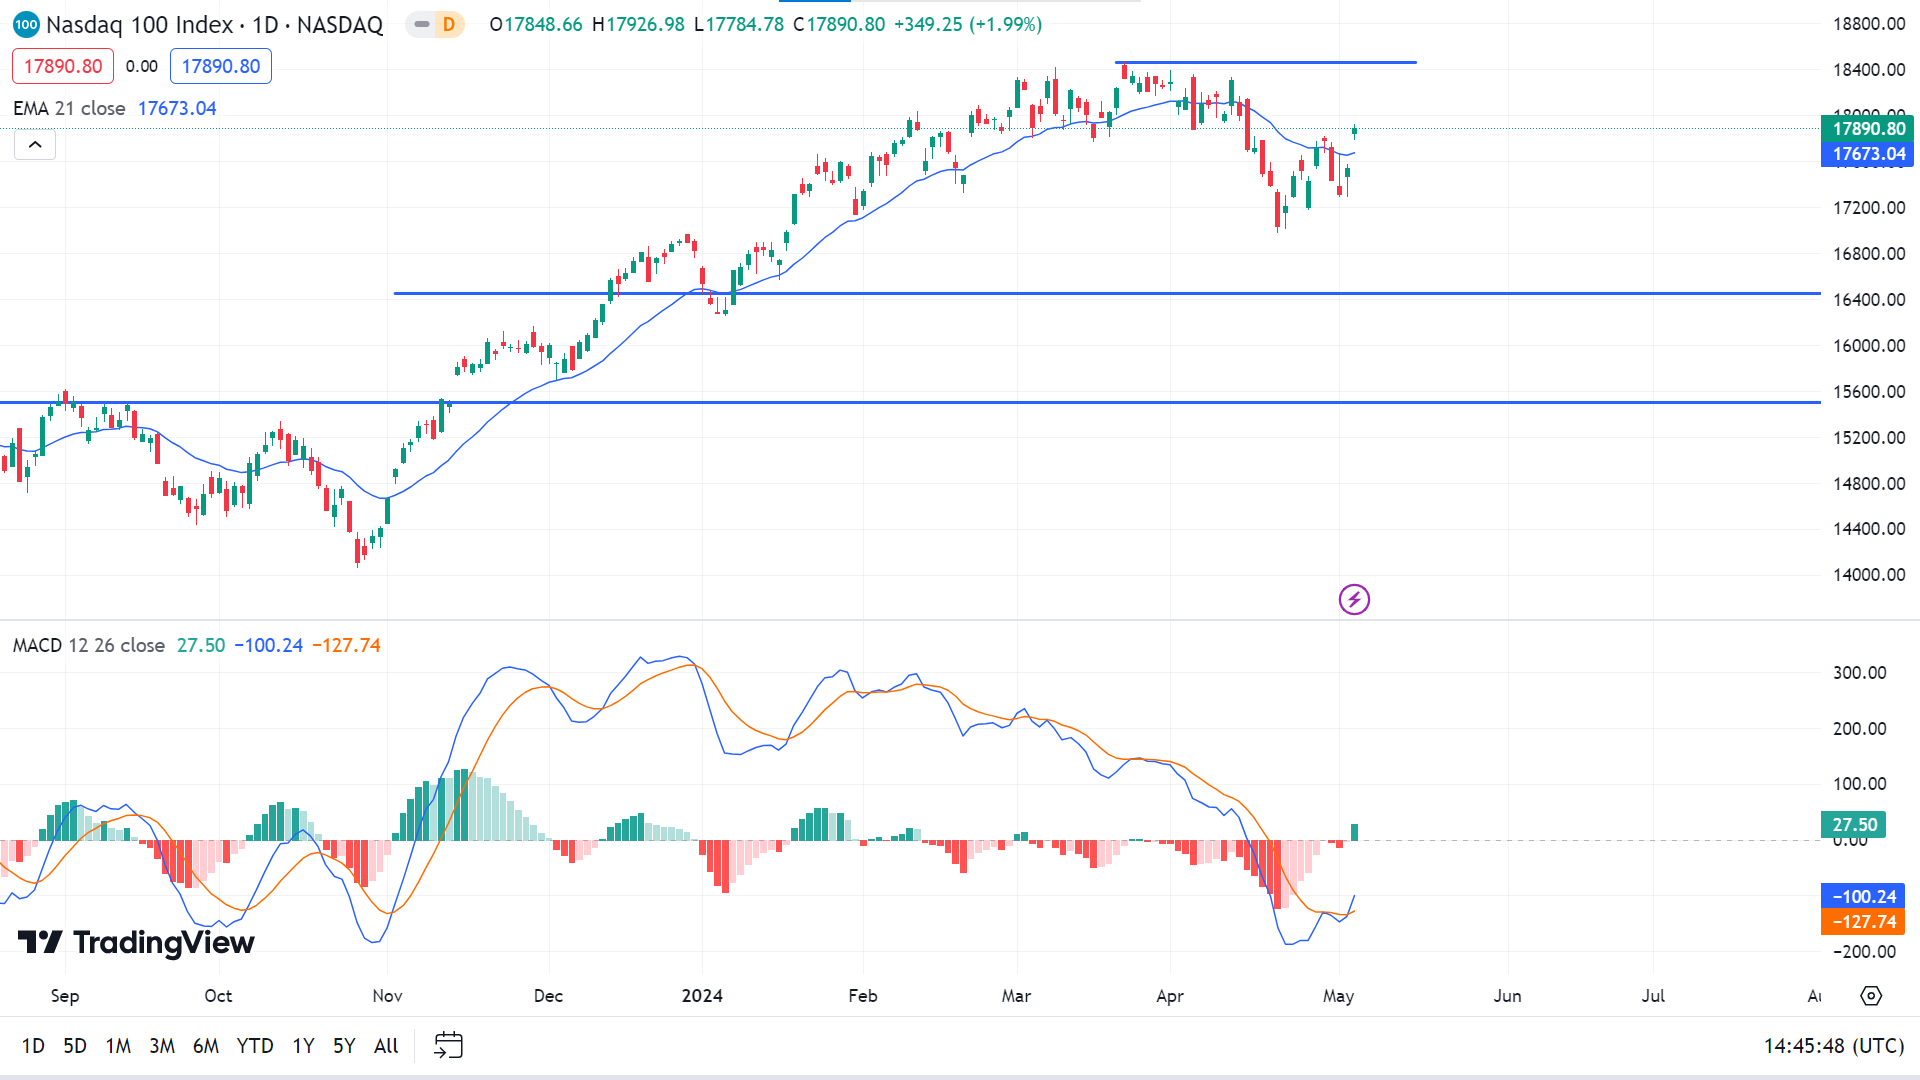
On the daily chart, the price is hovering above EMA 21, indicating ongoing buying pressure, which can head to the recent peak of $18,464.00. The next possible resistance is $18.863.75.
However, the MACD signal lines are floating in bearish territory, suggesting any rejection from this level can retrace the price toward the primary support, which is nearly $17,288.90. In contrast, the next support is near $16.973.94.
S&P 500 (SPX500)
Fundamental Perspective
U.S. stock rallied following the Labor Department's data release report, which revealed slower-than-expected U.S. job growth for April alongside smooth annual wage increases.
Nonfarm payrolls expanded by 175,000 jobs last month, whereas economists anticipated 243,000. Meanwhile, the March number was revised from the previous report of 303,000 to 315,000 jobs. The unemployment rate increased from 3.8% to 3.9% yet remained below the 4% level for the 27th consecutive month.
Apple shares (AAPL) surged nearly 6% last Friday, supported by the tech giant's announcement of a robust stock buyback plan and optimistic sales growth outlook. It attracted investors who had previously left the stock due to concerns such as weakening demand and competition in the Chinese market.
Technical Perspective
The weekly chart shows an impressive bullish scenario as the last candle closed bullish hammer after the bullish harami pattern validating the bull's domination on the asset price. So the next candle may be another green one.

On the daily chart, the price remains above the EMA 100 line, indicating bullish pressure on the asset price. The price may regain the peak of $5264.85, whereas the next possible resistance is $5349.52.
Meanwhile, the MACD signal lines are still in the bearish territory, indicating that bears are also active on the market. So, the price can reach the primary support of $5013.45, following the next support of nearly $4953.56.
Bitcoin (BTCUSD)
Fundamental Perspective
Grayscale's trading counters have reached a pivotal moment with their spot BTC ETF, IBIT, marking its first inflow since its launch on January 11. Reports reveal a substantial $63 million influx on Friday, signaling a notable shift after nearly 80 days of spot Bitcoin ETF trading on Wall Street without Grayscale's participation. The surge in capital underscores a growing institutional interest, boosting net inflows to $378.5 million.
The increased trading activity within Grayscale is partially attributed to the anticipation surrounding its forthcoming Bitcoin Mini Trust. This upcoming mini-fund spot Bitcoin ETF promises a reduced fee structure compared to the existing GBTC, offering investors a more economically efficient avenue for Bitcoin exposure. Set to trade under the BTC ticker symbol on the New York Stock Exchange (NYSE), its imminent debut reflects the intensified competition in the Bitcoin ETF market.
Despite the historically high fees associated with the GBTC ETF, market sentiment remains positive regarding the recent inflows. It is supported by Grayscale's persistent marketing efforts, which are expected to benefit the GBTC in the long run.
Bitcoin Price Prediction Technical Perspective
The weekly candle finished as a doji with a long wick on the downside, confirming bullish pressure on the asset price. So, the next candle can be another green one.
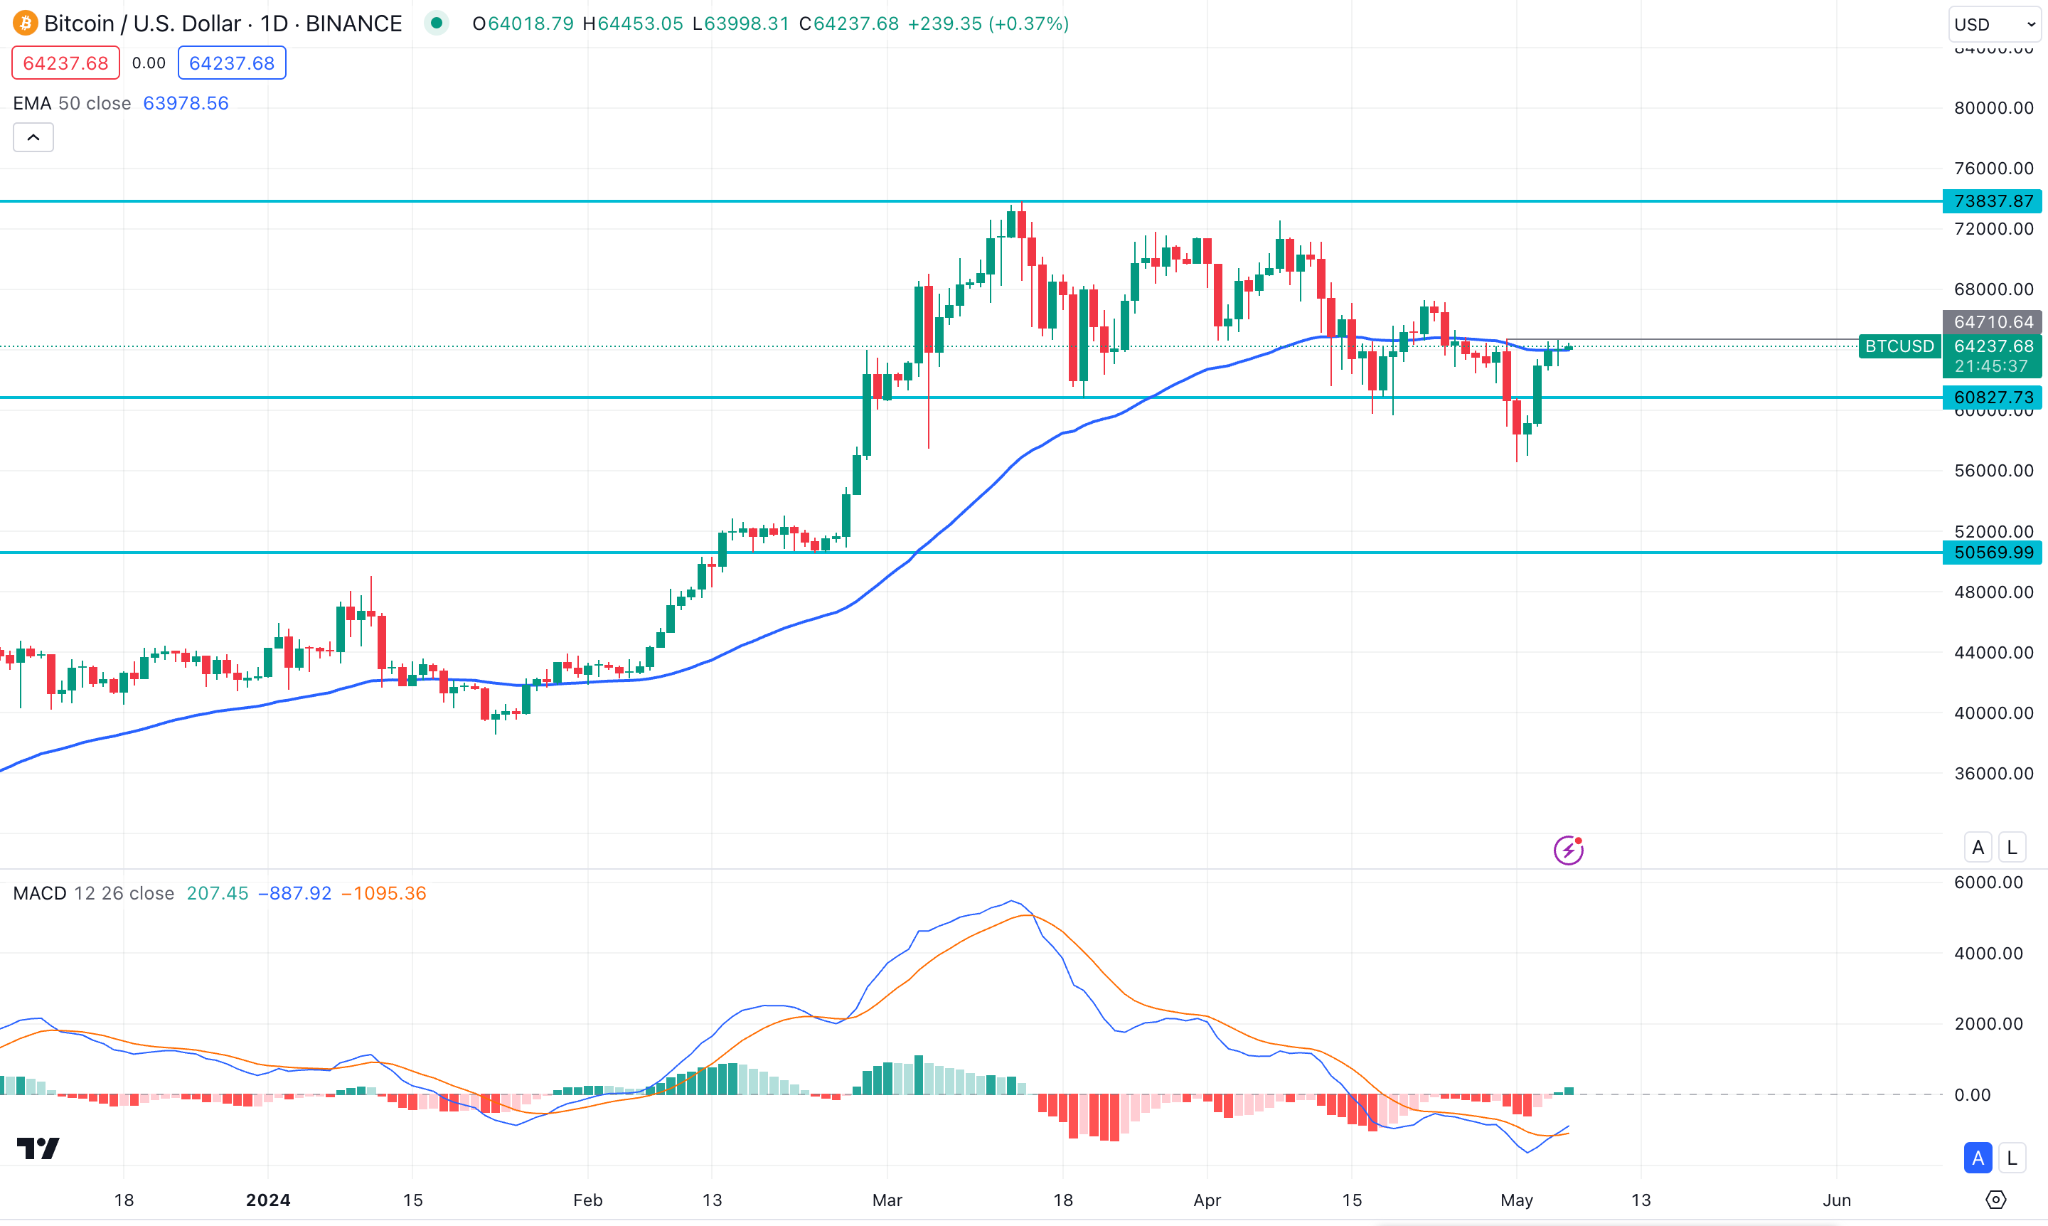
The price remains above the EMA 100 on the D1 chart, indicating buying pressure on the asset price. So, the price may reach the current resistance of $71,000.00, following the ATH near $73,794.00.
Meanwhile, MACD signal lines still remain in the negative territory, suggesting sellers are still active on the asset price. So, the price might reach the primary support of $57,388, following the next support of nearly $ 52,473.00.
Ethereum (ETHUSD)
Fundamental Perspective
MicroStrategy founder Michael Saylor delivered a keynote speech on Friday, expressing skepticism about the approval of spot Ethereum ETFs. According to Saylor, ETH and other prominent cryptocurrencies like Solana, BNB, XRP, and ADA are considered "crypto asset securities" rather than commodities. He asserted that this classification would deter Wall Street and mainstream institutional investors from embracing them.
Saylor's remarks come amid uncertainty regarding the Securities and Exchange Commission's (SEC) decision on approving a spot ETH ETF in May. Despite applications from various institutions such as BlackRock, ARK Invest, and Grayscale, recent regulatory actions targeting Ethereum-related entities have led to speculation that the SEC may reject these proposals. Bloomberg analyst James Seyffart echoed this sentiment, suggesting in an interview with Altcoin Daily that the likelihood of spot ETH ETFs materializing in 2024 is low.
Saylor's commentary has sparked discussion within the crypto community, with some contesting his viewpoint. One user disagreed with Saylor on the C platform, expressing confidence that he would ultimately be proven wrong.
Ethereum Price Prediction Technical Perspective
The weekly candle closed as a hammer with a red body and wick on the downside after a green candle, declaring optimism to the buyers. The next candle could be another green one.
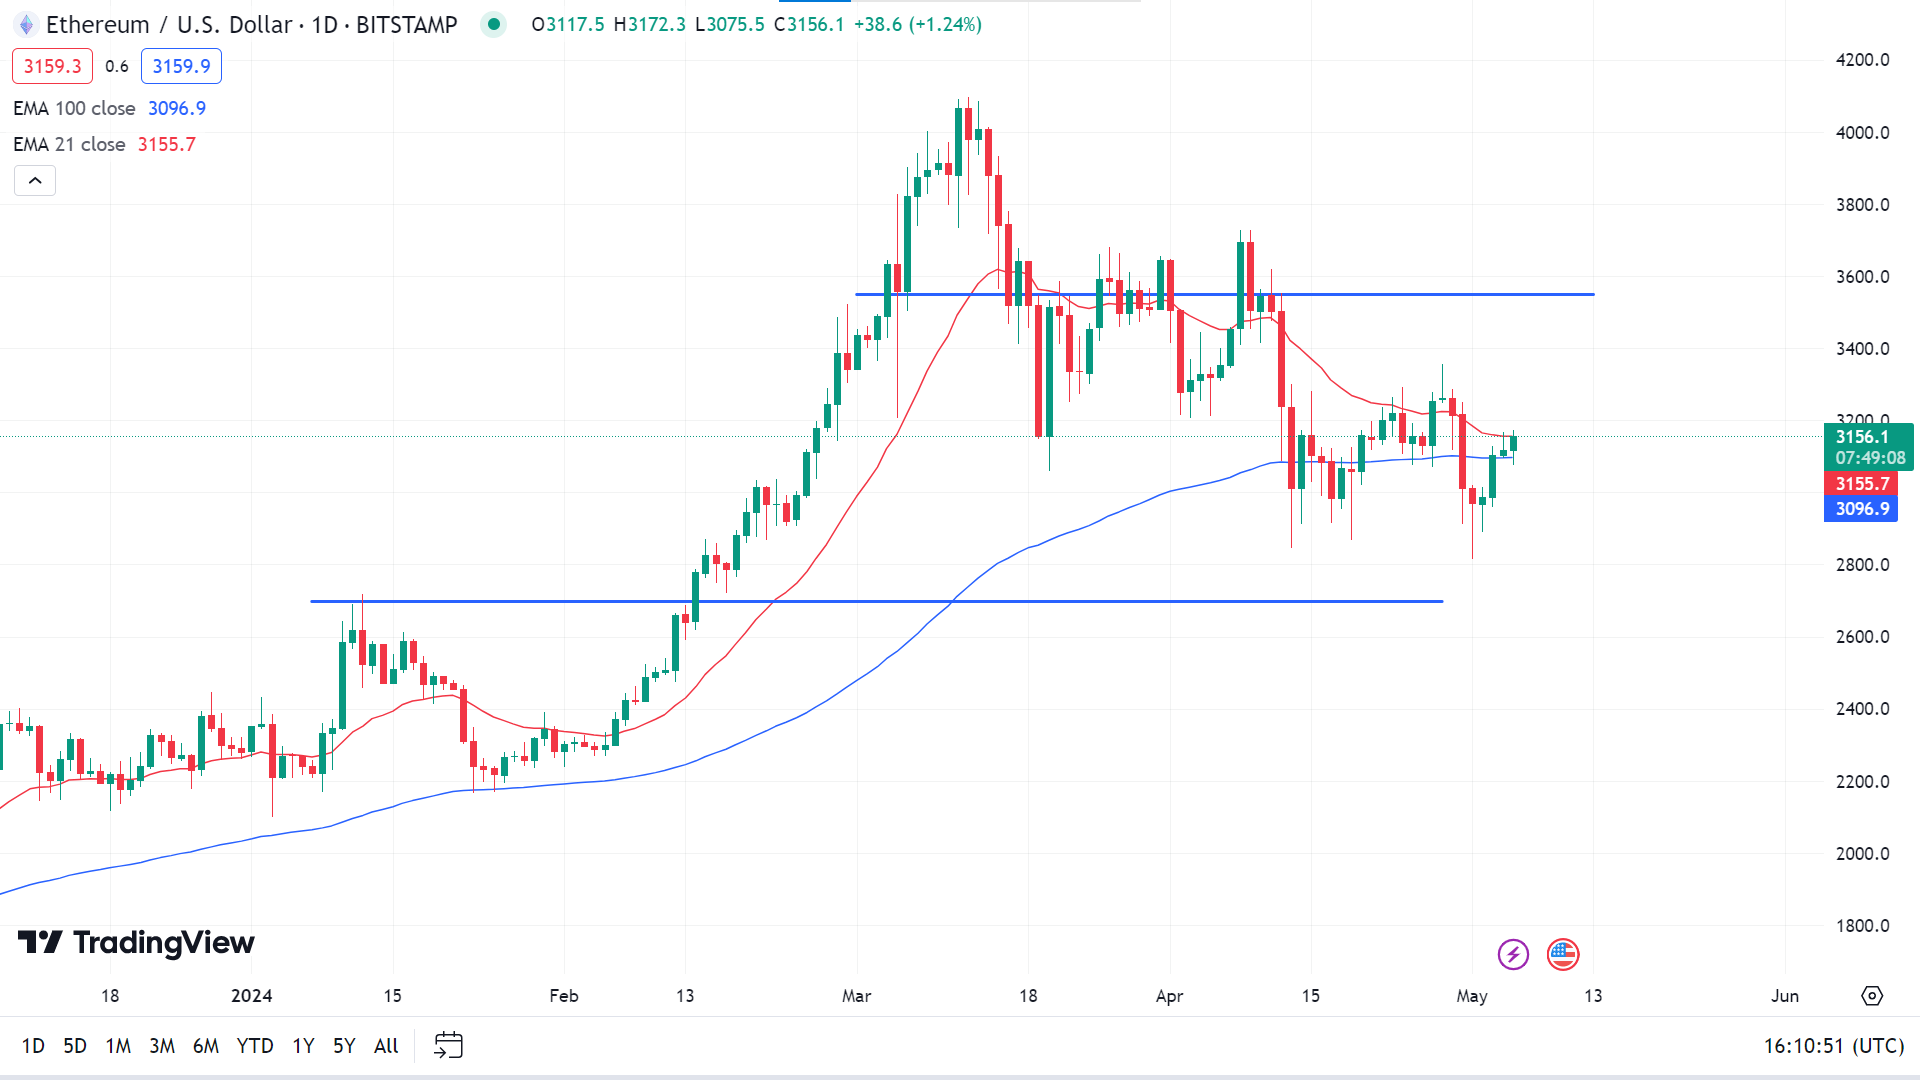
On the daily chart, the price floating above the EMA 100 line indicates the price can reach the current resistance of $3550.00, and a valid breakout can trigger the price to the next resistance near $4006.50.
Meanwhile, the price remains below the EMA 21, suggesting selling pressure on the asset price. So the price may retreat toward $2948.50, and the next possible support is near $2790.70.
Gold (XAUUSD)
Fundamental Perspective
Gold (XAU/USD) faced another week of decline, marking a consecutive 2% drop amidst renewed bearish sentiment. Despite brief recovery attempts, the precious metal succumbed to downward pressure as market focus shifted towards Fedspeak.
The week commenced on a relatively stable note for gold, with little price change on Monday. However, Tuesday witnessed a significant downturn, with XAUUSD plummeting to its lowest level over three weeks, sliding below $2,290. This decline followed the release of robust U.S. data, notably the Employment Cost Index, which surpassed market expectations and fueled an uptick in U.S. Treasury bond yields. Concurrently, the U.S. dollar strengthened on reports indicating the Federal Reserve's readiness to maintain interest rates steady for a prolonged period, bolstered by robust inflation readings.
The Federal Reserve's announcement on Wednesday maintained the policy rate unchanged as anticipated, with a noteworthy adjustment in the pace of balance sheet reduction. Despite Chairman Jerome Powell's remarks downplaying the likelihood of imminent policy tightening in the face of persistent inflation, the U.S. dollar regained strength on Thursday, restricting XAUUSD's upward movement.
Friday's release of nonfarm payrolls, which fell short of market expectations, failed to provide a reprieve for gold amidst prevailing risk appetite. Consequently, XAU/USD concluded the week with subdued investor interest, underscoring the ongoing challenges facing the precious metal in the current market environment.
Gold Price Prediction Technical Perspective
The weekly chart of XAUUSD posted two consecutive losing weeks, declaring bearish pressure on the asset price. The next candle can be another red one.

On the daily chart, the price is floating below the fine previous support of $2325.00 and reaches below $2280.00; according to the readings EMA 21, it can head to the primary support of $2225.00.
Meanwhile, the MACD window still creates red histogram bars and signal lines are heading on the downside, suggestions still indicate bullish pressure and any breakout above $2325.00 could trigger the price to reach the current resistance of $2385.00 or above.
Tesla Stock (TSLA)
Fundamental Perspective
Tesla (TSLA) stock has experienced a rollercoaster ride, sliding approximately 30% since the year's commencement. However, a recent uptick followed the unveiling of the electric vehicle (EV) giant's first-quarter earnings on April 23. Despite reporting earnings and revenue below expectations, Tesla's shares skyrocketed by 12% the next day, buoyed by CEO Elon Musk's indications of forthcoming "more affordable" models and bullish forecasts for 2024 vehicle deliveries, emphasizing the company's commitment to advancing full-self driving (FSD) technology.
Before the earnings report announcement, TSLA shares had faced a downward spiral, losing over 17% in April and bottoming out at a yearly low of $138.80 on April 22. Nonetheless, a swift rebound occurred post-earnings, with Tesla's stock witnessing a 24% surge since April 23.
As Tesla embarks on what Musk terms the "next phase of growth," restructuring initiatives are underway, including the departure of key executives and workforce reductions. Musk's strategic maneuvers prompted Adam Jonas from Morgan Stanley to characterize Tesla's current phase as the "most profound realignment of priorities and strategy in the company's history," hinting at potential volatility ahead for investors amidst this strategic transformation.
With the narrative of Tesla's evolution unfolding, investors remain poised for what lies ahead as the company navigates this pivotal trajectory.
Tesla Stock Forecast Technical Perspective
On the weekly chart, the price soared at the beginning of the last week but ended below the opening price, delivering a red candle with an upper wick. The next candle can be another red one, which seems rejected from the EMA 200 line.

On the daily chart, the RSI reading stays above 50, suggesting bullish pressure on the daily chart. So, any breakout above $200.00 can move the price toward the next resistance near $250.00.
Meanwhile, the price remains below the EMA 100 line, suggesting sell pressure on the asset price. So, the price may drop toward the recent support of $155.16, followed by the next support of $101.81.
Nvidia Stock (NVDA)
Fundamental Perspective
The global AI chip market, valued at around $15 billion in 2022, is anticipated to experience a swift rise, reaching nearly $384 billion by 2032, as per projections by Allied Market Research. Currently, Nvidia holds a dominant position, commanding approximately 94% of the market share, according to Vijay Rakesh of Mizuho Securities.
Nvidia's pioneering efforts in AI chip development have yielded substantial dividends, with its graphics cards emerging as the preferred choice for AI model training among major cloud computing providers and startups, including ChatGPT. This success translated into a remarkable surge in Nvidia's data center revenue, which soared to $47.5 billion in fiscal 2024, marking a staggering 217% increase from the previous year.
Nevertheless, Nvidia is expected to face heightened competition in the AI chip landscape, particularly from rivals like Intel and Advanced Micro Devices (AMD). AMD, for instance, witnessed a significant uptick in sales of its data center chips, experiencing an impressive 80% year-over-year surge to $2.3 billion in the first quarter of 2024, driven by escalating demand for its AI accelerators.
Despite the anticipated dilution of market share, Nvidia is poised to maintain its dominance, supported by robust growth prospects. Market analysts project Nvidia's data center graphics card sales to reach $87 billion this year and potentially skyrocket to $280 billion by 2027. With ample opportunities for expansion in the AI chip market and promising prospects in sectors like gaming, Nvidia is poised for continued earnings growth in the foreseeable future.
Nvidia Stock Forecast Technical Perspective
The weekly candle closed as a bullish hammer after a bullish harami pattern, declaring buyer domination on the asset price. So, the next candle can be another green one.
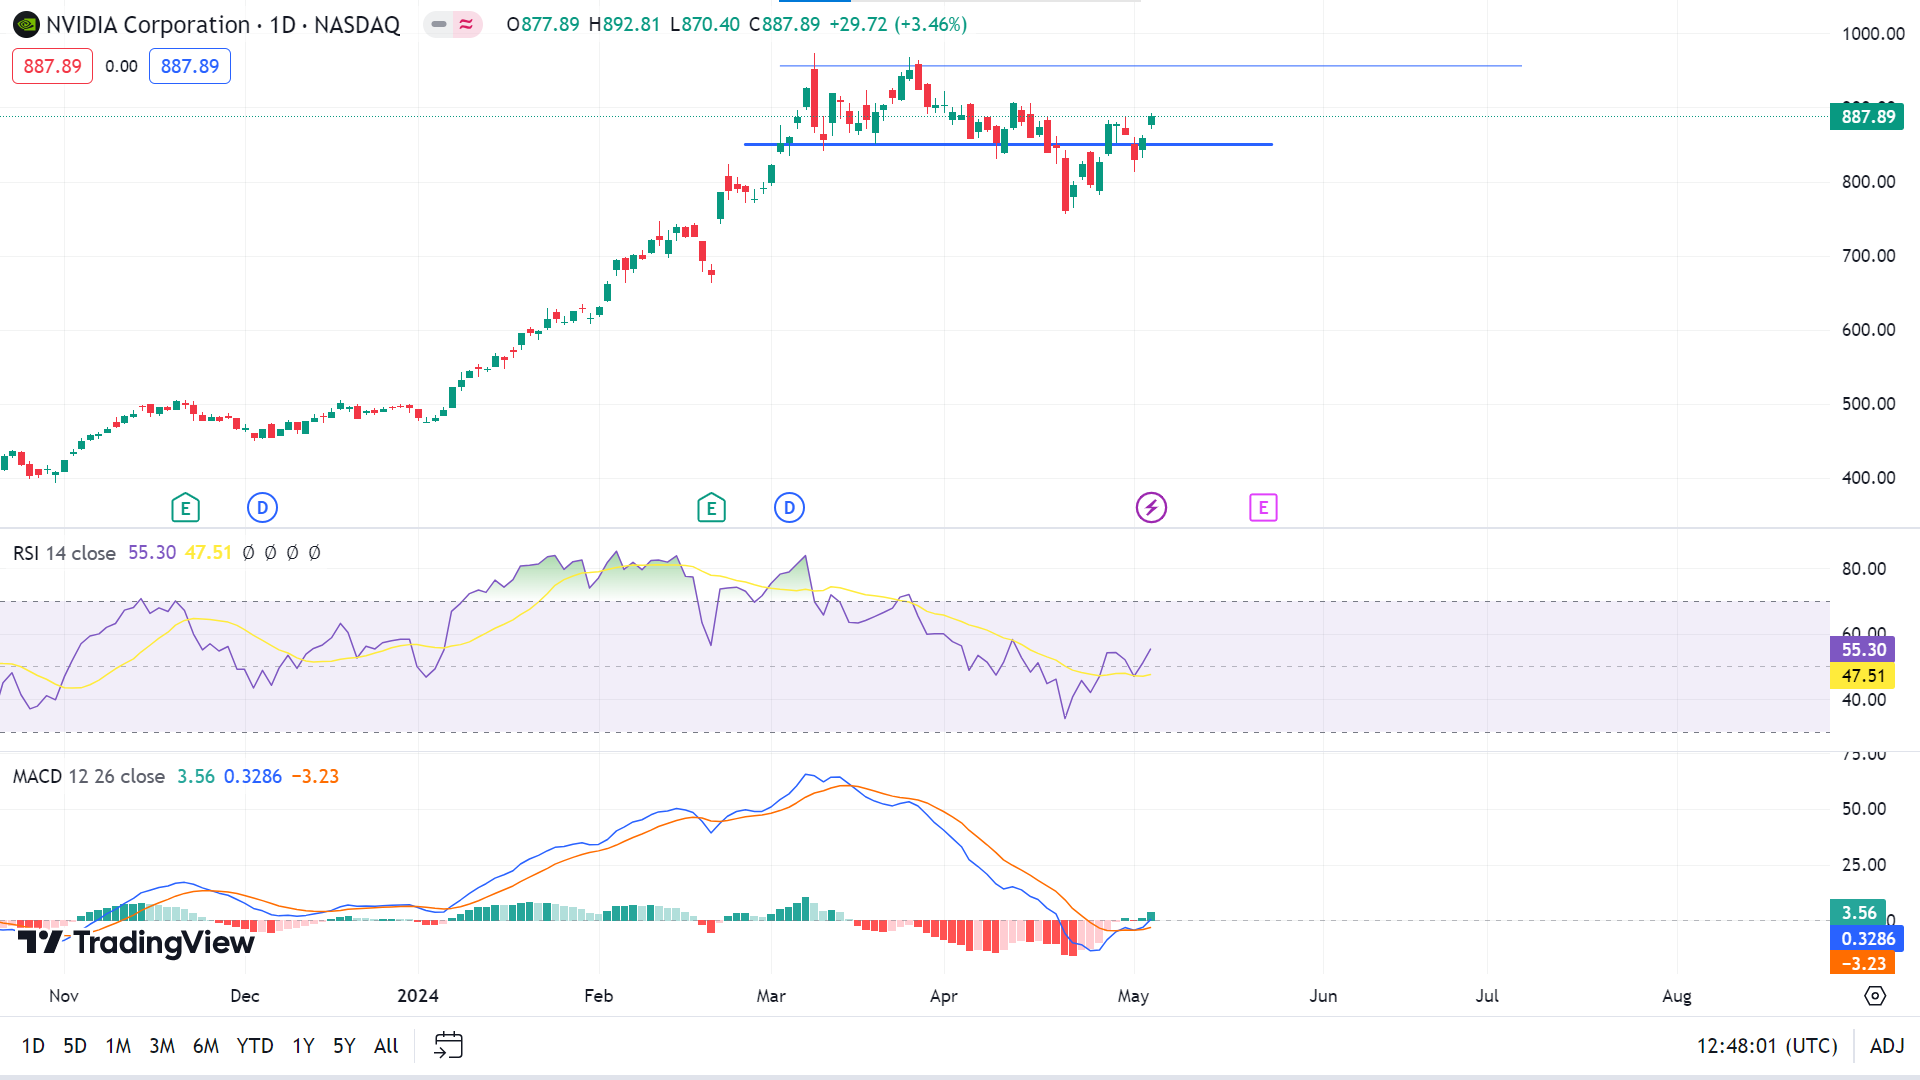
The RSI reading remains above 50, suggesting bullish pressure on the asset price on the daily chart. So the price may regain toward the last peak of $974 and breakout above.
At the same time, on the MACD window, the signal lines are still floating at bearish territory, indicating the price may drop back to the recent support of $787.98, following the next support near $734.17.
WTI Crude Oil (USOUSD)
Fundamental perspective
Oil prices have plummeted to their lowest levels in nearly three months, witnessing significant declines in U.S. West Texas Intermediate (WTI) and Brent crude. This downward trend reflects a combination of factors, including mounting supply, sluggish demand, and concerning economic indicators, collectively painting a bearish picture for the foreseeable future.
The oil market experienced its most significant weekly losses in three months, spurred by disappointing U.S. job data and uncertainties surrounding Federal Reserve interest rate policies. The Federal Reserve's decision to maintain interest rates underscores ongoing inflation and economic stability worries. Typically, higher interest rates strengthen the dollar, rendering oil more expensive for holders of other currencies and potentially dampening demand.
Supply and demand dynamics have played a significant role. U.S. crude inventories unexpectedly surged by 4.91 million barrels, sharply contrasting with anticipated declines. This surge in supply, coupled with a recent uptick in U.S. crude production to 13.15 million barrels per day, indicates an oversupply in the market, typically resulting in price declines as supply outpaces demand.
Geopolitical tensions, including those related to the Israel-Hamas conflict, have eased as both sides consider a ceasefire and engage in negotiations. Moreover, the upcoming OPEC+ meeting slated for June 1 may extend voluntary output cuts if oil demand fails to pick up. Such strategic decisions wield direct influence over market supply, potentially stabilizing or bolstering oil prices.
Oil Prices Forecast Technical Perspective
The weekly chart finished as a solid red candle, declaring the bearish pressure on the asset price. The next candle can be another red one.
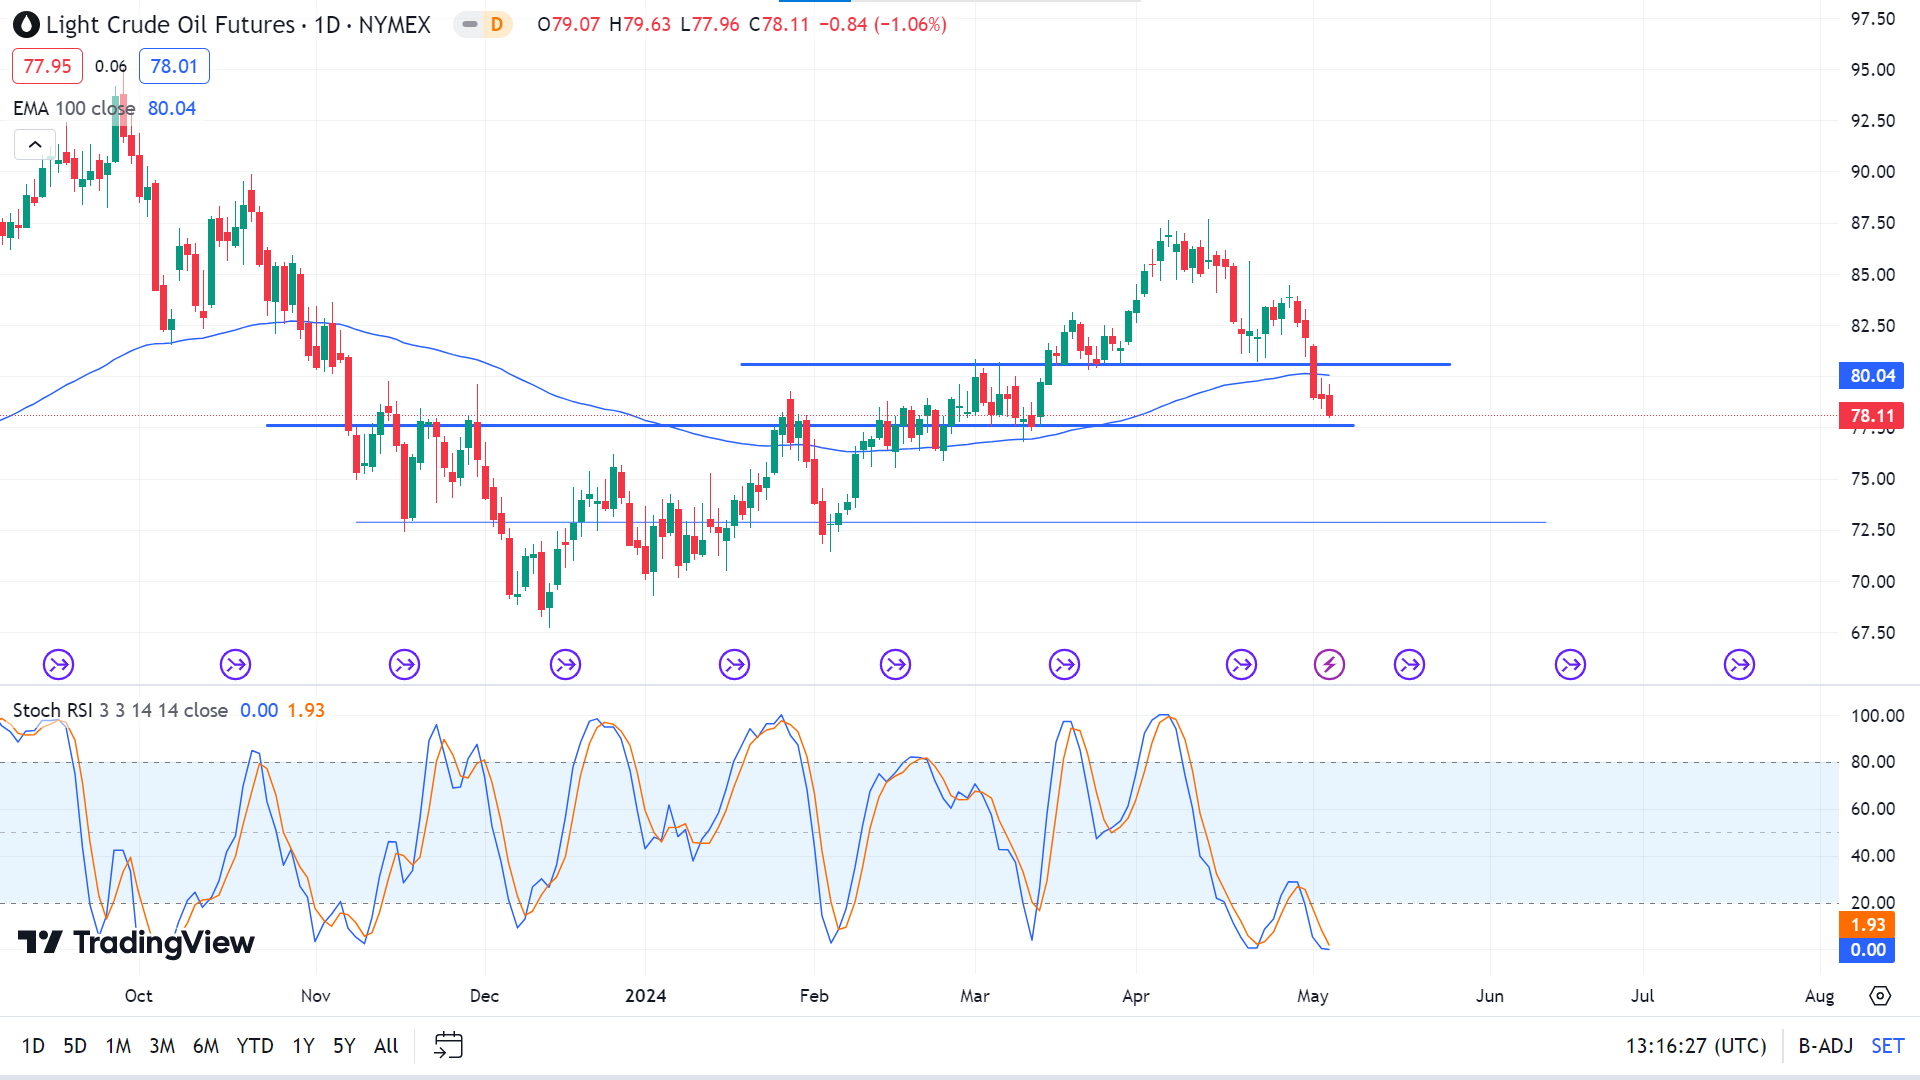
On the daily chart, the price is floating below EMA 100, and EMA 200, suggesting bearish pressure on the asset price. So, no wonder the price may reach the primary support of $77.70, following the next support of $72.86.
Conversely, the Stochastic RSI indicator suggests oversold, indicating the price can turn upside from this level toward the primary resistance of $80.60, whereas the next resistance is near $84.25.


