- Meta's stock performance is mixed compared to the S&P 500, with short-term weakness (-1.25%) but strong long-term growth potential (131.81% over a year).
- Meta boasts a massive user base, with 3.24 billion daily active users in March 2024, driving increased ad impressions and higher ad prices.
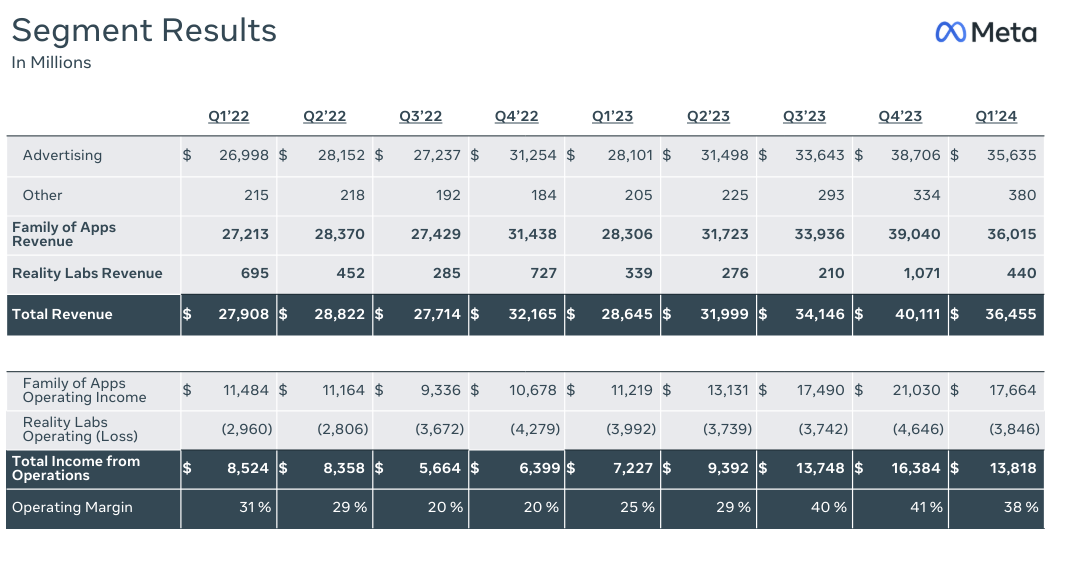
- Revenue surged by 27% year-over-year in Q1 2024 to $36.46 billion, with disciplined cost management practices maintaining healthy profit margins.
- Despite operating losses in its Reality Labs segment and increased capital expenditures, Meta remains bullish on revenue growth, with consensus EPS and revenue estimates trending upwards.
Meta's Q1 2024 performance trends, strategic initiatives, and market dynamics reveal a tapestry of potential returns and risks. Amidst the backdrop of fluctuating performance, capital allocations, and forward-looking guidance, Meta's fundamentals unfold with a blend of promise and uncertainty. The article explores fundamental strengths, weaknesses, valuation metrics, and technical indicators, providing a compass to project Meta stock price for 2024.
Meta Stock Price Performance
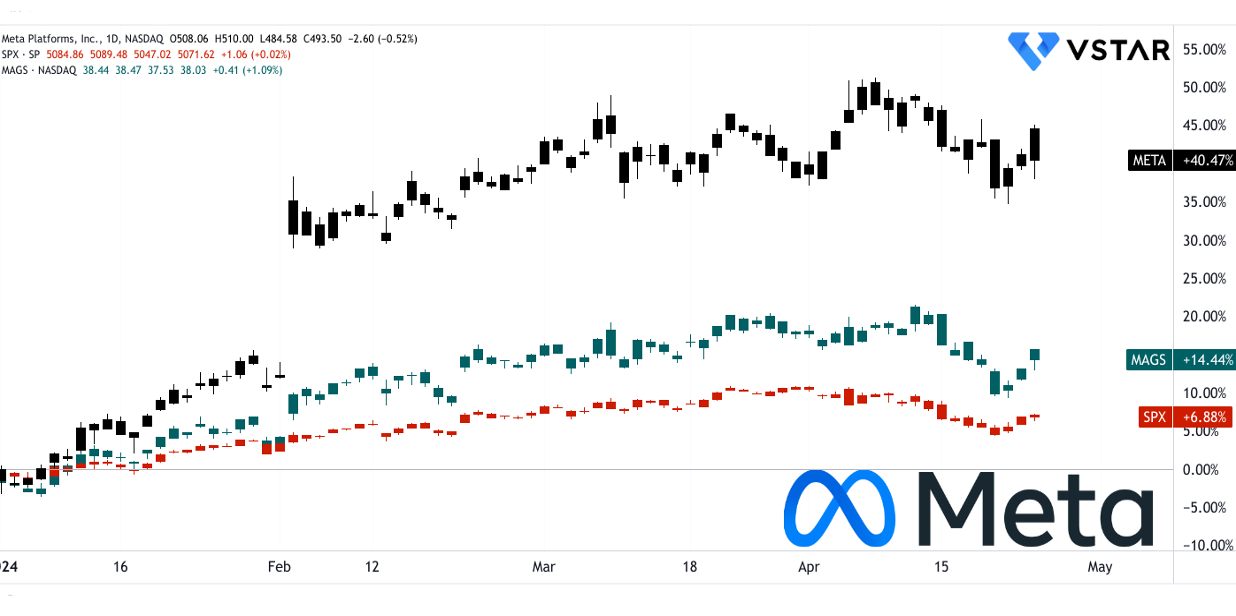
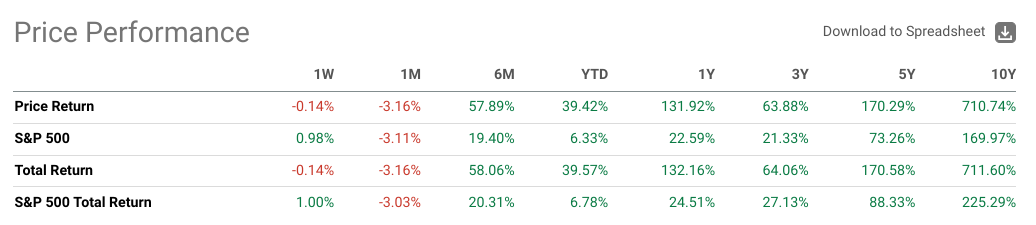
Meta Platforms stock (NASDAQ:META) has shown mixed performance compared to the S&P 500 across various time frames. In the short term (1 week), Meta's price return (-0.14%) underperformed slightly against the S&P 500 (1%), suggesting short-term weakness. Over a longer period, Meta's performance is more pronounced. For instance, in the last year, Meta's price return of 132% significantly outperformed the S&P 500's 23%, indicating strong long-term growth potential.
Source: tradingview.com
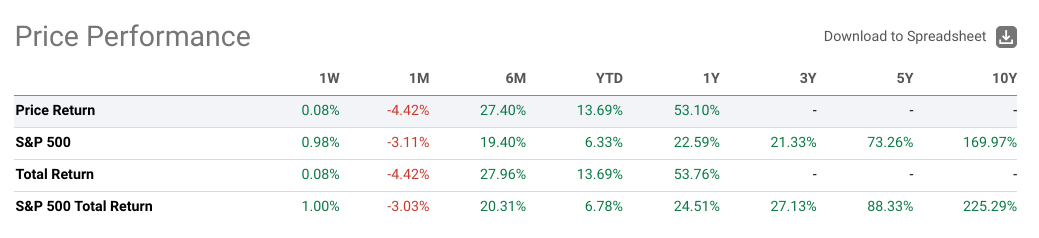
In contrast, the Roundhill Magnificent Seven ETF (NASDAQ:MAGS) shows consistent underperformance against Meta and outperformance against the S&P 500 across most time frames. While Meta's performance has been more volatile, its long-term growth potential appears stronger compared to the ETF. Investors seeking higher returns over longer periods might find Meta more attractive, while those prioritizing stability might favor the S&P 500 or ETF.
Source: seekingalpha.com (META returns)
Source: seekingalpha.com (MAGS returns)
Meta Platforms Growth Opportunities
Massive User Base and Engagement:
Meta's strength lies in its vast user base and high engagement levels across its Family of Apps.
Daily Active People (DAP):
Meta reports a substantial increase in its daily active user base, with 3.24 billion DAP on average for March 2024. This figure represents a notable 7% year-over-year growth. The consistent rise in daily active users demonstrates Meta's ability to attract and retain a massive audience across its various platforms, including Facebook, Instagram, WhatsApp, and Messenger.

Source: Q1 2024 Earnings
Ad Impressions and Average Price per Ad:
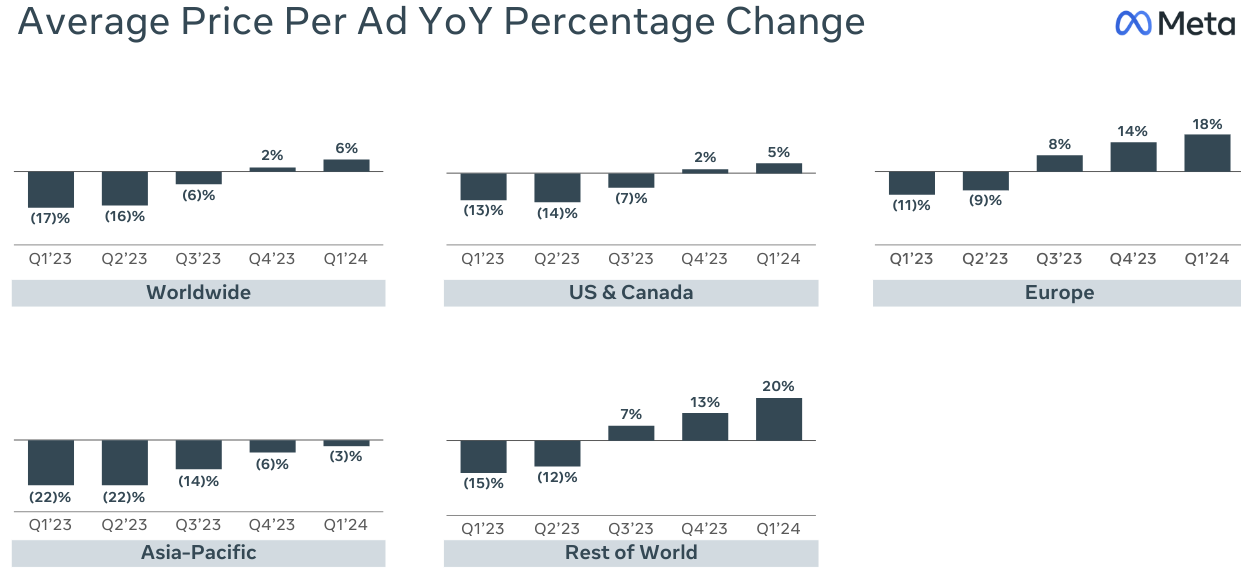
The increase in ad impressions delivered across Meta's Family of Apps reflects the high level of user engagement within the ecosystem. Despite the higher number of ad impressions, Meta managed to increase the average price per ad by 6% year-over-year. This indicates effective monetization strategies and advertiser demand within Meta's platforms.
Meta's expansive user base and robust engagement levels provide a fertile ground for advertisers, driving increased ad impressions and higher ad prices. The company's ability to effectively monetize user engagement contributes significantly to its revenue growth and financial performance.
Revenue Growth and Financial Performance:
Meta demonstrates strong revenue growth and effective cost management practices.
Total Revenue:
In the first quarter of 2024, Meta achieved a total revenue of $36.46 billion, marking a substantial 27% year-over-year increase. This impressive revenue growth reflects Meta's ability to generate substantial income from its diverse range of products and services, including advertising (Average Price Per Ad), business messaging, and other revenue streams.
Source: Q1 2024 Earnings
Cost Management:
Despite the significant revenue growth, Meta effectively managed its costs and expenses. Total costs and expenses only increased by 6% year-over-year, indicating disciplined cost management practices within the organization. This disciplined approach to cost control contributes to Meta's ability to maintain healthy profit margins and sustain long-term profitability.
Meta's strong revenue growth and disciplined cost management practices reinforce its financial stability and resilience. The company's ability to effectively balance revenue growth with cost control ensures sustainable profitability and enhances shareholder value over the long term.
Capital Allocation and Shareholder Returns:
Meta's strategic focus on capital allocation and shareholder returns is reflected in its investment in infrastructure, share repurchases, and dividends.
Capital Expenditures:
Meta prioritizes investment in infrastructure to support its ambitious AI roadmap and technological advancements. The company allocated $6.72 billion in capital expenditures, primarily directed towards servers, data centers, and network infrastructure. This investment underscores Meta's commitment to driving innovation and supporting its long-term growth initiatives.
Share Repurchases and Dividends:
Meta remains dedicated to delivering value to its shareholders through share repurchases and dividends. During the first quarter of 2024, the company repurchased $14.64 billion of its Class A common stock and paid $1.27 billion in dividends to shareholders. These actions demonstrate Meta's confidence in its financial position and its commitment to returning capital.
Strategic Focus on AI and the Metaverse:
Meta's strategic focus on advancing AI technologies and developing the Metaverse is evident in its investments and initiatives.
Advanced AI Initiatives:
Meta is committed to advancing its AI capabilities through initiatives such as Meta AI, powered by the latest model Llama 3. The company aims to build the world's leading AI service, offering innovative features such as animation creation from still images and real-time image generation. These AI advancements enhance user experiences and drive engagement across Meta's platforms.
Metaverse Development:
Meta is actively investing in the development of the Metaverse, leveraging its Reality Labs segment to pioneer advancements in mixed reality products like AR glasses and virtual reality headsets. The integration of Meta AI with smart glasses exemplifies the company's vision for the convergence of AI and immersive experiences within the Metaverse.
Meta's strategic focus on AI and the Metaverse positions the company at the forefront of technological innovation and future growth opportunities. By investing in AI advancements and Metaverse development, Meta aims to reshape the way people interact with technology and create new avenues for revenue generation and user engagement.
Forward-Looking Guidance and Innovation:
Meta provides forward-looking guidance and emphasizes its commitment to innovation and long-term growth.
Revenue Outlook:
Meta's guidance for the second quarter of 2024 forecasts continued revenue growth, with guidance ranging from $36.5 billion to $39 billion. The company expects engagement trends and monetization efficiency improvements to drive revenue performance in the coming quarters.
Investment in Future Growth:
Meta plans to increase its capital expenditures to support its ambitious AI research and product development efforts. The company anticipates aggressive investment in infrastructure to accelerate its AI roadmap and drive future growth initiatives.
Meta Platforms Challenges
Increased Capital Expenditures and Infrastructure Investments:
Meta anticipates a significant increase in capital expenditures (CapEx) for the full year 2024, with a range of $35-40 billion, compared to the prior range of $30-37 billion. This upward revision in CapEx reflects Meta's aggressive investment in infrastructure to support its AI roadmap and future product development efforts.
While strategic investments are crucial for driving innovation and sustaining growth, excessively high CapEx levels could pose risks to Meta's financial health and liquidity. The substantial increase in CapEx may strain cash flow, limit flexibility for other investments, and raise concerns among investors about the company's capital allocation decisions. Moreover, the success of these investments hinges on Meta's ability to generate returns and monetize its AI and product development initiatives effectively.
Rising Total Expenses Outpacing Revenue Growth:
Although Meta reported a robust revenue growth of 27% year-over-year, total expenses also increased, albeit at a slower rate of 6% year-over-year. This disparity between revenue and expense growth raises concerns about Meta's cost management and operational efficiency.
The rising total expenses, driven primarily by higher infrastructure and legal costs, suggest that Meta may be facing challenges in controlling operational expenditures. While investing in infrastructure and legal compliance is essential for supporting business operations and mitigating risks, excessive spending could strain profitability and hinder Meta's ability to generate sustainable returns.

Decreasing Headcount Year-over-Year:
Meta's headcount decreased by 10% year-over-year, with 69,329 employees reported as of March 31, 2024. This decline in headcount signals a noteworthy trend that could impact Meta's operations and growth prospects.
A decreasing headcount could stem from various factors such as restructuring, automation initiatives, or talent attrition. While reducing headcount might be part of cost-saving measures, it also poses risks to Meta's ability to innovate and execute its strategic initiatives effectively.
Reality Labs Operating Losses:
Meta's Reality Labs segment reported an operating loss of $3.8 billion in Q1 2024, despite the growth in revenue driven by Quest headset sales. This significant operating loss highlights challenges in achieving profitability within the segment, which focuses on developing immersive computing platforms such as virtual and mixed reality devices.
Sustained operating losses in Reality Labs could stem from various factors such as high research and development expenses, marketing costs, and infrastructure investments required to develop and scale VR and AR products. Additionally, slower-than-expected adoption of VR and AR technologies may contribute to the segment's operating losses, as it takes time to monetize emerging technologies and build a sustainable revenue stream.
Source: Q1 2024 Earnings
Meta Stock Outlook
Consensus EPS Estimates:
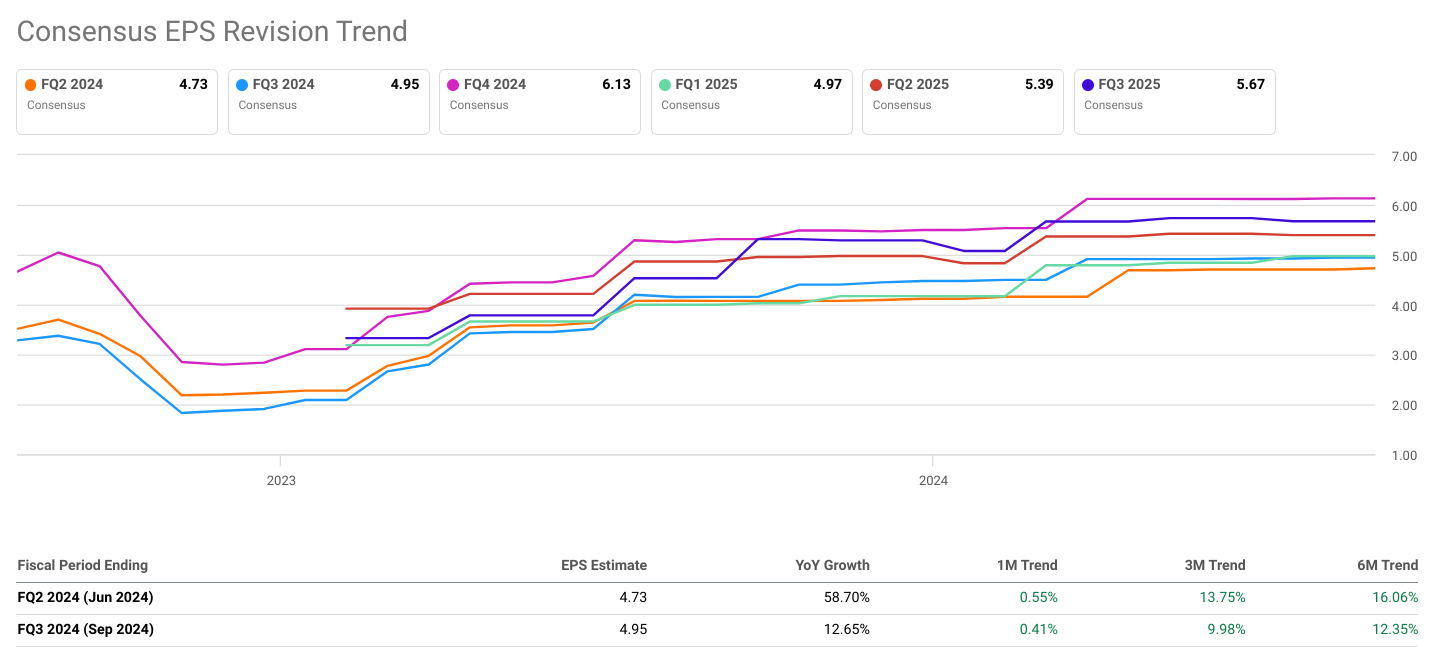
The EPS estimates for Meta (NASDAQ:META) for fiscal quarters FQ2 2024 and FQ3 2024 indicate a positive growth momentum. In FQ2 2024, the EPS estimate is $4.73, representing a substantial year-over-year (YoY) growth of 58.70%. This growth trend continues into FQ3 2024 with an estimated EPS of $4.95, albeit at a slightly lower YoY growth rate of 12.65%.
The increase in EPS estimates from FQ2 to FQ3 suggests a continued upward trajectory in Meta earnings, albeit at a slower pace. This slowdown in YoY growth from FQ2 to FQ3 could be attributed to various factors such as market saturation, increased competition, or changes in consumer behavior.
The consensus EPS estimates provided by 28 and 27 analysts for FQ2 and FQ3 2024 respectively indicate a strong confidence in Meta's ability to maintain growth in its earnings. However, investors should closely monitor whether Meta can sustain this growth momentum in the face of potential challenges.

Source: seekingalpha.com
Consensus Revenue Estimates:
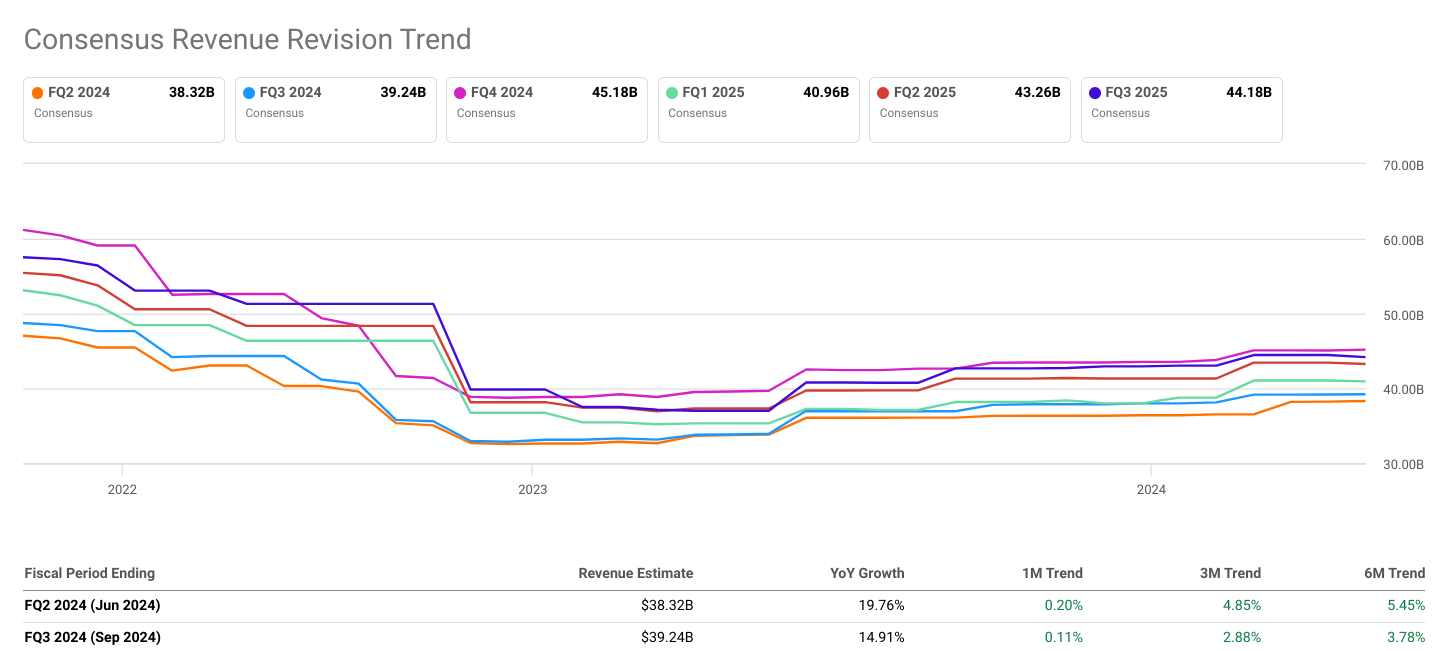
Meta's revenue estimates for FQ2 2024 and FQ3 2024 also show a positive growth outlook, although at a slightly slower pace compared to EPS. In FQ2 2024, the revenue estimate is $38.32 billion, with a YoY growth of 19.76%. This growth continues into FQ3 2024, with an estimated revenue of $39.24 billion, reflecting a YoY growth of 14.91%.
Despite the slightly lower YoY growth rate in revenue compared to EPS, the revenue estimates indicate a healthy expansion in Meta's top line. The consensus revenue estimates provided by 42 and 40 analysts for FQ2 and FQ3 2024 respectively demonstrate a strong level of interest and confidence among analysts in Meta's revenue growth potential.
Consensus EPS and Revenue Revision Trends:
Analyzing the EPS and revenue revision trends provides further insights into Meta's growth momentum. The positive revision trends over 1-month, 3-month, and 6-month periods for both EPS and revenue estimates indicate increasing optimism among analysts regarding Meta's future performance.
For EPS, the upward revisions in both FQ2 and FQ3 2024 estimates suggest that analysts are becoming more bullish on Meta's earnings potential over time. Similarly, the consistent upward revisions in revenue estimates indicate growing confidence in Meta's ability to generate higher revenues.
Source: seekingalpha.com
Internal Guidance:
Meta's internal guidance provides further insights into the company's expectations and strategic priorities for the upcoming quarters and full year 2024.
- Revenue Expectations: Meta expects second-quarter 2024 total revenue to be in the range of $36.5-39 billion, with a 1% headwind due to foreign currency. This guidance suggests continued strong revenue growth, albeit with some potential challenges from currency fluctuations.
- Expense Projections: Full-year 2024 total expenses are anticipated to be between $96-99 billion, reflecting increased infrastructure and legal costs compared to previous outlooks. Despite higher expenses, Meta remains committed to its investment initiatives and growth strategies.
- Capital Expenditures: Meta anticipates full-year 2024 capital expenditures to be in the range of $35-40 billion, up from previous estimates, as the company accelerates infrastructure investments to support its AI roadmap. This indicates Meta's focus on long-term innovation and technological advancement.
Market Growth Outlook:
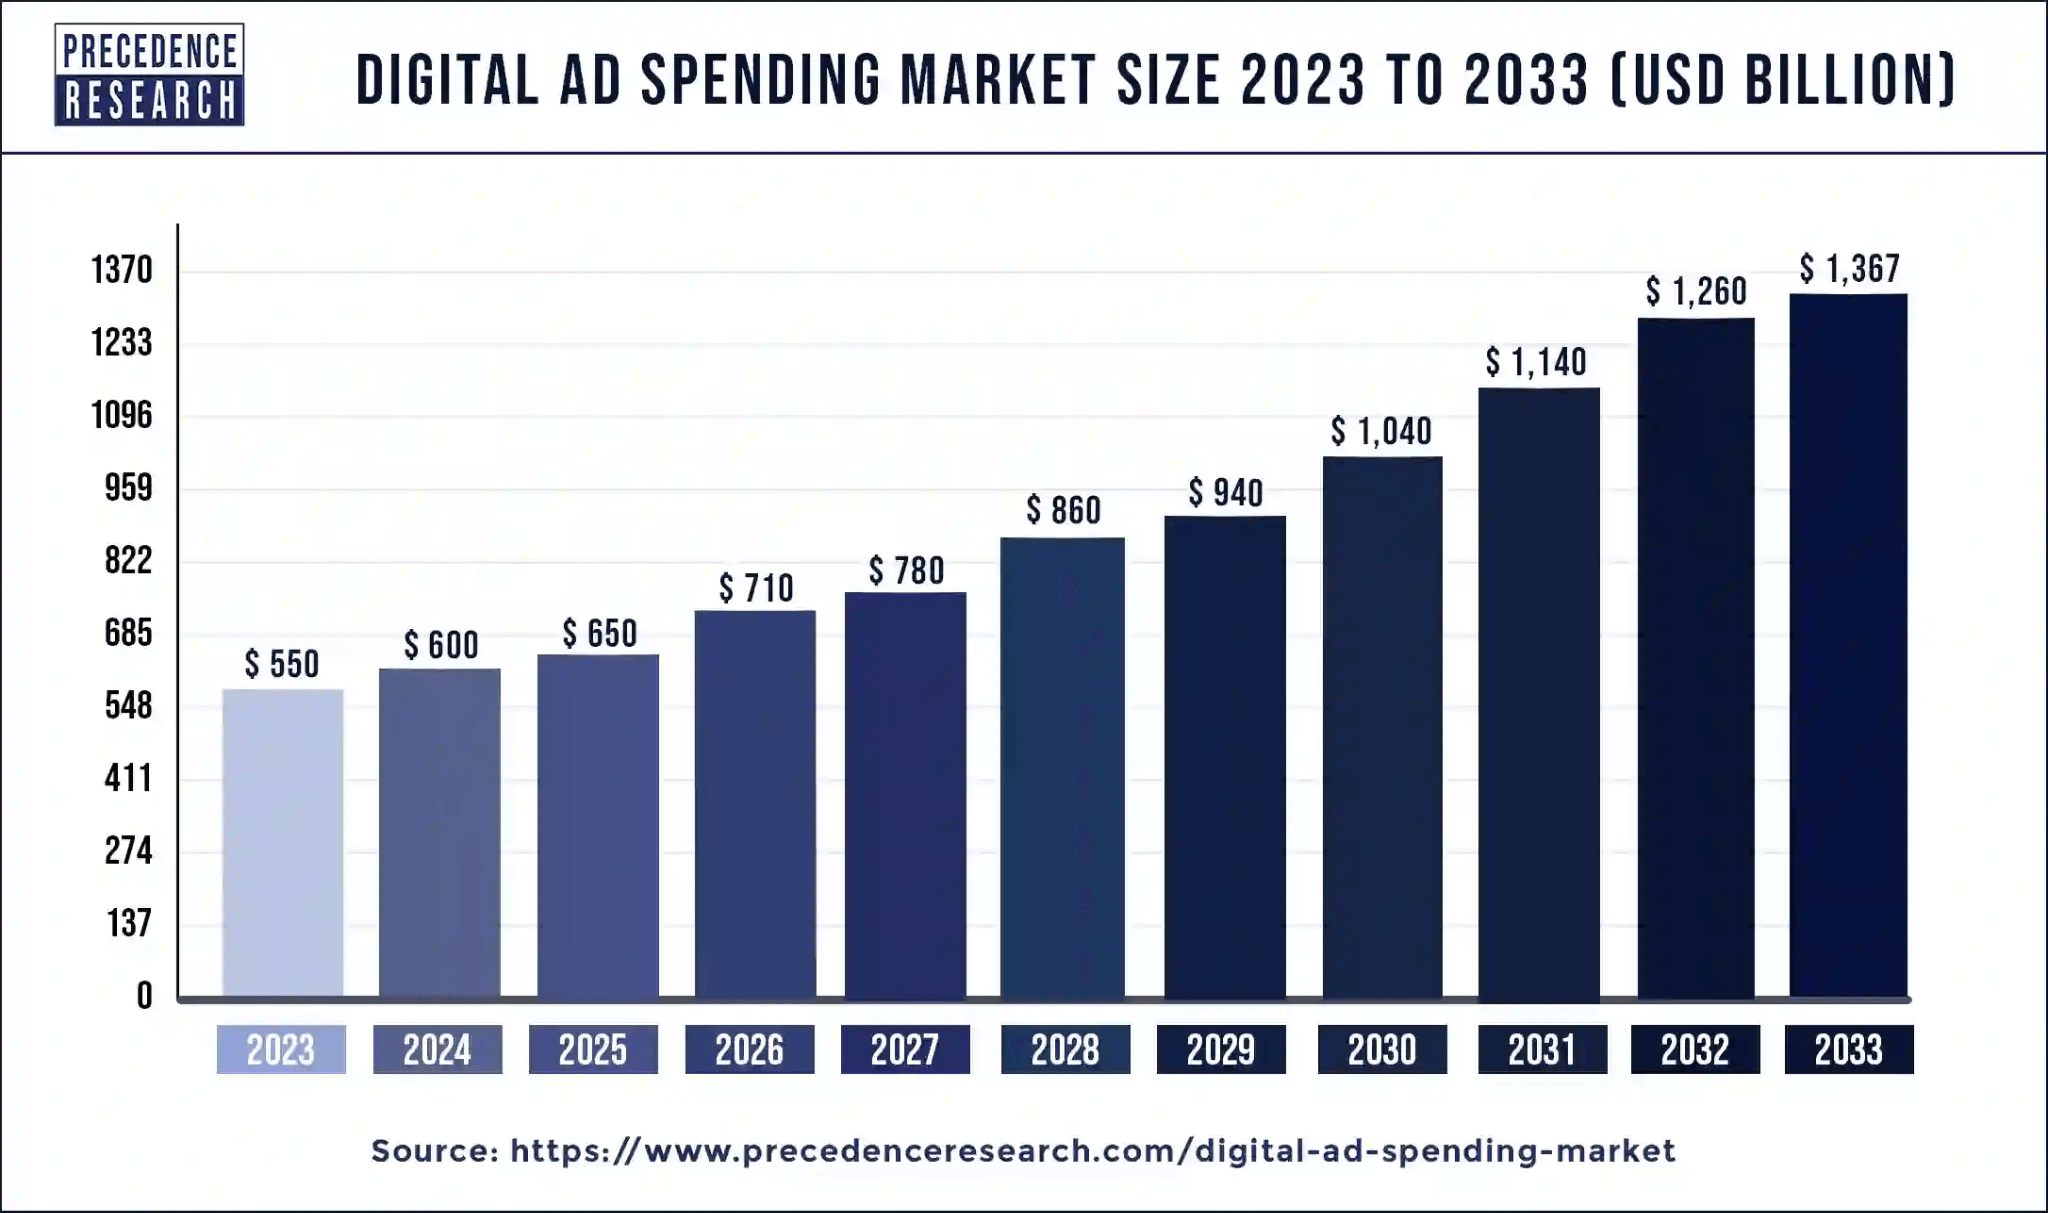
The market growth outlook for the global digital ad spending industry, as projected by precedenceresearch.com, indicates substantial potential for Meta's advertising revenue in the coming years.
The global digital ad spending market size was valued at USD 550 billion in 2023. It is expected to surpass around USD 1,367 billion by 2033, with a compound annual growth rate (CAGR) of 9.58% from 2024 to 2033.
This growth trajectory suggests significant opportunities for Meta to capitalize on the expanding digital advertising market and further enhance its revenue streams. As a leading player in the digital advertising space, Meta is well-positioned to benefit from the growing demand for online advertising services, driven by increasing internet penetration, digitalization trends, and evolving consumer behavior.
Source: precedenceresearch.com
Meta Valuation
P/E Ratio:
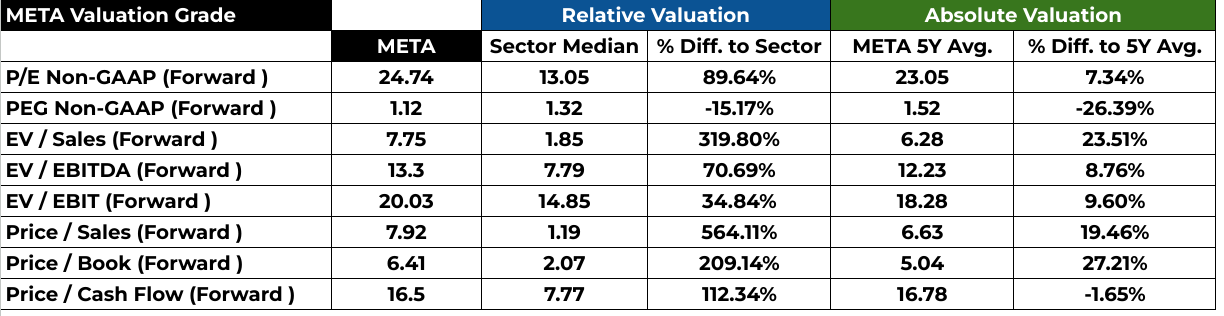
The forward P/E ratio of Meta at 24.74 is significantly higher than the sector median of 13.05 and its own 5-year average of 23.05. This indicates that investors are willing to pay a premium for Meta's earnings compared to both its industry peers and its own historical performance. The percentage difference to the sector median (89.64%) suggests a substantial overvaluation relative to the sector. This premium might be driven by expectations of strong future earnings growth or unique competitive advantages.
PEG Ratio:
Meta's forward PEG ratio of 1.12 indicates that the stock is slightly undervalued in terms of its earnings growth potential when compared to the sector median (1.32) and its own 5-year average (1.52). However, the negative differences to both the sector median (-15.17%) and 5-year average (-26.39%) imply that investors might not be fully factoring in Meta's growth prospects into the stock price. Despite being undervalued in this aspect, it's important to consider other factors influencing investor sentiment and valuation.
EV/Sales and Price/Sales Ratios:
The forward EV/Sales ratio of Meta is notably higher at 7.75 compared to the sector median of 1.85 and the 5-year average of 6.28. Similarly, the forward Price/Sales ratio of 7.92 is substantially above the sector median of 1.19 and the 5-year average of 6.63. These high ratios suggest that Meta's stock price is trading at a significant premium relative to its sales. Investors seem to be pricing in robust revenue growth potential for Meta, likely influenced by expectations related to its core business and future initiatives.
Source: Analyst's compilation
EV/EBITDA and EV/EBIT Ratios:
Meta's forward EV/EBITDA ratio of 13.3 is higher than both the sector median (7.79) and the 5-year average (12.23). Similarly, the forward EV/EBIT ratio of 20.03 exceeds the sector median (14.85) and the 5-year average (18.28). These elevated ratios indicate that Meta's valuation based on earnings before interest, taxes, depreciation, and amortization is relatively rich compared to both its industry peers and its own historical performance. Investors might be assigning a premium to Meta's profitability metrics, possibly driven by expectations of sustained or accelerated earnings growth.
Price/Book and Price/Cash Flow Ratios:
Meta's forward Price/Book ratio of 6.41 is significantly higher than the sector median of 2.07 and its own 5-year average of 5.04. This implies that investors are willing to pay a substantial premium for Meta's book value compared to both its industry peers and its historical performance. However, the forward Price/Cash Flow ratio of 16.5 is slightly higher than the sector median (7.77) but close to its 5-year average (16.78). This suggests that Meta's stock might be slightly overvalued based on its cash flow relative to historical levels, though not as dramatically as some other valuation metrics indicate.
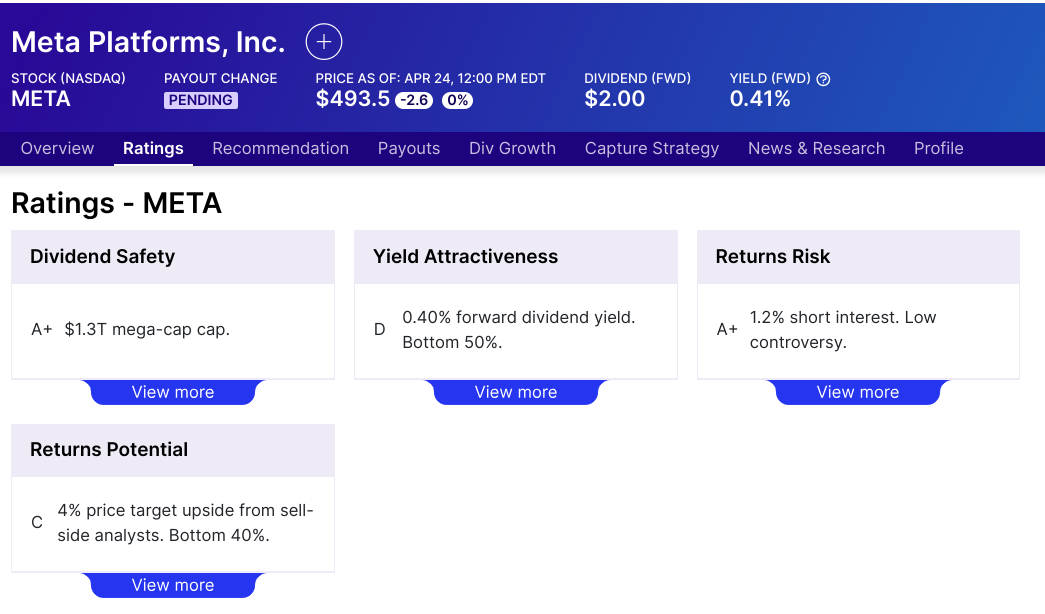
Meta Dividend Summary:
Meta's dividend yield is minimal at 0.40% with no significant payout history or dividend growth. This indicates that investors primarily focus on capital appreciation rather than income generation from dividends when investing in Meta. The lack of emphasis on dividends suggests that investors perceive Meta as a growth-oriented company with potential for future value appreciation rather than as a stable income-generating investment.
Source: dividend.com
Analyst Forecasts and Ratings:
CNN Forecasts:
The forecasted stock price for Meta (NASDAQ: META) over the next year varies significantly among analysts. The high forecast of $610.00 implies a potential increase of approximately 23.61% from the current price of $493.50, reflecting bullish sentiment. Conversely, the low forecast of $400.00 suggests a potential decrease of about 18.95%. The median forecast stands at $550.00, indicating an 11.45% increase. These forecasts reflect a broad range of opinions among analysts, with a majority (86%) suggesting a 'Buy' rating, indicating positive sentiment towards the stock's future performance.
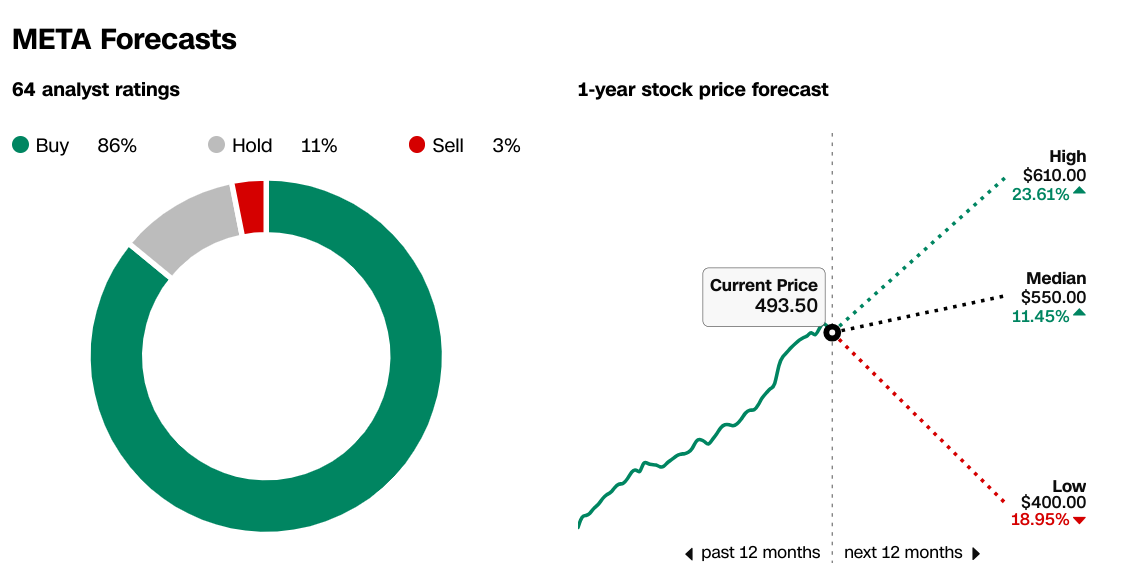
Source: CNN.com
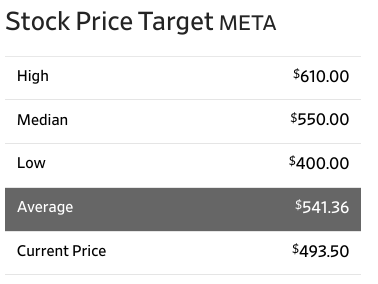
WSJ Stock Price Target:
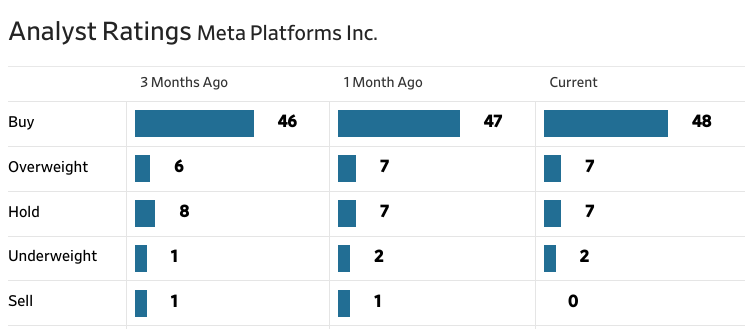
WSJ provides a similar outlook, the average price target of $541.36 falls slightly above the median, indicating a slightly bullish overall sentiment among analysts. The current price of $493.50 is below both the average and median price targets, suggesting potential upside according to analyst projections.
Analyzing the trend in analyst ratings over the past three months reveals a consistent pattern of increasing 'Buy' and 'Overweight' ratings, while 'Hold,' 'Underweight,' and 'Sell' ratings have remained relatively stable or decreased. This trend indicates growing confidence or positive sentiment among analysts regarding Meta's future performance.
source: WSJ.com
source: WSJ.com
Meta Stock Forecast 2024
Meta Stock Forecast - Trend Analysis
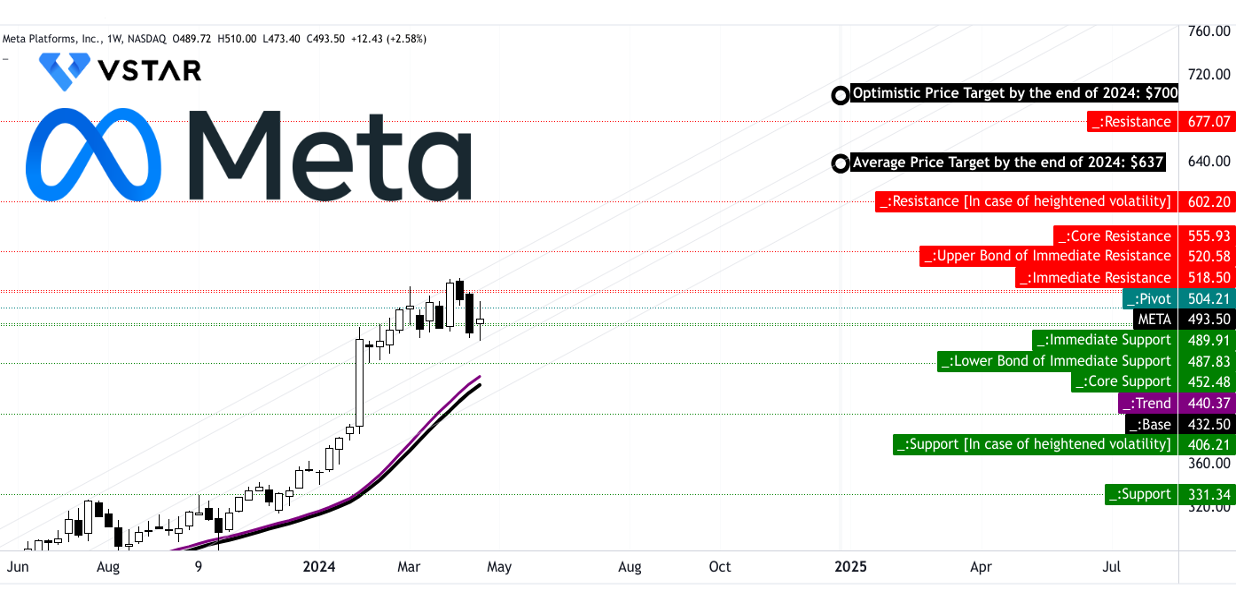
Meta's current stock price of $493.50 is notably above both the modified exponential moving average (EMA) trendline of $440.37 and the baseline of $432.50. This suggests a deviation from the established trend, potentially indicating bullish sentiment in the market. However, the assessment of the stock's direction as "sideways" implies a lack of clear momentum in either direction.
The difference between the current price and the trendline, $53.13 ($493.50 - $440.37), indicates the extent of the deviation. This positive difference signals a potential bullish bias, suggesting that the current price is trading above the trendline, which is usually interpreted as a bullish signal. However, the sideways direction suggests that this deviation may not be significant enough to establish a clear trend.
Meta Stock Price Prediction - Price Target Analysis
The provided price targets for Meta by the end of 2024 offer insights into the potential future trajectory of the stock price. The average price target of $637.00 is derived from the momentum of change-in-polarity over the mid- to short-term, projected over Fibonacci retracement/extension levels. Similarly, the optimistic price target of $700 is based on the price momentum of the current swing over the mid- to short-term, projected over Fibonacci retracement/extension levels.
Meta Stock Forecast - Support and Resistance Levels
The support and resistance levels for Meta provide important reference points for traders and investors to anticipate potential price movements. The primary support level of $487.85 serves as a critical threshold below the current price, indicating a level where buying interest may increase, potentially leading to a price bounce.
Similarly, the resistance levels at $602.20, $555.95, and $677.00 represent barriers above the current price where selling pressure may intensify, potentially leading to price reversals or slowdowns in upward momentum. Additionally, the presence of core support and resistance levels, such as $452.50 and $555.95, respectively, further reinforces the significance of these price levels in influencing price movements.
Moreover, the inclusion of support and resistance levels in case of heightened volatility ($406.20 and $602.20) acknowledges the potential for increased price fluctuations and provides additional guidance for risk management in volatile market conditions.
Source: tradingview.com
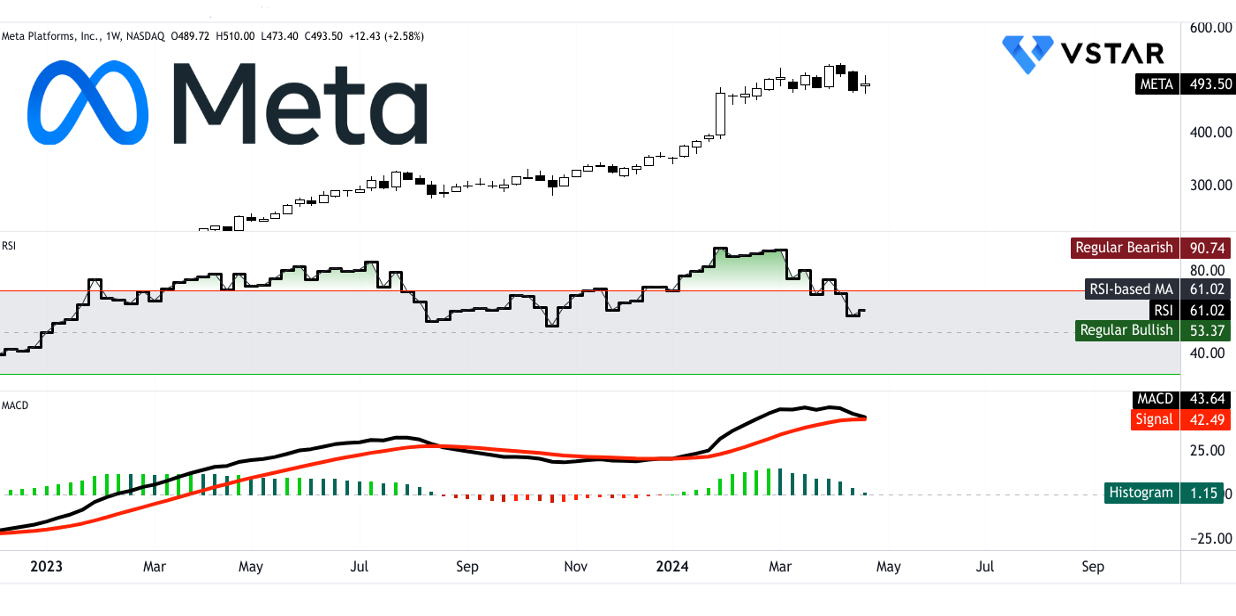
Meta Stock Price Prediction - Relative Strength Index (RSI) Analysis
The RSI value of 61.02 indicates that Meta's stock price is currently in a moderately bullish territory. However, it's essential to consider this value in relation to the regular bullish and bearish levels of 53.37 and 90.74, respectively. The RSI being above the regular bullish level suggests that the stock is exhibiting bullish characteristics, albeit not excessively.
The presence of a bearish divergence indicates a potential warning sign, suggesting that the bullish momentum may be weakening. Furthermore, the downward trend in the RSI line suggests a decrease in bullish momentum, aligning with the potential weakening of the bullish trend indicated by the sideways direction of the stock price.
Meta Stock Forecast - Moving Average Convergence/Divergence (MACD) Analysis
The MACD indicators provide further insights into Meta's stock price trend and momentum. With the MACD line at 43.64 and the signal line at 42.49, the bullish trend is confirmed, as the MACD line is above the signal line. This indicates that the short-term trend is bullish, aligning with the moderately bullish sentiment indicated by the RSI.
However, the decreasing strength of the trend, as evidenced by the decreasing MACD histogram, suggests that the bullish momentum may be waning.
Source: tradingview.com
Conclusion
Meta stock, with short-term indicators signaling slight weakness (-0.14% return) against the S&P 500. However, its robust long-term growth potential (+132% over a year) positions it favorably. Amidst market fluctuations, Meta's fundamental strengths in user engagement and revenue growth, buoyed by disciplined cost management, underscore its resilience. Strategic initiatives in AI and the Metaverse reinforce its position for future growth. Analyst sentiment is optimistic, with upward revisions in EPS and revenue estimates. While valuation metrics indicate some overvaluation, technical indicators suggest a bullish trend for 2024 with weakening momentum.