


Microsoft Stock (MSFT) declined after disclosing its fiscal second-quarter outcomes but rebounded slightly on the next day. While the results exceeded analysts' expectations, the company maintained a cautious revenue projection.
When comparing the fiscal third-quarter revenue projections, Microsoft anticipated between $60 billion and $61 billion, with a midpoint of $60.50 billion. This figure was marginally lower than the $60.93 billion predicted by analysts.
MSFT Quarterly Earnings Review
Microsoft disclosed a 17.6% year-over-year growth in revenue for the quarter concluding on December 31. The company achieved $21.87 billion in net income, equivalent to $2.93 per share, an improvement from $16.43 billion or $2.20 per share.
The Intelligent Cloud segment outperformed analysts' estimates of $25.29 billion in revenue with $25.88 billion. According to Microsoft's chief financial officer, Amy Hood, Azure and other cloud service revenue increased by 30%, with artificial intelligence contributing significantly.
Microsoft currently provides services to 53,000 Azure AI subscribers, of which one-third have joined Azure in the last year. Moreover, commitments to spend more than $1 billion on Azure increased during the quarter.
The Productivity and Business Processes division, encompassing LinkedIn and Office software, disclosed a revenue of $19.25 billion, surpassing the consensus estimate of $18.99 billion.
MSFT Stock Technical Analysis
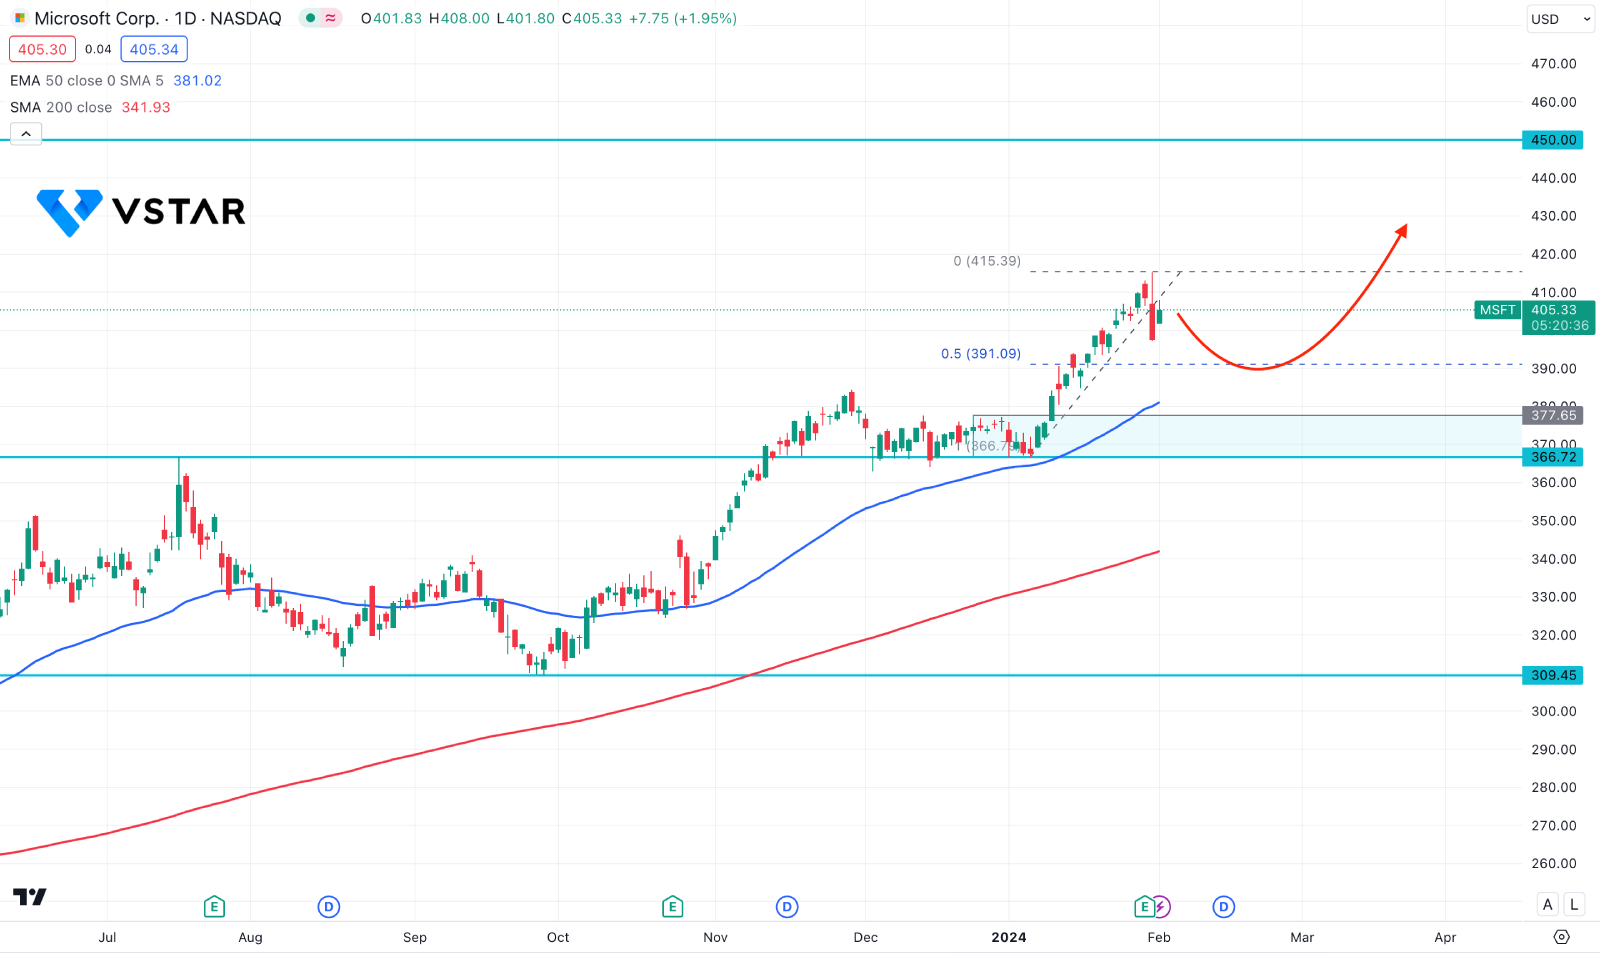
In the daily chart of MSFT stock price, the ongoing bullish pressure is valid where the dynamic 200-day Simple Moving Average works as a major support. Moreover, the 50-day EMA is above the 200 line and below the recent price with an upward slope. In this structure, the ideal trading approach would be to look at long opportunities from the near-term dynamic level.
In technical indicators, the 14-day RSI moved below the 70.00 overbought line but remained above the 50.00 neutral level. Moreover, the MACD Histogram lost bullish momentum as it reached the neutral line, while the signal line remained at the overbought level.
Based on this structure, no significant selling pressure is seen in the near-term price action, but a profit-taking is pending as a mean reversion. In that case, a bullish rebound from the 50 DMA or 377.65 to 366.72 zone could be a valid long opportunity, targeting the 450.00 psychological level.
On the bearish side, any exhaustion with a daily close below the 360.00 level could hint at a bearish signal, targeting the 309.45 major support level.


