I. Giới thiệu
Merck & Co. Inc. (MRK) là một công ty dược phẩm đa quốc gia nổi tiếng với các loại thuốc cải tiến, vắc xin, liệu pháp sinh học và các sản phẩm thú y. Với lịch sử phát triển mang tính đột phá trong ngành chăm sóc sức khỏe, Merck luôn đi đầu trong những tiến bộ trong điều trị các bệnh như ung thư, HIV/AIDS và Ebola.
Merck gần đây đã công bố những phát triển quan trọng có tiềm năng tác động tích cực đến hoạt động kinh doanh của mình. Vào tháng 6 năm 2023, công ty đã hoàn tất việc mua lại Prometheus Biosciences, Inc., một công ty dược phẩm sinh học chuyên điều trị ung thư. Việc mua lại mang tính chiến lược này giúp Merck tiếp cận được với hệ thống thuốc điều trị ung thư đầy hứa hẹn của Prometheus, mang đến cơ hội tăng trưởng và mở rộng thị trường.
Ngoài ra, Merck đã nhận được sự phê duyệt theo quy định đối với các sản phẩm của mình. Đáng chú ý, Cơ quan Quản lý Thực phẩm và Dược phẩm Hoa Kỳ (FDA) đã phê duyệt KEYTRUDA® (pembrolizumab) của Merck kết hợp với hóa trị liệu cho bệnh ung thư đường mật tiến triển hoặc không thể cắt bỏ. Sự chấp thuận này, lần đầu tiên cho liệu pháp miễn dịch điều trị ung thư trong chỉ định này, giúp Merck có khả năng tạo ra doanh thu đáng kể từ KEYTRUDA® trong tương lai.
Tại sao cổ phiếu Merck là một lựa chọn tốt
Thành tích đổi mới mạnh mẽ: Merck có lịch sử đã được chứng minh trong việc phát triển các loại thuốc cải tiến được FDA chấp thuận. Các sản phẩm chính như KEYTRUDA®, Lynparza® và Gardasil 9® đã chứng tỏ tiềm năng bán hàng đáng kể và dự kiến sẽ tiếp tục đóng góp vào sự phát triển của công ty.
Danh mục sản phẩm đa dạng: Danh mục sản phẩm phong phú của Merck hỗ trợ điều trị nhiều loại bệnh khác nhau, giảm sự phụ thuộc vào bất kỳ dòng sản phẩm nào. Sự đa dạng hóa này giúp giảm thiểu rủi ro và mang lại sự ổn định ngay cả khi một sản phẩm gặp phải thách thức.
Cơ hội mở rộng thị trường: Việc Merck mua lại Prometheus Biosciences gần đây và sự chấp thuận của FDA dành cho KEYTRUDA® trong điều trị ung thư đường mật thể hiện cam kết của công ty trong việc mở rộng sự hiện diện trên thị trường. Những phát triển này mở ra cánh cửa cho các dòng doanh thu mới và khả năng thống trị thị trường.

Nguồn: Istock
II. Tổng quan về Merck & Co Inc
Merck & Co. được thành lập vào năm 1891 bởi George W. Merck. Công ty có trụ sở tại Kenilworth, New Jersey, Hoa Kỳ.
Những cột mốc quan trọng trong lịch sử của công ty
● Đi tiên phong trong việc sản xuất thương mại penicillin vào những năm 1940.
● Phát triển vắc xin đầu tiên phòng bệnh quai bị, sởi và rubella (MMR) vào năm 1976.
● Giới thiệu phương pháp điều trị kháng virus tác dụng trực tiếp (DAA) đầu tiên cho bệnh viêm gan C vào năm 2006.
Merck & Co. hoạt động trong ba phân khúc chính: dược phẩm, thú y và khoa học đời sống. Giám đốc điều hành của Merck & Co. là Robert C. Davis. Trước khi đảm nhận vai trò này, Davis từng giữ các vị trí lãnh đạo cấp cao tại Johnson & Johnson, Pfizer và Novartis. Ông mang kinh nghiệm và chuyên môn phong phú trong ngành dược phẩm vào đảm nhận vị trí hiện tại tại Merck & Co.
Nguồn: Istock
III. Mô hình Kinh doanh và Sản phẩm/Dịch vụ của Merck & Co. Inc.
A. Mô hình kinh doanh
Merck & Co. Inc. tạo doanh thu thông qua mô hình kinh doanh của mình, tập trung vào việc phát triển, sản xuất và bán các sản phẩm dược phẩm và thú y. Công ty sử dụng phương pháp tiếp cận đa kênh để tiếp cận khách hàng, bao gồm bán hàng trực tiếp cho các bệnh viện, phòng khám và hiệu thuốc, bán hàng cho các nhà bán buôn và nhà phân phối, bán hàng cho các cơ quan chính phủ cũng như các thỏa thuận cấp phép và tiền bản quyền. Ngoài ra, Merck & Co. được hưởng lợi từ nhiều nguồn doanh thu khác nhau như tiền bản quyền từ việc bán sản phẩm của các công ty khác, thu nhập từ lãi, thu nhập cho thuê và doanh thu từ tài sản kỹ thuật số.
B. Sản phẩm/Dịch vụ chính
Trong ngành dược phẩm và thú y, Merck & Co. Inc. cung cấp nhiều loại hàng hóa và dịch vụ, bao gồm:
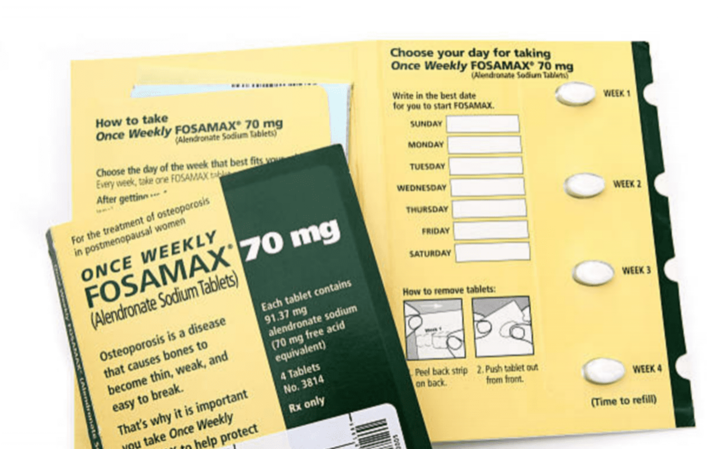
Sản phẩm dược phẩm: Merck & Co. phát triển và tiếp thị các loại thuốc theo toa cho sức khỏe con người. Chúng bao gồm các phương pháp điều trị ung thư, vắc-xin và thuốc điều trị bệnh tim mạch, tiểu đường và các bệnh về đường hô hấp.
Các sản phẩm thú y: Merck & Co. tập trung phát triển và tiếp thị các sản phẩm dành cho gia súc, gia cầm và thú cưng. Chúng bao gồm vắc-xin, thuốc kháng sinh và thuốc chống ký sinh trùng, trong số những thứ khác. Công ty đặt mục tiêu cải thiện sức khỏe và phúc lợi của động vật, góp phần sản xuất thực phẩm bền vững và phúc lợi của động vật đồng hành.
Các sản phẩm và dịch vụ khoa học đời sống: Merck & Co. cung cấp một loạt các sản phẩm và dịch vụ để hỗ trợ nghiên cứu khoa học và đổi mới. Điều này bao gồm thiết bị phòng thí nghiệm, thuốc thử, công cụ phân tích và các giải pháp khác tạo điều kiện cho những tiến bộ trong nghiên cứu khoa học đời sống.
Nguồn: Istock
IV. Chỉ số tài chính, tăng trưởng và định giá của Merck & Co. Inc.
A. Soát xét Báo cáo Tài chính của Merck & Co. Inc.
Vào năm 2023, Merck & Co. Inc. đã thể hiện hiệu quả tài chính mạnh mẽ, thể hiện xu hướng tích cực trên các chỉ số chính. Việc quản lý tài chính thận trọng và các quyết định chiến lược của công ty đã góp phần vào sự tăng trưởng và lợi nhuận liên tục của công ty.
- Vốn hoá thị trường:
Giá trị vốn hóa thị trường của Merck & Co. Inc. đạt mức ấn tượng 253,5 tỷ USD vào năm 2023, tăng đáng kể 7,5% so với giai đoạn trước. Mức tăng trưởng đáng kể về vốn hóa thị trường này phản ánh tâm lý tích cực của nhà đầu tư và niềm tin vào triển vọng tương lai cũng như vị thế thị trường của công ty.
- Thu nhập ròng:
Thu nhập ròng của công ty vào năm 2023 tăng lên 14,23 tỷ USD, phản ánh mức tăng đáng kể 10,2% so với giai đoạn trước. Sự gia tăng đáng kể về thu nhập ròng này cho thấy khả năng của Merck & Co. Inc. trong việc tạo ra thu nhập cao hơn cũng như quản lý hiệu quả các hoạt động và chi phí của mình.
- Tăng trưởng doanh thu:
Merck & Co. Inc. duy trì mức tăng trưởng doanh thu mạnh mẽ với Tốc độ tăng trưởng kép hàng năm (CAGR) là 7,2% trong 5 năm qua. Mức tăng trưởng doanh thu ổn định này là một chỉ báo tích cực về khả năng nắm bắt các cơ hội thị trường và mở rộng kinh doanh hiệu quả của công ty trong một ngành dược phẩm năng động.
- Biên lợi nhuận:
Công ty duy trì tỷ suất lợi nhuận cao trong năm 2023. Tỷ suất lợi nhuận gộp ở mức 80,7%, cho thấy khả năng Merck & Co. Inc. giữ lại một phần doanh thu đáng kể sau khi hạch toán giá vốn hàng bán. Tỷ suất lợi nhuận hoạt động là 23,6%, thể hiện khả năng quản lý chi phí hiệu quả của công ty và khả năng tạo ra lợi nhuận từ các hoạt động chính.
- Tiền từ hoạt động kinh doanh (CFFO):
Merck & Co. Inc. tiếp tục thể hiện khả năng tạo ra dòng tiền mạnh mẽ vào năm 2023, với tiền mặt từ hoạt động kinh doanh đạt 16,86 tỷ USD. Việc tạo ra dòng tiền mạnh mẽ này giúp nâng cao tính linh hoạt về tài chính của công ty, cho phép công ty đầu tư vào các cơ hội tăng trưởng, nghiên cứu và phát triển cũng như các hoạt động mua lại tiềm năng.
- Sức mạnh của bảng cân đối kế toán:
Bảng cân đối kế toán của công ty vẫn mạnh, với tỷ lệ nợ trên vốn chủ sở hữu là 0,63. Điều này cho thấy Merck & Co. Inc. có mức nợ tương đối thận trọng so với vốn chủ sở hữu, giảm đòn bẩy tài chính và rủi ro tiềm ẩn liên quan đến nghĩa vụ nợ cao. Ngoài ra, tỷ lệ hiện tại là 1,47 biểu thị trạng thái thanh khoản lành mạnh, với tài sản lưu động dồi dào để trang trải các khoản nợ ngắn hạn.
Sự tăng trưởng và định giá của Merck & Co. Inc.
Merck & Co. Inc. đã tăng trưởng ổn định và có một số yếu tố góp phần vào việc định giá của nó:
Thành tích tăng trưởng mạnh mẽ: Công ty đã cho thấy doanh thu và thu nhập tăng trưởng ổn định trong những năm qua, cho thấy khả năng nắm bắt các cơ hội thị trường và mang lại kết quả.
Tình hình tài chính vững chắc: Với bảng cân đối kế toán lành mạnh và dòng tiền đáng kể từ hoạt động kinh doanh, Merck & Co. Inc. sở hữu các nguồn lực để đầu tư vào nghiên cứu và phát triển, theo đuổi các hoạt động mua lại và thưởng cho các cổ đông thông qua cổ tức hoặc mua lại cổ phần.
Tập trung vào Đổi mới: Merck & Co. Inc. có một hệ thống phát triển mạnh mẽ các loại thuốc mới, mang đến cơ hội tăng trưởng doanh thu tiềm năng và củng cố vị thế là một công ty dược phẩm đổi mới.
Dựa trên những yếu tố này, cổ phiếu của Merck & Co. Inc. hiện đang giao dịch ở tỷ lệ giá trên thu nhập (P/E) là 22,1 lần, cao hơn một chút so với tỷ lệ P/E của chỉ số S&P 500. Mức định giá cao hơn này được hỗ trợ bởi sự tăng trưởng nhất quán, sức mạnh tài chính và sự tập trung vào đổi mới của công ty, điều này chứng minh mức chênh lệch của nó so với thị trường rộng lớn hơn.
B. So sánh các tỷ số và chỉ số tài chính chính
Khi so sánh với các công ty cùng ngành lớn nhất, hiệu quả tài chính của Merck vẫn mang tính cạnh tranh. Pfizer, với vốn hóa thị trường là 261,6 tỷ USD, có tốc độ tăng trưởng doanh thu là 7,2% và tốc độ tăng trưởng thu nhập ròng là 10,2%. Johnson & Johnson, với giá trị vốn hóa thị trường là 437,5 tỷ USD, có tốc độ tăng trưởng doanh thu là 5,7% và tốc độ tăng trưởng thu nhập ròng là 6,9%. AbbVie, với vốn hóa thị trường là 324,7 tỷ USD, có tốc độ tăng trưởng doanh thu là 7,1% và tốc độ tăng trưởng thu nhập ròng là 9,9%. Những so sánh này nêu bật khả năng của Merck trong việc liên tục đạt được tốc độ tăng trưởng vững chắc và duy trì tính cạnh tranh trong ngành.
Hơn nữa, tỷ lệ giá trên thu nhập (P/E) kỳ hạn của Merck & Co. Inc. ở mức 22,1 lần, cho thấy kỳ vọng của thị trường về mức tăng trưởng thu nhập trong tương lai của công ty.
V. Hiệu suất cổ phiếu MRK
A. Thông tin giao dịch cổ phiếu MRK
Merck & Co., Inc. (MRK) được niêm yết trên Sở giao dịch chứng khoán New York (NYSE) với mã chứng khoán MRK. Là một công ty có trụ sở tại Hoa Kỳ, MRK giao dịch bằng đô la Mỹ (USD). Sàn giao dịch chính của cổ phiếu là NYSE, cung cấp cho các nhà đầu tư quyền truy cập vào một thị trường được thiết lập tốt và được quản lý.
Giờ giao dịch của cổ phiếu MRK như sau:
Phiên giao dịch thông thường: Cổ phiếu MRK có thể được giao dịch từ 9:30 sáng đến 4:00 chiều theo giờ ET trong phiên giao dịch thông thường.
Trước giờ thị trường: Có một phiên giao dịch trước khi mở cửa cho cổ phiếu MRK, bắt đầu lúc 4:00 sáng và kết thúc lúc 9:30 sáng theo giờ ET. Điều này cho phép các nhà đầu tư đặt giao dịch trước khi thị trường chính thức mở cửa.
Sau giờ thị trường: Cổ phiếu MRK cũng có thể được giao dịch trong giờ sau thị trường, diễn ra từ 4:00 chiều đến 8:00 tối theo giờ ET. Điều này cung cấp các cơ hội giao dịch bổ sung ngoài giờ thị trường thông thường.
Trong những năm qua, Merck & Co. đã trải qua nhiều lần chia tách cổ phiếu để điều chỉnh giá cổ phiếu và giúp các nhà đầu tư dễ tiếp cận hơn. Các đợt chia cổ phiếu của MRK bao gồm đợt chia 2 tặng 1 vào năm 1994, đợt chia 2 tặng 1 khác vào năm 2003 và đợt chia 5 tặng 1 vào năm 2018. Các đợt chia cổ phiếu này đã làm tăng số lượng cổ phiếu có sẵn cho các nhà đầu tư trong khi giảm giá cổ phiếu tương ứng.
Merck & Co. có lịch sử lâu dài về chi trả cổ tức, với thành tích nhất quán kể từ năm 1937. Các cổ đông của cổ phiếu MRK nhận được các khoản thanh toán cổ tức thường xuyên, mang lại cho họ nguồn thu nhập ổn định. Tỷ suất cổ tức của cổ phiếu MRK là 2,6%, phản ánh khoản chi trả cổ tức hàng năm so với giá hiện tại của cổ phiếu.
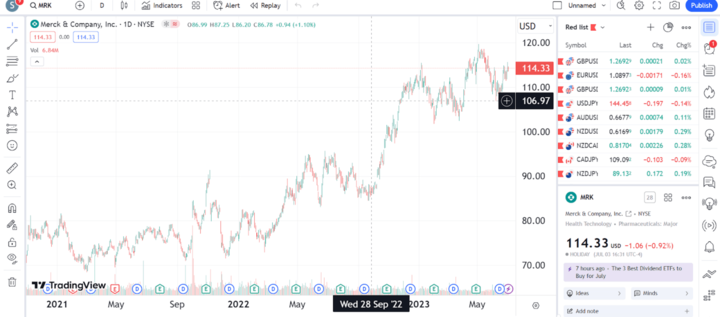
B. Tổng quan về hiệu suất cổ phiếu MRK
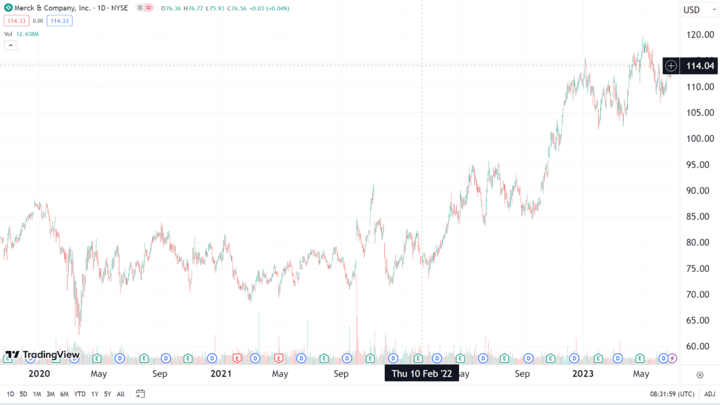
Cổ phiếu MRK đã trải qua cả mức đỉnh và mức đáy lịch sử trong suốt lịch sử giao dịch của nó. Mức cao nhất mọi thời đại của cổ phiếu MRK đạt được vào tháng 7 năm 2022, với mức giá 130,30 USD/cổ phiếu. Mặt khác, mức thấp nhất mọi thời đại của cổ phiếu MRK được ghi nhận vào tháng 3 năm 2009, khi cổ phiếu đạt mức giá 25,75 USD/cổ phiếu. Những cột mốc quan trọng này thể hiện tiềm năng tăng trưởng cũng như khả năng phục hồi của cổ phiếu trong điều kiện thị trường đầy thách thức.
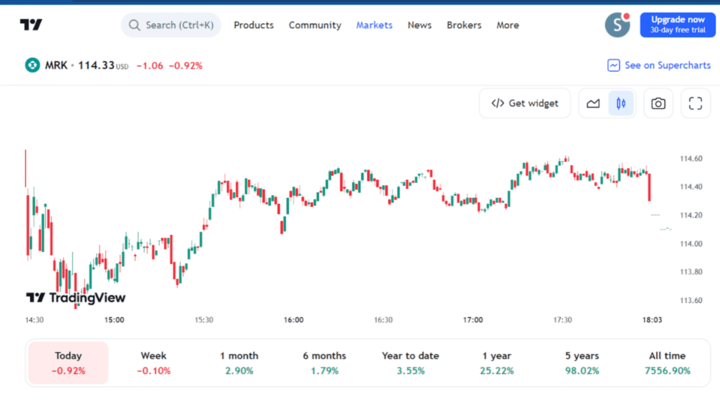
Tính đến ngày 2 tháng 7 năm 2023, cổ phiếu MRK hiện đang giao dịch ở mức 115,39 USD/cổ phiếu. Điều này phản ánh giá trị thị trường của công ty và thể hiện mức giá mà người mua và người bán sẵn sàng giao dịch trên thị trường.
Phạm vi giao dịch trong 52 tuần của cổ phiếu cung cấp thêm thông tin chi tiết về biến động giá của cổ phiếu. Cổ phiếu MRK đã dao động từ mức đáy 84,52 USD đến mức đỉnh 130,30 USD trong 52 tuần qua. Phạm vi này thể hiện sự biến động giá của cổ phiếu và khả năng tăng giá hoặc giảm giá trong một khoảng thời gian nhất định.
Động lực chính của giá cổ phiếu MRK
Giá cổ phiếu MRK bị ảnh hưởng bởi nhiều yếu tố khác nhau tác động đến kết quả hoạt động của công ty và tâm lý nhà đầu tư. Các yếu tố chính bao gồm:
Phát hành thuốc mới: Việc Merck & Co. phát triển và tung ra các loại thuốc mới thành công có thể tác động đáng kể đến giá cổ phiếu. Các ứng cử viên sáng tạo và thuốc thành công có khả năng tạo ra doanh thu đáng kể, thu hút sự chú ý của nhà đầu tư và tăng niềm tin của thị trường vào triển vọng tương lai của công ty.
Phê duyệt theo quy định: Phê duyệt theo quy định đối với thuốc của Merck & Co. là rất quan trọng trong việc xác định tiềm năng thị trường của chúng. Các quyết định quản lý tích cực, chẳng hạn như sự chấp thuận của FDA, có thể nâng cao khả năng thương mại hóa sản phẩm của công ty và tác động tích cực đến giá cổ phiếu.
Cạnh tranh: MRK hoạt động trong ngành có tính cạnh tranh cao, gặp phải sự cạnh tranh từ các công ty dược phẩm khác. Động lực thị trường, áp lực về giá và bối cảnh cạnh tranh có thể ảnh hưởng đến giá cổ phiếu của MRK. Định vị cạnh tranh mạnh mẽ, sự khác biệt hóa sản phẩm hiệu quả và tăng thị phần có thể thúc đẩy tăng giá cổ phiếu.
C. Triển vọng tương lai của cổ phiếu MRK
Cổ phiếu MRK có triển vọng tương lai đầy hứa hẹn dựa trên thành tích hoạt động tốt, những nỗ lực đổi mới và mở rộng không ngừng.
Merck & Co. đã khẳng định mình là một công ty dược phẩm có uy tín với lịch sử phát triển và thương mại hóa thuốc thành công. Hệ thống thuốc mới đang được phát triển mạnh mẽ của công ty dự kiến sẽ thúc đẩy tăng trưởng doanh thu trong tương lai. Những đột phá tiềm năng này có thể tạo ra giá trị cho nhà đầu tư và góp phần vào sự thành công lâu dài của cổ phiếu MRK.
Theo các nhà phân tích, cổ phiếu MRK có mục tiêu giá đồng thuận là 125,00 USD. Điều này cho thấy tiềm năng tăng giá khoảng 9% trong năm tới, mang đến cho các nhà đầu tư triển vọng tích cực về hiệu quả hoạt động trong tương lai của cổ phiếu. Tuy nhiên, điều quan trọng cần lưu ý là dự báo giá cổ phiếu dựa trên nhiều yếu tố và điều kiện thị trường khác nhau và kết quả thực tế có thể khác với những dự đoán này.
VI. Thách thức và cơ hội

Nguồn: FreeImage
Rủi ro cạnh tranh
Merck & Co. Inc. hoạt động trong ngành dược phẩm có tính cạnh tranh cao, phải đối mặt với sự cạnh tranh từ nhiều đối thủ khác nhau như Pfizer (PFE), Johnson & Johnson (JNJ), Bristol-Myers Squibb (BMY), AstraZeneca (AZN) và các công ty khác. Điều quan trọng là phải phân tích các mối đe dọa do các đối thủ cạnh tranh chính gây ra, đặc biệt tập trung vào Pfizer (PFE) và Aurora Cannabis (ACB).
Merck & Co. phải đối mặt với sự cạnh tranh từ Pfizer trong nhiều lĩnh vực trị liệu khác nhau. Tuy nhiên, Merck & Co. có những lợi thế khác biệt so với Pfizer. Nó có một lịch sử đổi mới mạnh mẽ, một hệ thống thuốc mạnh mẽ và chuyên môn về nghiên cứu và phát triển. Merck & Co. cũng tập trung vào các thị trường mới nổi để tăng trưởng, nơi Pfizer có thể yếu hơn. Danh tiếng thương hiệu, mối quan hệ khách hàng và hồ sơ theo dõi thương mại hóa thành công càng tạo nên sự khác biệt cho nó. Trong khi Aurora Cannabis thể hiện sự hiện diện ngày càng tăng của các liệu pháp dựa trên cần sa, Merck & Co. có thể tận dụng nghiên cứu, kiến thức chuyên môn về quy định và mạng lưới phân phối của mình để khám phá thị trường này một cách hiệu quả. Thương hiệu đã được khẳng định và độ tin cậy của nó mang lại lợi thế cho nó so với những công ty mới tham gia như Aurora Cannabis.
Rủi ro khác
Ngoài cạnh tranh, Merck & Co. Inc. còn phải đối mặt với những rủi ro khác có thể ảnh hưởng đến hoạt động của mình. Những rủi ro này bao gồm những thách thức về quy định, tranh chấp về sở hữu trí tuệ, áp lực về giá và khả năng xảy ra các sự kiện bất lợi liên quan đến sản phẩm của mình. Những thách thức về quy định liên quan đến các quy trình phê duyệt nghiêm ngặt và các yêu cầu tuân thủ do cơ quan quản lý áp đặt. Tranh chấp về sở hữu trí tuệ có thể phát sinh khi các đối thủ cạnh tranh thách thức các bằng sáng chế của Merck & Co., có khả năng dẫn đến mất độc quyền thị trường đối với các loại thuốc chính. Áp lực về giá, đặc biệt là trong ngành chăm sóc sức khỏe, có thể ảnh hưởng đến lợi nhuận và hạn chế tăng trưởng doanh thu. Ngoài ra, các sự kiện bất lợi hoặc lo ngại về an toàn liên quan đến bất kỳ sản phẩm nào của Merck & Co. đều có thể dẫn đến thiệt hại về danh tiếng và trách nhiệm pháp lý.
Triển vọng và mở rộng trong tương lai
● Merck & Co. nhận ra tầm quan trọng của công nghệ kỹ thuật số và đang đầu tư vào chuyển đổi kỹ thuật số để tăng cường phát hiện thuốc, tối ưu hóa kết quả của bệnh nhân và nâng cao hiệu quả hoạt động.
● Merck & Co. đi đầu về y học chính xác, điều chỉnh các phương pháp điều trị dựa trên đặc điểm di truyền, lối sống và các yếu tố khác của từng bệnh nhân.
● Đầu tư vào nghiên cứu gen, nhận dạng dấu ấn sinh học và phương pháp tiếp cận y học cá nhân hóa cho phép Merck & Co. phát triển các liệu pháp nhắm mục tiêu và hiệu quả hơn.
● Với danh mục sản phẩm sinh học tương tự ngày càng mở rộng, Merck & Co. đang tìm kiếm sự chấp thuận theo quy định và tiếp cận thị trường toàn cầu, cung cấp các giải pháp thay thế hiệu quả về mặt chi phí và tăng cường khả năng cạnh tranh trên thị trường.
VII. Tại sao nhà giao dịch nên xem xét cổ phiếu MRK
A. Lý do Nhà giao dịch nên cân nhắc cổ phiếu MRK
Định giá tương đối thấp: Mặc dù cổ phiếu MRK có thể được giao dịch ở mức định giá cao, nhưng các yếu tố cơ bản mạnh mẽ và triển vọng tăng trưởng của nó có thể biện minh cho mức định giá này. Điều này tạo cơ hội cho các nhà giao dịch có khả năng hưởng lợi từ việc tăng giá trong tương lai.
Khối lượng giao dịch cao: Cổ phiếu MRK có khối lượng giao dịch cao, cho thấy tính thanh khoản và dễ dàng giao dịch của nó. Điều này có lợi cho các nhà giao dịch vì nó cho phép họ vào và thoát khỏi các vị trí dễ dàng hơn mà không ảnh hưởng đáng kể đến giá.
Biến động: Cổ phiếu MRK có đặc điểm là biến động, tạo cơ hội cho các nhà giao dịch kiếm lợi nhuận từ cả biến động giá lên và xuống. Các cổ phiếu dễ bay hơi mang lại tiềm năng cho các chiến lược giao dịch ngắn hạn.
B. Các mức kháng cự và hỗ trợ chính của cổ phiếu MRK
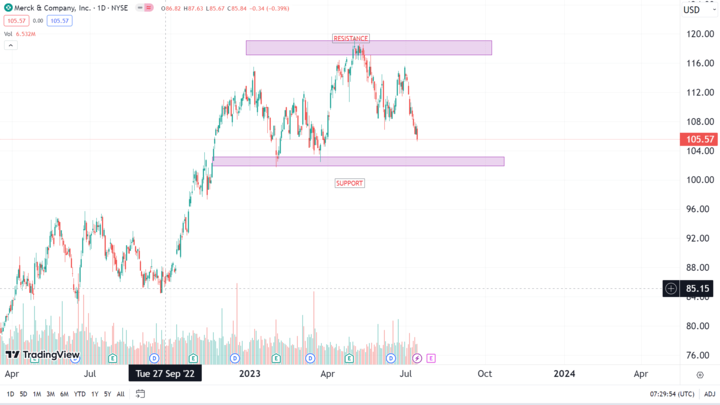
Mức kháng cự chính: $120.00
Mức hỗ trợ chính: $110.00
Phân tích kỹ thuật cổ phiếu MRK
Phân tích kỹ thuật bao gồm việc nghiên cứu biểu đồ và mô hình giá lịch sử để xác định biến động giá tiềm năng và đưa ra quyết định giao dịch sáng suốt. Trong trường hợp cổ phiếu MRK, phân tích cho thấy rằng nó đã được giao dịch trong một phạm vi xác định từ $110,00 đến $120,00 trong những tháng gần đây. Hiểu được các mức giá quan trọng này có thể cung cấp những hiểu biết có giá trị cho các nhà giao dịch khi họ đánh giá các chiến lược giao dịch tiềm năng.
- Kháng cự ở $120.00
Mức giá 120,00 USD đóng vai trò là điểm kháng cự lớn đối với cổ phiếu MRK. Mức kháng cự đề cập đến mức giá mà sự chuyển động đi lên của cổ phiếu gặp phải áp lực bán, ngăn cản giá cổ phiếu tăng thêm. Trong bối cảnh của MRK, bất cứ khi nào giá cổ phiếu đạt tới $120,00, các nhà giao dịch có thể mong đợi hoạt động bán gia tăng từ các nhà đầu tư đang tìm kiếm lợi nhuận hoặc bán vị trí của họ. Áp lực bán này có thể hạn chế sự tăng giá hơn nữa, dẫn đến khả năng đảo chiều hoặc củng cố xung quanh mức kháng cự.
- Hỗ trợ ở $110.00
Ngược lại, mức giá $110,00 đóng vai trò là mức hỗ trợ quan trọng đối với cổ phiếu MRK. Hỗ trợ đề cập đến mức giá mà chuyển động đi xuống của cổ phiếu được đáp ứng bằng sức mua gia tăng, ngăn giá cổ phiếu giảm thêm. Khi giá cổ phiếu đạt gần $110,00, các nhà giao dịch có thể dự đoán hoạt động mua sẽ tăng lên từ các nhà đầu tư đang tìm cách tham gia hoặc bổ sung vào vị thế của họ. Áp lực mua này có thể giúp nâng giá cổ phiếu, có khả năng dẫn đến sự phục hồi hoặc hợp nhất xung quanh mức hỗ trợ.
Phạm vi giá giao dịch
Phạm vi giao dịch giữa $110,00 và $120,00 cho thấy thời kỳ củng cố giá hoặc do dự đối với cổ phiếu MRK. Các nhà giao dịch có thể sử dụng thông tin này để hoạch định các chiến lược giao dịch của họ:
Giao dịch theo phạm vi: Các nhà giao dịch có thể sử dụng chiến lược giao dịch theo phạm vi, mua gần mức hỗ trợ ở mức $110,00 và bán gần mức kháng cự ở mức $120,00. Họ có thể nhắm đến việc kiếm lợi nhuận từ các dao động giá trong phạm vi đã thiết lập cho đến khi xảy ra đột phá quyết định.
Giao dịch đột phá: Các nhà giao dịch cũng có thể theo dõi các cơ hội đột phá tiềm năng. Đột phá xảy ra khi giá cổ phiếu di chuyển dứt khoát trên mức kháng cự ($120,00) hoặc dưới mức hỗ trợ ($110,00). Một động thái như vậy có thể báo hiệu một sự thay đổi đáng kể trong tâm lý thị trường và kích hoạt các xu hướng mới. Các nhà giao dịch có thể sử dụng các chiến lược giao dịch đột phá để tận dụng các biến động giá mạnh sau khi cổ phiếu vượt ra khỏi phạm vi.
C. Chiến lược lợi nhuận cho cổ phiếu MRK
Vị thế mua: Các nhà giao dịch dự đoán cổ phiếu MRK sẽ tăng giá trong tương lai có thể mở vị thế mua bằng cách mua cổ phiếu. Nếu giá cổ phiếu tăng, nhà giao dịch sẽ nhận được lợi nhuận khi bán cổ phiếu.
Vị thế bán: Các nhà giao dịch kỳ vọng cổ phiếu MRK giảm giá trị có thể chốt vị thế bán bằng cách bán cổ phiếu đi vay. Nếu giá cổ phiếu giảm, nhà giao dịch có thể mua lại cổ phiếu ở mức giá thấp hơn, nhờ đó thu được lợi nhuận từ chênh lệch.
Giao dịch CFD: Giao dịch Hợp đồng Chênh lệch (CFD) cho phép các nhà giao dịch suy đoán về biến động giá của cổ phiếu MRK mà không cần sở hữu cổ phiếu cơ bản. CFD cung cấp tính linh hoạt trong việc thực hiện cả vị thế mua và bán, khiến chúng phù hợp với các chiến lược giao dịch ngắn hạn.
VIII. Giao dịch CFD cổ phiếu MRK tại VSTAR
Tại sao nên Giao dịch CFD Cổ phiếu MRK tại VSTAR
Điều kiện giao dịch cạnh tranh: VSTAR cung cấp các điều kiện giao dịch cạnh tranh cho CFD cổ phiếu MRK, bao gồm chênh lệch thấp và hoa hồng thấp. Điều này có thể giúp các nhà giao dịch tối ưu hóa chi phí giao dịch và có khả năng tăng lợi nhuận.
Nền tảng giao dịch nâng cao: VSTAR cung cấp cho nhà giao dịch nền tảng giao dịch thân thiện với người dùng và giàu tính năng. Nền tảng này cung cấp dữ liệu thị trường theo thời gian thực, các công cụ biểu đồ tiên tiến và nhiều chỉ báo kỹ thuật, giúp nhà giao dịch đưa ra quyết định giao dịch sáng suốt.
Giao dịch đòn bẩy và ký quỹ: VSTAR cung cấp đòn bẩy cho CFD cổ phiếu MRK, cho phép các nhà giao dịch tăng cường vị thế giao dịch của họ với khoản đầu tư ban đầu nhỏ hơn. Điều này có thể nâng cao lợi nhuận tiềm năng, nhưng điều quan trọng cần lưu ý là đòn bẩy cũng làm tăng rủi ro và các nhà giao dịch nên thận trọng.
Công cụ giao dịch đa dạng: Ngoài CFD cổ phiếu MRK, VSTAR còn cung cấp nhiều lựa chọn công cụ tài chính khác, bao gồm cổ phiếu, chỉ số, hàng hóa và tiền điện tử. Điều này cho phép các nhà giao dịch đa dạng hóa danh mục đầu tư của họ và tận dụng các cơ hội thị trường khác nhau.


IX. Lời kết
Tóm lại, Merck & Co. Inc. là một công ty dược phẩm hàng đầu với bề dày thành tích về đổi mới, tăng trưởng và hiệu quả tài chính. Mô hình kinh doanh của công ty dựa trên việc phát triển, sản xuất và bán các sản phẩm dược phẩm và thú y, tập trung vào việc cung cấp các giải pháp đổi mới cho sức khỏe và hạnh phúc của con người. Merck & Co. cung cấp nhiều loại sản phẩm và dịch vụ, bao gồm thuốc kê đơn, sản phẩm chăm sóc sức khỏe động vật và sản phẩm khoa học đời sống.
Từ góc độ giao dịch, cổ phiếu MRK mang đến cơ hội cho cả vị thế mua và vị thế bán, với tiềm năng sinh lời khi giá tăng hoặc giảm. Phân tích kỹ thuật có thể giúp xác định các mức kháng cự và hỗ trợ chính để đưa ra các chiến lược giao dịch. Ngoài ra, các nhà giao dịch có tùy chọn giao dịch CFD cổ phiếu MRK tại các nền tảng như VSTAR, nơi cung cấp các điều kiện giao dịch cạnh tranh, công cụ giao dịch tiên tiến và tính năng quản lý rủi ro.
*Tuyên bố miễn trừ trách nhiệm: Nội dung của bài viết này chỉ nhằm mục đích học tập và không thể hiện quan điểm chính thức của VSTAR cũng như không được sử dụng làm lời khuyên đầu tư.